Today’s word is confidence. Sadly, it’s only a word:
Consumer confidence slumped to the lowest level in almost two years and home sales weakened, threatening U.S. household spending and bolstering the case for the Federal Reserve to keep cutting interest rates.
The Conference Board’s index of consumer confidence fell more than forecast in September, to 99.8 from 105.6.
The consequences of extreme lack of confidence are currently illustrated by the continuing Northern Rock saga, in which some possible bidders are thought to think it’s worth more dead than alive:
Former Goldman banker Chris Flowers may join the Cerberus Capital Management LP and Citadel Investment Group LLC hedge funds in splitting up Northern Rock, the Sunday Telegraph reported Sept. 23, citing an unidentified person familiar with the proposal.
A Northern Rock bail-out might cause some embarrassment with UK regulators :
The U.K.’s Financial Services Compensation Scheme has 4.4 million pounds to protect deposits, compared with $49 billion at a similar fund in the U.S., the London-based Independent reported today, without saying where it got the information.
Even that, though, is a huge bankroll compared to what we have in Canada: $1.4-billion as of 2006-3-31. The 2006 report is the one relevant to the 2007 Annual Public Meeting. Call the papers! I want to revise my confidence number!
The WSJ republished the IMF’s risk diagram, which is cool enough to be worth posting:
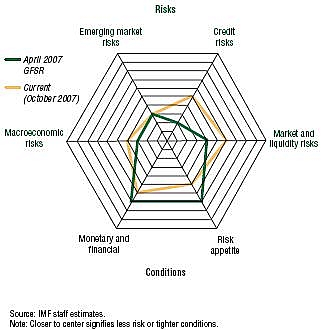
The further from the centre, the riskier the axis.
The S&P/Case-Shiller US Housing Price Indices were released today and flesh out the anecdotal descriptions of how bad the US market is:
10-City Composite was down 4.5% versus July of 2006, while the 20-City Composite was down 3.9% over the same time period.
This is the first significant yoy decline in these indices since the recession of Bush the Elder; the worst three cities for housing in the past year have been Detroit (-9.7%); Tampa (-8.8%); and San Diego (-7.8%). It’s Detroit that looks really ugly: the index level, set to a base of 100 in January 2000, is only 111.3 in July 2007, implying an annualized rate of return of less than 1.5%. So much for housing as a long term investment, in Detroit, anyway! For those who look at the detailed data and want a comparison, US Inflation data is available from the Bureau of Labour Labor Statistics: The Jan 2000 “All items less food and energy” index (US City Average, Not Seasonally Adjusted) was 100.3; July 2007 is 115.1, implying the average Case-Shiller index should be about 114.7 to stay even.
Since the 10-city composite is actually 215.9 and the 20-city composite is 198.4, there are two ways of looking at it: (i) What are those greedy Americans complaining about?, or (ii) Wow, they’ve got a lot further to fall. JDH at Econbrowser discusses the matter and worries about repercussions in the financial markets. If he’s not gloomy enough for your tastes, Dear Reader, try Nouriel Roubini:
So as JP Morgan rightly put it there is “no sign of a floor for housing”. The housing recession will continue throughout 2008 and the fall in home prices will continue into 2009 before any bottom is reached.
As an aside, the WSJ has highlighted some research by the Atlanta Fed showing that home ownership in the States increased from 64% in 1994 to 69% in 2005. The rate had been static from the mid-sixties to 1994.
Speaking of the CPI, a Bloomberg columnist has produced a column pandering to the ‘CPI Lie’ crowd. It’s certainly a pleasant change to see some actual meat on the bones of the slogan! He states, for instance:
Medical expenses are given short shrift as well. It wasn’t that long ago when employers could cover almost all of an employee’s health-care bills.
Now workers are shelling out an average of $3,281 from their paychecks for family medical coverage, according to the Kaiser Family Foundation, a non-profit organization based in Menlo Park, California. The average premium for a family policy is more than $12,000 annually.
So why is this a measure of inflation? It looks more like a cut in salary (via reduction in benefits) to me … which may come to the same thing to somebody attempting to maintain a standard of living with the same work, but should not be mis-labelled.
Willem Buiter took a break from writing for VoxEU to post to his own blog, criticizing Trichet for rising to Sarkozy’s bait. Buiter is quite right; Trichet should retain his dignity and leave the criticism of Sarkozy to me!
US equities were flat, with a few high-profile drops due to earnings-forecast revisions being greatly overemphasized by the media. Canadian equities were very slightly up, with a few advances desperately siezed on by reporters in dire need of something to report.
Treasuries had a good day, with predictions of further Fed cuts bringing some more highly-desirable term spread into the curve:
The difference in yield, or spread, between 10- and two-year yields was 63 basis points today, the widest since April 2005.
Canadas did nothing much.
It was an exciting day in the preferred share market today, almost certainly due to the BNS 5.25% Perp New Issue, which seems to have had the effect of repricing the entire spectrum of perpetuals. In other words, the universe has adjusted itself to the new issue, rather than the other way ’round.
Perpetuals dropped quite significantly, as perpetualDiscounts, yesterday priced to yield 5.09% suddenly dropped in price to yield 8bp more – exactly half of the distance between the universe and new issue yield, deciding 5.17% was a much better level. The perpetualPremium index, formerly 5.13%, is now 5.29%. This figure is not only more than the new issue yield, but is more than the perpetualDiscount yield … I would normally expect discounts to yield more than premiums, to compensate for the greater – and more immediate – interest rate risk. Markets, however, sometimes don’t listen to me as well as they should.
The Claymore Preferred share ETF had a $0.35 drop in NAV today after a distribution of $0.2185. The fund offered by my firm, MAPF, did not have its most pleasant day ever recorded, but is now well ahead of CPD on the month to date. We’ll see what the last three trading days bring!
| Note that these indices are experimental; the absolute and relative daily values are expected to change in the final version. In this version, index values are based at 1,000.0 on 2006-6-30 | |||||||
| Index | Mean Current Yield (at bid) | Mean YTW | Mean Average Trading Value | Mean Mod Dur (YTW) | Issues | Day’s Perf. | Index Value |
| Ratchet | 4.73% | 4.69% | 1,105,201 | 15.86 | 1 | +0.0000% | 1,044.5 |
| Fixed-Floater | 4.86% | 4.78% | 97,108 | 15.77 | 8 | -0.0711% | 1,030.4 |
| Floater | 4.48% | 1.82% | 82,420 | 10.76 | 3 | -0.1495% | 1,048.6 |
| Op. Retract | 4.84% | 4.15% | 76,872 | 3.30 | 15 | -0.0621% | 1,028.7 |
| Split-Share | 5.14% | 4.85% | 97,204 | 3.84 | 13 | +0.1852% | 1,046.2 |
| Interest Bearing | 6.28% | 6.71% | 64,702 | 4.25 | 3 | -0.4104% | 1,038.7 |
| Perpetual-Premium | 5.52% | 5.29% | 90,888 | 7.43 | 24 | -0.5628% | 1,025.0 |
| Perpetual-Discount | 5.12% | 5.17% | 242,292 | 15.20 | 38 | -1.3334% | 972.1 |
| Major Price Changes | |||
| Issue | Index | Change | Notes |
| CIU.PR.A | PerpetualDiscount | -3.9556% | Now with a pre-tax bid-YTW of 5.36% based on a bid of 21.61 and a limitMaturity. |
| RY.PR.G | PerpetualDiscount | -2.8621% | Now with a pre-tax bid-YTW of 5.08% based on a bid of 22.40 and a limitMaturity. |
| BNS.PR.M | PerpetualDiscount | -2.8073% | Now with a pre-tax bid-YTW of 5.00% based on a bid of 22.85 and a limitMaturity. |
| MFC.PR.B | PerpetualDiscount | -2.4268% | Now with a pre-tax bid-YTW of 5.01% based on a bid of 23.32 and a limitMaturity. |
| BAM.PR.H | OpRet | -2.3864% | Now with a pre-tax bid-YTW of 5.01% based on a bid of 25.77 and a softMaturity 2012-3-30 at 25.00. |
| BNS.PR.K | PerpetualDiscount | -2.3510% | Now with a pre-tax bid-YTW of 5.05% based on a bid of 24.09 and a limitMaturity. |
| BNS.PR.J | PerpetualDiscount | -2.3068% | Now with a pre-tax bid-YTW of 5.13% based on a bid of 25.41 and a limitMaturity. |
| MFC.PR.C | PerpetualDiscount | -2.1825% | Now with a pre-tax bid-YTW of 5.05% based on a bid of 22.41 and a limitMaturity. |
| CM.PR.I | PerpetualDiscount | -2.1638% | Now with a pre-tax bid-YTW of 5.17% based on a bid of 23.06 and a limitMaturity. |
| SLF.PR.E | PerpetualDiscount | -1.9772% | Now with a pre-tax bid-YTW of 5.07% based on a bid of 22.31 and a limitMaturity. |
| SLF.PR.D | PerpetualDiscount | -1.9772% | Now with a pre-tax bid-YTW of 5.01% based on a bid of 22.31 and a limitMaturity. |
| RY.PR.B | PerpetualDiscount | -1.9707% | Now with a pre-tax bid-YTW of 5.08% based on a bid of 23.38 and a limitMaturity. |
| BNS.PR.L | PerpetualDiscount | -1.9583% | Now with a pre-tax bid-YTW of 4.96% based on a bid of 23.03 and a limitMaturity. |
| CM.PR.H | PerpetualDiscount | -1.9071% | Now with a pre-tax bid-YTW of 5.14% based on a bid of 23.66 and a limitMaturity. |
| GWO.PR.H | PerpetualDiscount | -1.7954% | Now with a pre-tax bid-YTW of 5.17% based on a bid of 23.52 and a limitMaturity. |
| CM.PR.J | PerpetualDiscount | -1.7734% | Now with a pre-tax bid-YTW of 5.03% based on a bid of 22.71 and a limitMaturity. |
| SLF.PR.C | PerpetualDiscount | -1.7105% | Now with a pre-tax bid-YTW of 4.99% based on a bid of 22.41 and a limitMaturity. |
| NA.PR.L | PerpetualDiscount | -1.5537% | Now with a pre-tax bid-YTW of 5.38% based on a bid of 22.81 and a limitMaturity. |
| RY.PR.F | PerpetualDiscount | -1.5284% | Now with a pre-tax bid-YTW of 4.98% based on a bid of 22.55 and a limitMaturity. |
| HSB.PR.C | PerpetualDiscount | -1.3573% | Now with a pre-tax bid-YTW of 5.18% based on a bid of 24.71 and a limitMaturity. |
| SLF.PR.A | PerpetualDiscount | -1.2605% | Now with a pre-tax bid-YTW of 5.07% based on a bid of 23.50 and a limitMaturity. |
| ELF.PR.G | PerpetualDiscount | -1.2444% | Now with a pre-tax bid-YTW of 5.44% based on a bid of 22.22 and a limitMaturity. |
| BMO.PR.H | PerpetualPremium | -1.2006% | Now with a pre-tax bid-YTW of 4.99% based on a bid of 25.51 and a call 2013-3-27 at 25.00. |
| RY.PR.C | PerpetualDiscount | -1.1553% | Now with a pre-tax bid-YTW of 5.03% based on a bid of 23.10 and a limitMaturity. |
| RY.PR.E | PerpetualDiscount | -1.0855% | Now with a pre-tax bid-YTW of 4.99% based on a bid of 22.78 and a limitMaturity. |
| PWF.PR.K | PerpetualDiscount | -1.0806% | Now with a pre-tax bid-YTW of 5.27% based on a bid of 23.80 and a limitMaturity. |
| RY.PR.D | PerpetualDiscount | -1.0412% | Now with a pre-tax bid-YTW of 4.98% based on a bid of 22.81 and a limitMaturity. |
| TD.PR.O | PerpetualDiscount | -1.0056% | Now with a pre-tax bid-YTW of 4.99% based on a bid of 24.61 and a limitMaturity. |
| RY.PR.A | PerpetualDiscount | -1.0031% | Now with a pre-tax bid-YTW of 4.95% based on a bid of 22.70 and a limitMaturity. |
| FFN.PR.A | SplitShare | +1.3500% | Asset coverage of just over 2.5:1 as of September 14, according to the company. Now with a pre-tax bid-YTW of 4.50% based on a bid of 10.51 and a hardMaturity 2014-12-1 at 10.00. |
| Volume Highlights | |||
| Issue | Index | Volume | Notes |
| BNS.PR.K | PerpetualDiscount | 81,650 | RBC crossed 50,000 at 24.25, then another 20,000 at 24.20. Now with a pre-tax bid-YTW of 5.05% based on a bid of 24.09 and a limitMaturity. |
| TD.PR.N | OpRet | 32,260 | National Bank crossed 30,000 at 26.27. Now with a pre-tax bid-YTW of 3.83% based on a bid of 26.27 and a softMaturity 2014-1-30 at 25.00. |
| IGM.PR.A | OpRet | 30,130 | Now with a pre-tax bid-YTW of 3.47% based on a bid of 26.94 and a call 2009-7-30 at 26.00. |
| TD.PR.O | PerpetualDiscount | 27,525 | Now with a pre-tax bid-YTW of 4.99% based on a bid of 24.61 and a limitMaturity. |
| MFC.PR.B | PerpetualDiscount | 24,983 | Now with a pre-tax bid-YTW of 5.01% based on a bid of 23.32 and a limitMaturity. |
There were seventeen other $25-equivalent index-included issues trading over 10,000 shares today.
[…] Update, after close: What a difference a day makes! As briefly discussed in the September 25 Review, the new issue appears to have been the cause (or at least the trigger!) for a mass repricing of perpetuals. A revised table of comparibles is: […]
[…] The North American system of providing full deposit insurance on amounts up to $100,000 per institution per person is a good solution; but as I have previously mentioned, the CDIC doesn’t have enough cash in the till to be credible during a genuine crisis. They should have at least enough to recapitalize their largest member completely and the Royal Bank has capital of about $26-billion. And further, not a single dime of the CDIC’s reserve fund should be invested in Canada! […]
[…] US Consumer confidence was reported to be way down today, while housing prices declined at an accellerating rate. Geez, this is sounding a lot like my September 25 post! Perhaps I should just keep a template full of gloomy news and copy-paste! […]