An unsigned article in the Globe had some interesting quotes from Dr. Robert Schiller:
In early 2000, the Yale University economics professor’s soon-to-become hugely influential book, Irrational Exuberance, was about to hit bookshelves – illuminating the world on how market bubbles form and how they burst. The book essentially foretold the popping of the dot-com bubble only a few months later.
Now, in the aftermath of the second major stock market collapse in less than a decade, Mr. Shiller is again being asked to help explain why stocks have become so volatile.
…
Mr. Shiller’s less-than-comforting answer: We’re mostly doing it to ourselves.“I think it has to do with a different world view that we have adopted. We’re much more of an investing culture, all over the world, really, than we were in the past. There’s much more of an expectation of volatility.”
Mr. Shiller says our mass psychology is much more one of speculation and risk-taking than it was a generation or two ago. We’ve come to rely on rising markets to create our wealth and well-being, at the expense of savings.
With all respect to Dr. Schiller, I can’t help but feel that his judgement is somewhat harsh – or, at least, that part of the judgement that the Globe saw fit to publish.
We are living in an age of profound disruptive technologies. Computers … before 1980 they didn’t have much impact. Sure, mainframes made many things possible that hadn’t been possible in 1960; but they had nowhere near the impact on everyday business that they do now. Telecom … just having cheap telecom is in itself disruptive, and it only started getting cheap in the early 1990’s. Who had a cell-phone in 2000? The Internet … you can say what you like about the excesses of the Tech Bubble, but if you claim that the Internet is not a profoundly disruptive technology I won’t listen any more.
I claim that dayto-day business has been more disrupted in the past thirty years than at any other time in human history. And it seems to me that this will inevitably lead to market volatility. I’ll also note that it probably directly and indirectly allows charlatans to achieve influence in financial markets, but maybe that’s just my personal hobby-horse.
The politicization of corporate finance is picking up steam:
Bondholders with 70 percent of YRC’s $150 million of 8.5 percent notes due in April offered to tender, meeting the required threshold, the company said yesterday in a statement. That’s an increase over the 59 percent that participated by Dec. 29. Holders of 88 percent of all of the company’s outstanding bonds, with a face value of $470 million, participated in the exchange, the company said.
YRC’s $150 million of 8.5 percent notes rose 4.8 cents to 65.1 cents on the dollar yesterday, according to Trace, the bond-price reporting system of the Financial Industry Regulatory Authority.
“The most difficult bondholders to deal with were investors with credit-default swaps that paid off if the company went bankrupt,” Zollars, 62, said in a telephone interview. “It doesn’t seem right that individual investors would make money against companies surviving, particularly in this economy.”
…
The “risk of public rebuke,” along with “even more legislative threats” to the market for credit-default swaps resulting from the bankruptcy of a large employer of organized labor, helped the exchange pass, CreditSights Inc. analyst Sam Goodyear in New York wrote in a report yesterday.Hoffa said the YRC debt exchange marked “our first time doing a campaign like this where we really had to get into high finance.”
“It’s a new breakthrough for labor unions working on Wall Street to make something happen,” Hoffa said yesterday. “It’s very positive for a major company.”
There’s not enough detail in the story to take a view: maybe the exchange offer was simply a good deal; maybe CDS prices and physicals were aligned so that the CDS writers had incentive to do asset swaps with holders of physicals and then tender; maybe – as I think happened with CIT – prices aligned so that writing protection was hugely profitable for the banks, who then had extra incentive to work on the tender; it could be a lot of things.
More interesting, though, is the role of organized labour, particularly in view of GM’s sweetheart deal. Extrapolate these trends long enough and maybe you’ll eventually have mid-size companies courting the unions in order to have more political clout when things get dangerous!
In highly surprising news, artificial government inspired demand has caused prices of senior sub-prime tranches to jump:
Only months after it was started, the U.S. program designed to purge debts of no immediate discernable value from the balance sheets of troubled banks has helped transform the frozen debt into a money-maker as the bonds have rallied. Bank of America Corp. and Citigroup Inc., who received 22 percent of the $418.7 billion American taxpayers loaned to troubled financial institutions, boosted holdings on their trading books of home- loan bonds that lack government guarantees while investors were raising cash for the program, according to Federal Reserve data.
Charlotte, North Carolina-based Bank of America along with Citigroup, Morgan Stanley and Goldman Sachs Group Inc., all based in New York, added a combined $2.74 billion of the debt, for which there were few buyers as recently as March, to their short-term trading assets during the third quarter, up 13 percent from the second quarter, the most-recent data show.
…
Prices for some of the securities that the funds were supposed to buy have almost doubled since March. The rally was fueled in part by traders jumping in before PPIP funds could get off the ground, said Steve Kuhn, who helps oversee about $440 million of mortgage-bond investments for Pine River Capital Management LLC in Minnetonka, Minnesota.“Anytime people know there’s a buyer coming, they position for that, and that’s clearly what happened here,” said Kuhn, who is co-manager of the Nisswa Fixed Income Fund.
In between a motivated buyer and a motivated seller … how’s that for a trader’s dream?
The new year got off to a roaring start, with PerpetualDiscounts up 33bp and FixedResets gaining 10bp, taking the yield of the latter down to 3.57%. Volume was moderate.
| HIMIPref™ Preferred Indices These values reflect the December 2008 revision of the HIMIPref™ Indices Values are provisional and are finalized monthly |
|||||||
| Index | Mean Current Yield (at bid) |
Median YTW |
Median Average Trading Value |
Median Mod Dur (YTW) |
Issues | Day’s Perf. | Index Value |
| Ratchet | 0.00 % | 0.00 % | 0 | 0.00 | 0 | 0.5922 % | 1,636.0 |
| FixedFloater | 5.66 % | 3.82 % | 37,202 | 19.00 | 1 | 0.5236 % | 2,750.7 |
| Floater | 2.40 % | 2.77 % | 103,411 | 20.34 | 3 | 0.5922 % | 2,043.8 |
| OpRet | 4.80 % | -6.42 % | 110,202 | 0.09 | 13 | 0.0304 % | 2,334.5 |
| SplitShare | 6.39 % | -7.35 % | 186,948 | 0.08 | 2 | 0.1766 % | 2,102.3 |
| Interest-Bearing | 0.00 % | 0.00 % | 0 | 0.00 | 0 | 0.0304 % | 2,134.6 |
| Perpetual-Premium | 5.75 % | 5.67 % | 144,130 | 5.94 | 12 | 0.1712 % | 1,894.4 |
| Perpetual-Discount | 5.79 % | 5.85 % | 179,977 | 14.15 | 63 | 0.3300 % | 1,811.1 |
| FixedReset | 5.38 % | 3.57 % | 319,262 | 3.84 | 41 | 0.1038 % | 2,179.7 |
| Performance Highlights | |||
| Issue | Index | Change | Notes |
| ELF.PR.G | Perpetual-Discount | -2.34 % | YTW SCENARIO Maturity Type : Limit Maturity Maturity Date : 2040-01-04 Maturity Price : 17.51 Evaluated at bid price : 17.51 Bid-YTW : 6.82 % |
| PWF.PR.K | Perpetual-Discount | 1.03 % | YTW SCENARIO Maturity Type : Limit Maturity Maturity Date : 2040-01-04 Maturity Price : 21.63 Evaluated at bid price : 21.63 Bid-YTW : 5.83 % |
| POW.PR.B | Perpetual-Discount | 1.04 % | YTW SCENARIO Maturity Type : Limit Maturity Maturity Date : 2040-01-04 Maturity Price : 22.01 Evaluated at bid price : 22.35 Bid-YTW : 6.00 % |
| SLF.PR.A | Perpetual-Discount | 1.27 % | YTW SCENARIO Maturity Type : Limit Maturity Maturity Date : 2040-01-04 Maturity Price : 20.70 Evaluated at bid price : 20.70 Bid-YTW : 5.78 % |
| NA.PR.N | FixedReset | 1.48 % | YTW SCENARIO Maturity Type : Call Maturity Date : 2013-09-14 Maturity Price : 25.00 Evaluated at bid price : 27.40 Bid-YTW : 2.81 % |
| BMO.PR.J | Perpetual-Discount | 1.54 % | YTW SCENARIO Maturity Type : Limit Maturity Maturity Date : 2040-01-04 Maturity Price : 21.12 Evaluated at bid price : 21.12 Bid-YTW : 5.40 % |
| POW.PR.D | Perpetual-Discount | 1.64 % | YTW SCENARIO Maturity Type : Limit Maturity Maturity Date : 2040-01-04 Maturity Price : 21.12 Evaluated at bid price : 21.12 Bid-YTW : 5.95 % |
| NA.PR.L | Perpetual-Discount | 1.65 % | YTW SCENARIO Maturity Type : Limit Maturity Maturity Date : 2040-01-04 Maturity Price : 22.06 Evaluated at bid price : 22.20 Bid-YTW : 5.54 % |
| TD.PR.O | Perpetual-Discount | 1.69 % | YTW SCENARIO Maturity Type : Limit Maturity Maturity Date : 2040-01-04 Maturity Price : 23.19 Evaluated at bid price : 23.40 Bid-YTW : 5.26 % |
| HSB.PR.D | Perpetual-Discount | 2.04 % | YTW SCENARIO Maturity Type : Limit Maturity Maturity Date : 2040-01-04 Maturity Price : 21.88 Evaluated at bid price : 22.00 Bid-YTW : 5.72 % |
| BAM.PR.B | Floater | 2.37 % | YTW SCENARIO Maturity Type : Limit Maturity Maturity Date : 2040-01-04 Maturity Price : 14.25 Evaluated at bid price : 14.25 Bid-YTW : 2.77 % |
| HSB.PR.C | Perpetual-Discount | 3.01 % | YTW SCENARIO Maturity Type : Limit Maturity Maturity Date : 2040-01-04 Maturity Price : 22.73 Evaluated at bid price : 22.92 Bid-YTW : 5.60 % |
| Volume Highlights | |||
| Issue | Index | Shares Traded |
Notes |
| CM.PR.R | OpRet | 135,210 | RBC crossed blocks of 116,700 and 16,000 shares, both at 26.30. YTW SCENARIO Maturity Type : Call Maturity Date : 2010-02-03 Maturity Price : 25.60 Evaluated at bid price : 26.15 Bid-YTW : -23.99 % |
| CM.PR.D | Perpetual-Discount | 78,000 | RBC crossed 64,800 at 24.55. YTW SCENARIO Maturity Type : Limit Maturity Maturity Date : 2040-01-04 Maturity Price : 24.22 Evaluated at bid price : 24.56 Bid-YTW : 5.85 % |
| TD.PR.E | FixedReset | 50,070 | TD crossed 34,000 at 28.05. YTW SCENARIO Maturity Type : Call Maturity Date : 2014-05-30 Maturity Price : 25.00 Evaluated at bid price : 28.01 Bid-YTW : 3.61 % |
| TRP.PR.A | FixedReset | 48,296 | YTW SCENARIO Maturity Type : Call Maturity Date : 2015-01-30 Maturity Price : 25.00 Evaluated at bid price : 25.86 Bid-YTW : 3.88 % |
| TD.PR.N | OpRet | 40,600 | RBC crossed 33,900 at 26.40. YTW SCENARIO Maturity Type : Call Maturity Date : 2010-02-03 Maturity Price : 26.00 Evaluated at bid price : 26.38 Bid-YTW : -3.95 % |
| CM.PR.L | FixedReset | 27,105 | TD crossed 19,500 at 28.00. YTW SCENARIO Maturity Type : Call Maturity Date : 2014-05-30 Maturity Price : 25.00 Evaluated at bid price : 27.97 Bid-YTW : 3.51 % |
| There were 25 other index-included issues trading in excess of 10,000 shares. | |||
Update: Assiduous Reader prefhound writes in and says:
I am quite fond of Prof Shiller (no “c”) and irrational exuberance. It was he and his database that taught me the basics of long run rational stock market return expectations as the sum of Dividends + Inflation + Real EPS Growth + Changes in P/E. The reason we can’t expect the 10% returns of the 20th century from stocks are than Dividends are now 2% not 4+% and we can’t reasonably continue to expect the P/E to grow by 1% per year.
Thus, the forward outlook for gross stock returns BEFORE fees is 2% yield + 2% inflation + 1.6% + 0 = 5.6%. That is a big problem for pension plans and the CPP (which assumes more like 7+%). AND it is a great opportunity for taxable pref share investors and prefblog! Who needs stock volatility when you can get the same return with lower volatility from discount prefs and augment it with sensible switching trades?
Anyway, I mention rational expectations as a forward to another reason why I respect Shiller: the long run Real EPS growth rate does not fluctuate very much and did not fluctuate hugely around innovations like computers etc that you mention. Indeed, early innovative companies were not that profitable until recently. Competition ensures that ROE on a national scale does not vary due to innovation in the medium to long run. P/E might (and did — skyrocketing from 7.5 for the S&P-500 in 1979 to 35 in 2000).
With respect to volatility, Shiller may be right about the short-term casino-like behaviour being more common today, but I don’t see any effect on volatility. The recent credit crunch saw VIX (S&P-500 index volatility) rise to similar levels as in the 1987 crash and ease off. Volatility itself fluctuates over time (which is why there are derivatives on VIX): long run Vix data for 24 years doesn’t show a gradual decline or increase — it shows periods of spikes, mounds and retreats — and it is mean reverting. [It is hard to check out CBOE data which currently goes back only to 1990, but the old VXO precursor started in 1986 — I have an older CBOE spreadsheet with it. Even since 1990 you can see the same picture — but the VXO levels went as high as 150 on Oct 19, 1987].
Secondly on the volatility side, I’m not sure about the strength of the seemingly attractive argument about more casino-like behaviour being the “cause” of “extra volatility” not even observed.
My sense is there is more trading volume than their used to be (turnover), but that many buys are broadly matched by sells (by funds and other institutional investors, for example). As John Bogle, founder of Vanguard, often notes — weve gone from individual stock owners to mutual fund owners over 40 years. Mutual fund owners don’t change their asset mix that rapidly to affect market volatility. When they switch from Fund A to Fund B so their “advisor” can continue to receive a trailer fee there is no net buying or selling to affect market volatility.
My guess is that the “herd instinct” is as alive and as operative in amateur and professional investors alike as it ever was, and that explains why volatility is more or less the same as it has been for (at least) 25 years of the VIX.
Indeed, using Shiller’s database of 140 years of S&P monthly average data, one can show that the average annual volatility has no discernible trend over a much longer period – other than frequent spikes (see figure). Let’s not lose the forest for studying one tree in detail!
[Note: To get volatility of a magnitude comparable to VIX (which uses daily data), multiply the standard deviation in this figure by about 2.5]
I’m not sure if you and Prof. Shiller and I are all talking about the same “volatility”. VIX is a measure calculated daily using option data; I think Shiller’s comments relate more to boom-bust cycles and their frequency and severity.
Update 2010-1-6: prefhound points out that I didn’t reproduce his chart:
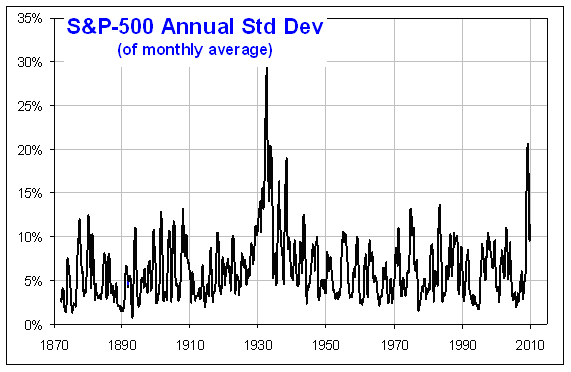
Click for big
… but I must say that I am not a big fan of standard deviation as a measure of volatility. Not for this kind of stuff, anyway.
[…] long comment by Assiduous Reader prefhound has been appended to the January 4 […]
[…] prefhound points out that I didn’t reproduce his chart when appending his comment to the January 4 post. Well, it’s reproduced […]