In the discussion of the performance of MAPF in November, I discussed the apparent tracking error of ZPR – which, as an index fund, should have minimal tracking error – and stated:
It will be remembered that I calculate performance using bid prices, while the bums at the Exchange and S&P use closing prices. This difference may well have been important under the current circumstances
So, it looks as if the jump in the index in the last two days is reasonable; and the unchanged NAV of ZPR in the last two days is what was reported by them. The scarcely credible indicated tracking error in the past two days may well be the exact truth; I will wait with bated breath for confirmation from the fund.
So ZPR has now updated its Tracking Error Chart and it looks like this:
Click for Big
It is plainly apparent that there is a surge in tracking error at the end of the month, but this is better quantified with a chart (prepared from their published raw data) that focuses on the difference of returns:
Click for Big
This makes it pretty clear that there was a big pop in tracking error on November 29, which was in most part reversed on December 2. ZPR is chugging along with a monthly tracking error of about four and a half basis points, which is what it should be doing.
OK, so what could have caused a huge increase in tracking error like that? One possibility, which I suggested in the initial discussion, is that the fund could have received a large amount of cash at monthend, and either caused distortion in the market when investing it, or simply have been caught underinvested at a time when the market rocketted upwards. The first of these explanations can now be set aside, as the tracking error returned to normal after the explosion; the not consistent with the fairly modest moves in the HIMIPref™ indices on November 29.
That’s all I can think of at the moment as far as “real” fund and market activities are concerned, so we’ll turn to technical explanations that reflect mere reporting, as opposed to actual market activity.
If we obtain the TXPL methodology from the S&P TXPL web page, we find that:
The total return calculation includes stock dividends paid in kind, stock dividends paid with the securities of an issuer other than the issuer declaring such dividend, rights distributions, and cash distributions less than 4% of the underlying stock price based on the last traded board lot.
A dollar value is calculated for the distribution to be used in the total return index calculation.
For details on total return calculations, please refer to S&P Dow Jones Indices’ Index Mathematics Methodology.
If we refer to the S&P Dow Jones Indices’ Index Mathematics Methodology as suggested, we find that:
The total return construction differs from the price index and builds the index from the price index and daily total dividend returns.
This is really cute, because the document does not state explicitly how the price index is constructed. However, there are two references to “closing prices”:
Index maintenance – reflecting changes in shares outstanding, capital actions, addition or deletion of stocks to the index – should not change the level of the index. If the S&P 500 closes at 1250 and one stock is replaced by another, after the market close, the index should open at 1250 the next morning if all of the opening prices are the same as the previous day’s closing prices.
…
Divisor adjustments are made “after the close” meaning that after the close of trading the closing prices are used to calculate the new divisor based on whatever changes are being made.
There are no meaningful references in the document to “quote”, “quotation” or “VWAP”; it is therefore reasonable to assume that S&P uses the closing price as the basis for its calculations, while the HIMIPref™ indices use the closing bid. It is better procedure, by the way, to use the closing bid: this is consistent with IFRS accounting:
Long positions should be valued at the bid price and short positions should be valued at the asking price. Assets and liabilities with offsetting market risks may be valued at mid-market prices for the offsetting risk positions and at bid or asking prices for net positions as appropriate.
This is particularly the case for illiquid securities such as Canadian preferred shares. The “closing price” – also referred to as the “last sale price” – could refer to a transaction executed in the morning before a big move … or even several weeks before, if it’s really illiquid! Additionally, and especially for a single security, the so-called “fair value” under the “closing price” regime could move by 1% (or even more) simply according to whether the last trade was a hit or a lift. However, only huge companies such as Hymas Investment Management Inc. have the in-house expertise apply this knowledge – small shops like Standard & Poor’s simply can’t compete.
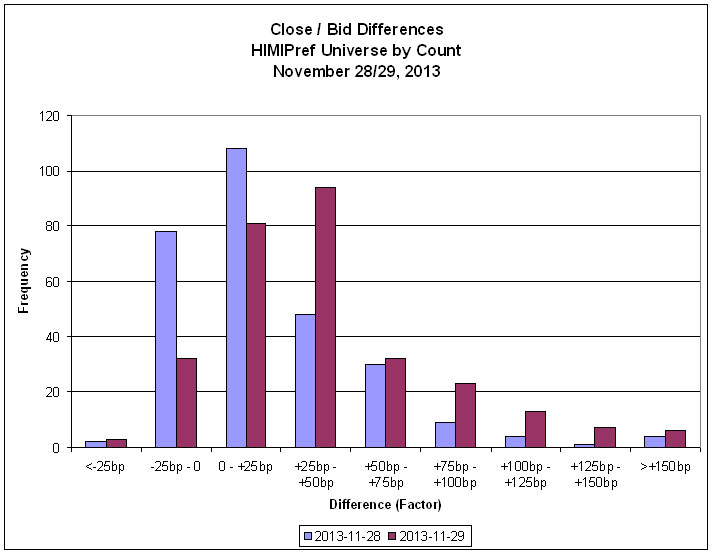
Anyway, it is useful to compare the difference between the two measures for November 28 (chosen more or less arbitrarily as a control date) and November 29. In the following chart, each security for which a close was reported by the Toronto Exchange was analyzed by dividing the close by the last bid, then subtracting one:
Click for Big
Obviously, there’s a big difference – not just in the average, but the entire distribution is skewed on the 29th. This leads us to conclude that a very large proportion of last trades on the 29th were at the asking price – this might be indicative of a big player taking a meaningful position on the last day of the month, while being willing to absorb the costs of the market spread. Or it could be random market fluctuation – but obviously a very rare one, given the reasonableness of the ZPR tracking error over time. The effect is too small and too broad to be anything nefarious, like high-closing … or if it is nefarious, it’s more complex than the usual manipulation!
The existence of the skew leads one to wonder whether the effect was:
(i) confined to a particular credit strata, and/or
(ii) confined to a particular structure.
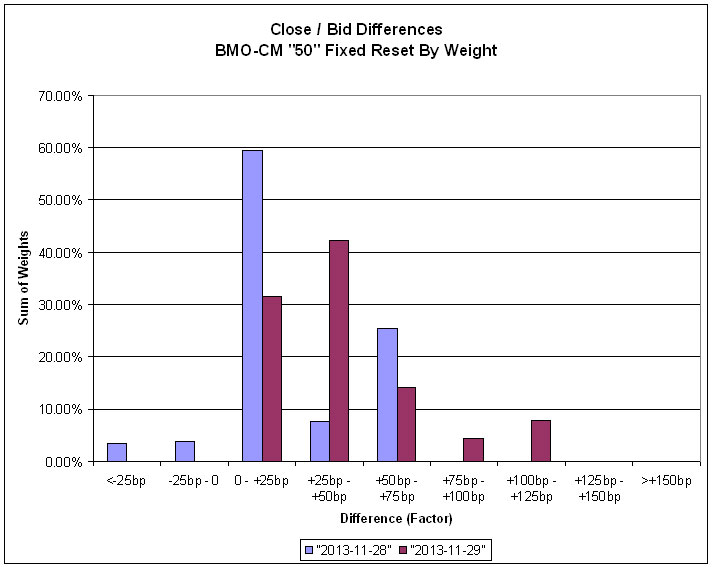
To investigate this, I have analyzed the BMO-CM “50” index, largely on the grounds that this is easy for me.
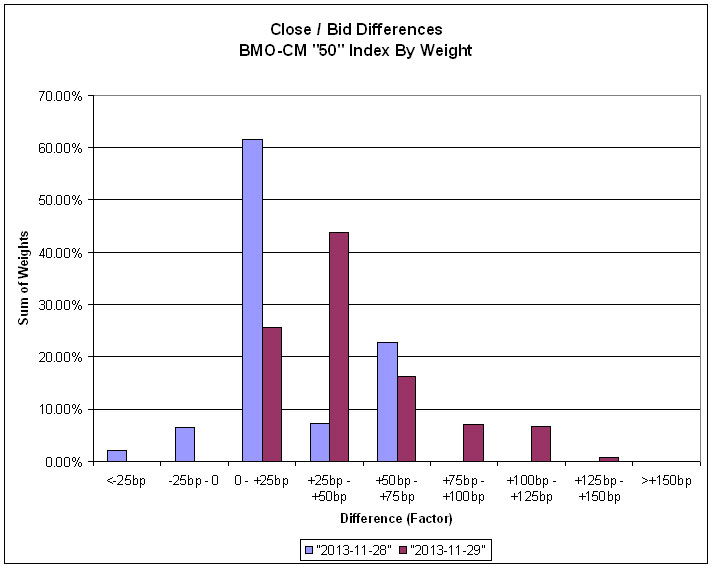
Click for Big
The BMO-CM “50” is largely investment-grade (one reason why I like it!) and the effect appears to be proportional to that observed for the universe. The weighted average close/bid factor on the 28th is 1.0021 (that is to say, 21bp), while on the 29th it’s 43bp. This compares to unweighted averages for the universe of 26bp and 41bp; pretty close, I’d say, implying that the effect is much the same in this (mostly) investment-grade sample as it is for the universe.
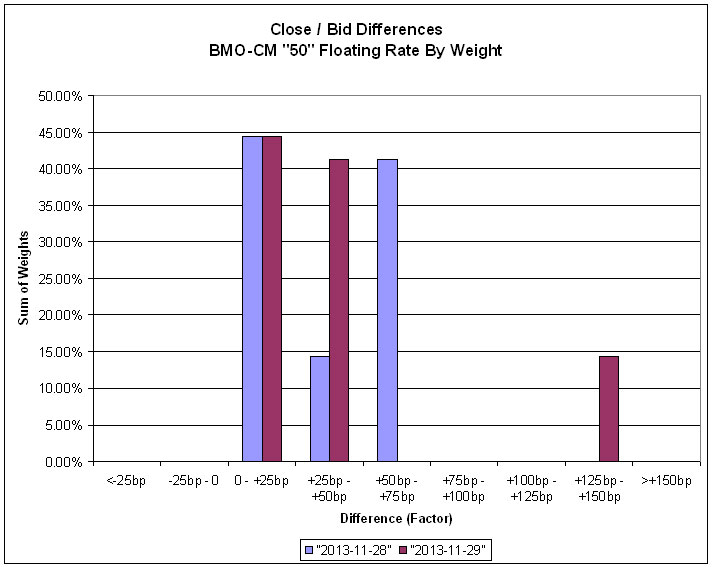
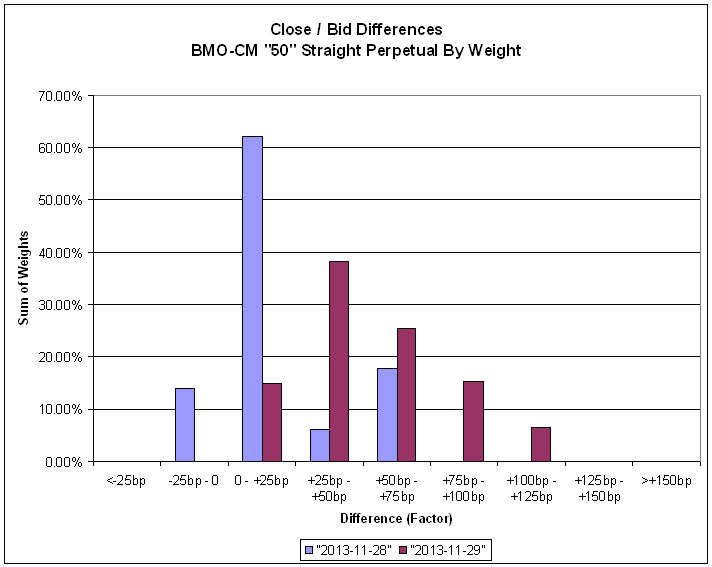
We can draw more conclusions when we break down the results according to the sectors defined by the BMO-CM 50 analysts:

Click for Big
Click for Big
Click for Big
Click for Big
Average last-trade / last-bid factors are:
| BMO-CM “50” Sectors Weighted Average Last Trade / Last Bid Difference from Unity |
||
| Sector | November 28, 2013 | November 29, 2013 |
| Retractable | 7bp | 30bp |
| Floating Rate | 38bp | 43bp |
| Straight Perpetual | 19bp | 47bp |
| Fixed Reset | 21bp | 42bp |
So, with the exception of Floating Rate (which is a very small sector; conclusions one way or another are hard to support) we may conclude that the effect is present irrespective of preferred share structure. We also note that volume was very heavy on November 29.
This in turn leads us to believe that there was some very heavy, broadly based buying pressure on November 29; this was probably not from ZPR, which did not have any meaningful jump in tracking error as of December 1 (I have an inquiry into the fund, seeking to veryify that it values itself at the closing bid); it might have been from CPD, which had no meaningful tracking error in November and values itself at the closing price; or it may have been somebody else entirely – index funds aren’t the only indexers!
Note that given the broad base of the buying, the indexer (or index fund) won’t have lost much against the index, but it will have absorbed much of the bid-ask spread; however – and this is the critical bit – the index will have also absorbed much of the bid-ask spread. However, his clients can at least be relieved that he didn’t go nuts; he absorbed the spread, but a reasonable spread, nothing like the CPD / POW.PR.C fiasco in January, 2010.
And, to my heartfelt relief, we may also conclude that MAPF will probably get a boost to its December performance vis a vis the indices (on the order of 60bp, if we can take ZPR as an indicator; or 20-odd bp if the BMO-CM “50” close/bid ratios are indicative), as the close/bid differential (probably!) returns to normal.
Update, 2013-12-6 The plot thickens! My contact at BMO tells me that the valuation of ZPR is at the closing price, not the closing bid, which knocks out the price / bid explanation of the increase in tracking error. He is checking to see if he can determine the source of the discrepency, but in the meantime, here’s another possibility…
Mutual Funds love to inform everybody that trades are reflected in the valuation as of the Trade Date, but I happen to know that this was very often not the case – at least, it was very often not the case back in 2008. Things may have changed in the interim, although I doubt it.
Many clients like to see that their funds are valued by external valuators, because this allows them to tick a box on their due-diligence checklist. However, there is at least one enormous external valuator (very big, and my goodness, they charge the earth for it, which is why I’ve never been a client) that does not actually do this. Reflecting trades on Trade Date would mean that the trade lists wouldn’t be available prior to 4:00pm; and not even then if you insist on including extended hours trading, so the staff wouldn’t be able to go home at five which is the whole point of working for a big company. Instead, trades are reflected in the valuation on date T+1. As I know from personal experience, morons are fond of telling people that this means there’s no point in investing client cash received on day T, but luckily my Assiduous Readers are not morons.
I don’t know who does the valuation for ZPR, because I’m not a B-School grad and therefore don’t make a fetish of ticky-boxes. But it is possible that whoever does the valuation does it in accordance with the delayed reflection of trades explained above.
So it is possible that at least part of the ZPR tracking error is due to this: if they had a big whack of cash to invest on the 29th and invested it towards the close (which distorted the closing price / bid relationship, as we have seen), these trades would not be reflected on their calculated NAV – the portfolio would still have contained the cash for valuation purposes. Readers will recall my earlier discussion of the tracking error problem:
The fund has been able to attract assets of about $912.8-million in the year-odd since inception; a huge gain of $75-million in November. I feel that the flows into and out of this fund are very important in determining the performance of its constituents. I suspect that the November flows had a strong effect on the performance of FixedResets over the month.
Mind you, this does not even attempt to explain all the error: TXPL gained 45bp on November 29, while the fund’s reported NAV was down 15bp. A 10% cash weight in the (apparent) portfolio would only result in a cash drag of 4-5bp over the single day (which would be recovered on the next valuation on T+1, in which the day T trades would be included). But it could be part of it.