There was an article on Bloomberg about tech worker visas in the US:
Along with temporary deportation relief for millions, President Obama’s executive action will increase the number of U.S. college graduates from abroad who can temporarily be hired by U.S. corporations. That hasn’t satisfied tech companies and trade groups, which contend more green cards or guest worker visas are needed to keep tech industries growing because of a shortage of qualified American workers. But scholars say there’s a problem with that argument: The tech worker shortage doesn’t actually exist.
The argument against the tech worker shortage is presented in a paper by Hal Salzman, Daniel Kuehn, and B. Lindsay Lowell titled Guestworkers in the high-skill U.S. labor market:
This paper reviews and analyzes the science, technology, engineering, and mathematics (STEM) labor market and workforce and the supply of high-skill temporary foreign workers, who serve as “guestworkers.” It addresses three central issues in the ongoing discussion about the need for high-skill guestworkers in the United States:
Is there a problem producing enough STEM-educated students at sufficient performance levels to supply the labor market?
How large is the flow of guestworkers into the STEM workforce and into the information technology (IT) workforce in particular? And what are the characteristics of these workers?What are the dynamics of the STEM labor market, and what are the employment and wage trends in the IT labor market?
Analysis of these issues provides the basis for assessing the extent of demand for STEM workers and the impact of guestworker flows on the STEM and IT workforces.
…
The IT industry was able to attract increasing numbers of domestic graduates during periods of rising wages and employment, leading to a peak in wages and numbers of computer science graduates in the early 2000s. Since that time, the IT industry appears to be functioning with two distinct market patterns: a domestic supply (of workers and students) that responds to wage signals (and other aspects of working conditions such as future career prospects), and a guestworker supply that appears to be abundantly available even in times of relatively weak demand and even when wages decline or are stagnant.Workers from countries with low wages and limited career opportunities will find the U.S. IT labor market attractive even when wages are too low and career opportunities too limited to increase the IT supply from domestic students and workers. In other words, the data suggest that current U.S. immigration policies that facilitate large flows of guestworkers appear to provide firms with access to labor that will be in plentiful supply at wages that are too low to induce a significantly increased supply from the domestic workforce.
Very interesting, but there are some policy questions left unaddressed. The first is a question of equilibrium – one would hope, from economic theory, that supply and demand for professionals of a given type will result in an equilibrium, as high wages increase supply (of people entering undergraduate studies in the field) and decrease demand (as projects become less profitable due to higher wages.
So question #1 is: given that programming is a well-paid sector (average salary in excess of $80,000, according to Figure K of the paper), and given that the end-product is so easily transported, does it not make sense to grant visas in order to increase the global market share of the US? This isn’t a “TFWs at Timmy’s” issue, these are services that are exported and have major spin-off benefits.
Question #2 (which is actually more relevant to the paper as written) is: is the population of IT guest-workers equivalent in any rough kind o way to the population of domestic workers? There is a huge variation of skill among professional programmers, with what I call ‘teeny-bopper programmers’ at the low end … they can do a competent job of coding as long as you give them their assignments in small chunks … but if they design a large project, you end up with spaghetti code that after a few iterations becomes undebuggable and unimprovable (it is my understanding that that is what happened to dBase). Designing a programme, determining how it will be broken down into modules, which talk to each other this way and rely on these common underlying functions … that’s a very highly skilled job.
So what’s the salary distribution of guest-workers compared to the salary distribution of domestic workers? If guest-workers are all in – say – the top tercile of domestic salaries, then the paper’s argument loses a lot of its validity.
Speaking of equilibrium labour markets, it’s good times for retailers:
Workers are facing the most favorable job market for seasonal work since the 18-month recession that started in December 2007, getting hired with fewer interviews and in some cases with higher pay.
About 821,000 workers will be hired for retail seasonal jobs this year, up 11 percent from a year ago and the highest since records were started in 1990, estimates Michael Niemira, former director of research for the International Council of Shopping Centers Inc. and now founder of economic forecasting firm The Retail Economist LLC in Tucson, Arizona.
…
“I don’t want to say there is pressure on wages but there is an alignment of wages with demand,” said Jack Kleinhenz, chief economist with the National Retail Federation in Washington, who is estimating as many as 800,000 workers will be added. “There is some tightening” in the job market.The unemployment rate for the retail and wholesale trade sector fell to 5.1 percent in October, the lowest since early 2008 in the initial months of the recession, Labor Department figures show. Wages and salaries for retail workers rose 2.5 percent in the third quarter from the same period in 2013, the biggest increase in more than four years, according to the Bureau of Labor Statistics data.
Seasonal job seekers using the website Snagajob.com are finding work in an average of 28 days this year compared with 45 days last year, company Chief Executive Officer Peter Harrison said. The Richmond, Virginia-based online matching service focuses on part-time and hourly positions.
Investment grade new issues have set a new record:
Investment-grade corporate debt sales have surged to a record $1.15 trillion this year as the most creditworthy borrowers flocked to the U.S. bond market to take advantage of historically low interest rates.
Apple Inc. (AAPL), Verizon Communications Inc. and Oracle Corp. were among borrowers that helped swell issuance this year. JPMorgan Chase & Co. was the the top underwriter for the fifth-straight year, grabbing 12.7 percent of the deals, according to data compiled by Bloomberg.
Alibaba Group Holdings Ltd., Asia’s biggest Internet company, led borrowings of more than $126 billion this month that helped sales breach last year’s record of $1.13 trillion. Companies have raced to the market to lock in borrowing costs that remain within 0.5 percentage point of the all-time low of 2.65 percent reached in 2013, Bank of America Merrill Lynch index data show.
Investors purchasing the debt have reaped 7.3 percent gains in 2014, overcoming the 1.5 percent loss last year, index data show. Investment-grade bonds are rated above Ba1 by Moody’s Investors Service and BB+ at Standard & Poor’s.
But it’s not good news all ’round:
Leveraged loan issuance plummeted in the U.S. this month as investors punished borrowers in an increasingly volatile market for high-yield, high-risk debt.
Borrowers including TransFirst Inc. and Norwegian Cruise Line Holdings Ltd. have sold $6.5 billion of U.S leveraged loans to institutional investors in what’s poised to be the slowest November since 2008, according to data compiled by Bloomberg. Volume was almost $30 billion in October. Fewer deals are getting done after loan prices plunged more than 3 percent last month from a July peak and yields rose to 6.2 percent, the highest in more than two years.
…
The drop-off in issuance comes as regulators scrutinize Wall Street’s lending practices and demand for the speculative-grade debt fades. Leveraged loans are typically issued by companies that have ratings of less than Baa3 by Moody’s Investors Service and below BBB- by Standard & Poor’s.
Remember how the Competition Ha-Ha Board (the guys who made the discovery that not all on-line reviews are legitimate) gave the banks permission to extend their hegemony on financial services as long as they paid sufficient money to their regulatory buddies? Well, it’s going to get even better!
The chair of the Ontario Securities Commission has inked a new deal to co-operate on investigations with his former employer, the federal Competition Bureau, which he headed in the early 1990s.
While the two regulatory bodies have far different mandates, they say there are enough areas of mutual interest to work on fraud investigations, exchange “information and intelligence,” and undertake joint education initiatives.
It was a mixed day for the Canadian preferred share market, with PerpetualDiscounts down 20bp, FixedResets off 9bp and DeemedRetractibles gaining 13bp. Volatility was good, with a preponderance of FixedReset losers. Volume was above average.
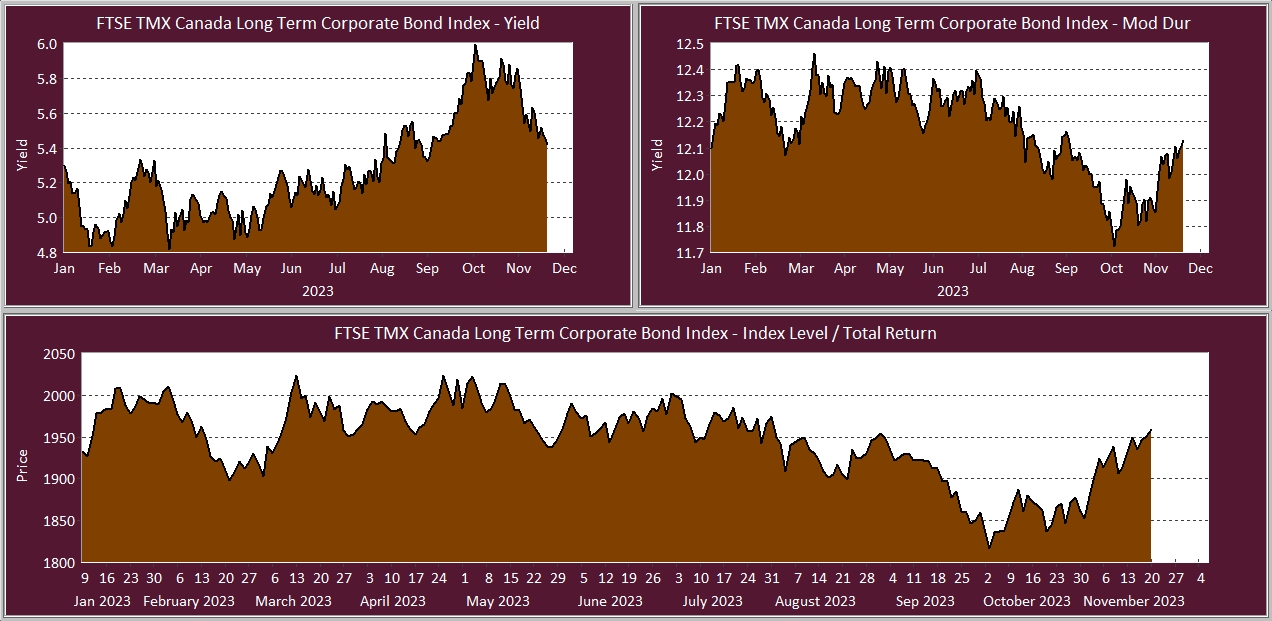
PerpetualDiscounts now yield 5.01%, equivalent to 6.51% interest at the standard equivalency factor of 1.3x. Long Corporates now yield a little under 4.15%, so the pre-tax interest-equivalent spread (in this context, the “Seniority Spread”) is now about 235bp, unchanged from the November 19 report.
| HIMIPref™ Preferred Indices These values reflect the December 2008 revision of the HIMIPref™ Indices Values are provisional and are finalized monthly |
|||||||
| Index | Mean Current Yield (at bid) |
Median YTW |
Median Average Trading Value |
Median Mod Dur (YTW) |
Issues | Day’s Perf. | Index Value |
| Ratchet | 0.00 % | 0.00 % | 0 | 0.00 | 0 | -0.6070 % | 2,527.1 |
| FixedFloater | 0.00 % | 0.00 % | 0 | 0.00 | 0 | -0.6070 % | 4,000.9 |
| Floater | 2.98 % | 3.08 % | 64,796 | 19.47 | 4 | -0.6070 % | 2,686.5 |
| OpRet | 4.04 % | -3.83 % | 99,130 | 0.08 | 1 | -0.2361 % | 2,760.1 |
| SplitShare | 4.27 % | 3.98 % | 51,943 | 3.76 | 5 | -0.1858 % | 3,195.6 |
| Interest-Bearing | 0.00 % | 0.00 % | 0 | 0.00 | 0 | -0.2361 % | 2,523.8 |
| Perpetual-Premium | 5.43 % | -10.12 % | 69,854 | 0.09 | 19 | 0.0965 % | 2,487.4 |
| Perpetual-Discount | 5.12 % | 5.01 % | 109,700 | 15.39 | 16 | -0.2000 % | 2,676.4 |
| FixedReset | 4.15 % | 3.55 % | 190,660 | 4.90 | 73 | -0.0900 % | 2,591.7 |
| Deemed-Retractible | 4.95 % | -0.58 % | 99,808 | 0.10 | 40 | 0.1334 % | 2,615.6 |
| FloatingReset | 2.55 % | -5.17 % | 59,792 | 0.08 | 6 | -0.1432 % | 2,554.5 |
| Performance Highlights | |||
| Issue | Index | Change | Notes |
| BAM.PR.B | Floater | -3.30 % | YTW SCENARIO Maturity Type : Limit Maturity Maturity Date : 2044-11-26 Maturity Price : 16.68 Evaluated at bid price : 16.68 Bid-YTW : 3.18 % |
| PWF.PR.S | Perpetual-Discount | -1.63 % | YTW SCENARIO Maturity Type : Limit Maturity Maturity Date : 2044-11-26 Maturity Price : 23.78 Evaluated at bid price : 24.16 Bid-YTW : 5.00 % |
| MFC.PR.K | FixedReset | -1.29 % | YTW SCENARIO Maturity Type : Call Maturity Date : 2018-09-19 Maturity Price : 25.00 Evaluated at bid price : 25.17 Bid-YTW : 3.56 % |
| ENB.PR.H | FixedReset | -1.09 % | YTW SCENARIO Maturity Type : Limit Maturity Maturity Date : 2044-11-26 Maturity Price : 22.11 Evaluated at bid price : 22.60 Bid-YTW : 4.06 % |
| TRP.PR.C | FixedReset | -1.04 % | YTW SCENARIO Maturity Type : Limit Maturity Maturity Date : 2044-11-26 Maturity Price : 21.51 Evaluated at bid price : 21.87 Bid-YTW : 3.55 % |
| ENB.PR.Y | FixedReset | -1.01 % | YTW SCENARIO Maturity Type : Limit Maturity Maturity Date : 2044-11-26 Maturity Price : 22.55 Evaluated at bid price : 23.48 Bid-YTW : 4.10 % |
| PWF.PR.A | Floater | 1.04 % | YTW SCENARIO Maturity Type : Limit Maturity Maturity Date : 2044-11-26 Maturity Price : 19.40 Evaluated at bid price : 19.40 Bid-YTW : 2.72 % |
| Volume Highlights | |||
| Issue | Index | Shares Traded |
Notes |
| TRP.PR.A | FixedReset | 249,639 | Scotia crossed blocks of 100,000 and 45,500, both at 22.01. RBC crossed 55,900 at the same price. YTW SCENARIO Maturity Type : Limit Maturity Maturity Date : 2044-11-26 Maturity Price : 21.65 Evaluated at bid price : 22.02 Bid-YTW : 3.90 % |
| MFC.PR.K | FixedReset | 168,406 | Scotia crossed blocks of 52,600 and 30,500 at 25.20; RBC crossed 75,000 at the same price. MFC.PR.K resets at +222bp in 2018, so this is probably some portfolio rejigging related to the new issue. YTW SCENARIO Maturity Type : Call Maturity Date : 2018-09-19 Maturity Price : 25.00 Evaluated at bid price : 25.17 Bid-YTW : 3.56 % |
| BAM.PF.A | FixedReset | 109,722 | Desjardins crossed 50,000 at 25.98. Nesbitt crossed two blocks of 25,000 each at the same price. YTW SCENARIO Maturity Type : Call Maturity Date : 2018-09-30 Maturity Price : 25.00 Evaluated at bid price : 25.95 Bid-YTW : 3.65 % |
| ENB.PR.B | FixedReset | 53,709 | Scotia crossed 41,400 at 24.73. YTW SCENARIO Maturity Type : Limit Maturity Maturity Date : 2044-11-26 Maturity Price : 23.35 Evaluated at bid price : 24.69 Bid-YTW : 3.87 % |
| FTS.PR.M | FixedReset | 38,887 | YTW SCENARIO Maturity Type : Call Maturity Date : 2019-12-01 Maturity Price : 25.00 Evaluated at bid price : 25.50 Bid-YTW : 3.67 % |
| BNS.PR.M | Deemed-Retractible | 38,354 | TD crossed 30,000 at 25.78. YTW SCENARIO Maturity Type : Call Maturity Date : 2014-12-26 Maturity Price : 25.50 Evaluated at bid price : 25.79 Bid-YTW : -5.48 % |
| There were 37 other index-included issues trading in excess of 10,000 shares. | |||
| Wide Spread Highlights | ||
| Issue | Index | Quote Data and Yield Notes |
| BAM.PR.B | Floater | Quote: 16.68 – 17.20 Spot Rate : 0.5200 Average : 0.2814 YTW SCENARIO |
| PWF.PR.S | Perpetual-Discount | Quote: 24.16 – 24.62 Spot Rate : 0.4600 Average : 0.2929 YTW SCENARIO |
| PVS.PR.C | SplitShare | Quote: 25.60 – 25.90 Spot Rate : 0.3000 Average : 0.1893 YTW SCENARIO |
| FTS.PR.J | Perpetual-Discount | Quote: 24.30 – 24.55 Spot Rate : 0.2500 Average : 0.1750 YTW SCENARIO |
| GWO.PR.S | Deemed-Retractible | Quote: 25.92 – 26.18 Spot Rate : 0.2600 Average : 0.1920 YTW SCENARIO |
| BNS.PR.Q | FixedReset | Quote: 25.66 – 25.88 Spot Rate : 0.2200 Average : 0.1562 YTW SCENARIO |