Assiduous Reader Prefhound can always be relied upon for detailed analysis and he has not disappointed in his comment on the February 2 Market Report:
For the Jan 23 FTS series, the lowest reset spread was said to be “cheap”, but its return would only be higher than a higher reset spread if long run GOC-5 rose to an equilibrium around 3%. Current price and reset spreads made sense if the long run equilibrium GOC-5 yield were in the 1-1.5% range (vs 0.85% at the time). Only if the long run equilibrium GOC-5 Yield were 0-0.50% would the original rich/cheap analysis produce substantially different long run returns. This suggested to me that rich/cheap was fairly sensitive to long run GOC-5, so arbitrage returns would depend on changes in (and perception of) that benchmark. As you often note, perception can differ enormously from reality, so fixed reset arbitrage appears to have a substantial element of added GOC-5 risk.
It will be recalled that in my original essay on Implied Volatility for FixedResets I made the point that both the “Pure” price (that is, the price of a non-callable annuity) with any given spread would approach par as GOC-5 increased, while the option value would approach zero; thus, we may conclude that an increase in GOC-5 will cause all issues to move closer to their par value (and contrariwise!) regardless of whether they are at a premium or a discount.
As Prefhound has focussed on the January 23 analysis of the FTS FixedResets, I will show their data for that day to make it easier for Assiduous Readers to replicate and extend the analysis. My findings are at variance with Prefhound‘s conclusions, but I’m sure a bit more methodological detail will sort out a difference in assumptions:
| FTS FixedResets: Characteristics | ||||
| Ticker | Current Dividend |
Issue Reset Spread |
Next Exchange Date |
Bid Price 2015-1-23 |
| FTS.PR.G | 0.9708 | +213 | 2018-9-1 | 24.70 |
| FTS.PR.H | 1.0625 | +145 | 2015-6-1 | 18.28 |
| FTS.PR.K | 1.00 | +205 | 2019-3-1 | 25.15 |
| FTS.PR.M | 1.025 | +248 | 2019-12-1 | 25.58 |
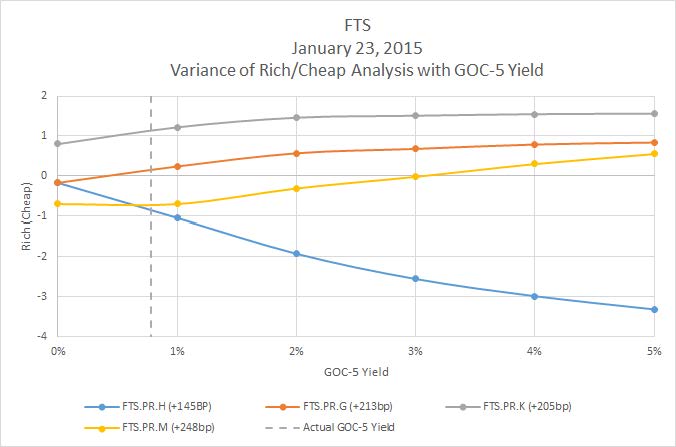
So first we will perform a series of computations using the January 23 bids, but varying GOC-5; we come up with the following table:
| Rich / (Cheap) | ||||||
| GOC5 | ImpVol | Spread | FTS.PR.H | FTS.PR.G | FTS.PR.K | FTS.PR.M |
| 5% | 1% | 247 | -3.31 | 0.84 | 1.56 | 0.55 |
| 4% | 1% | 241 | -2.98 | 0.79 | 1.55 | 0.3 |
| 3% | 3% | 234 | -2.55 | 0.68 | 1.51 | -0.02 |
| 2% | 4% | 227 | -1.92 | 0.57 | 1.46 | -0.31 |
| 1% | 5% | 217 | -1.04 | 0.24 | 1.22 | -0.7 |
| 0% | 11% | 196 | -0.17 | -0.17 | 0.8 | -0.7 |
… which may be graphed as:
Click for Big
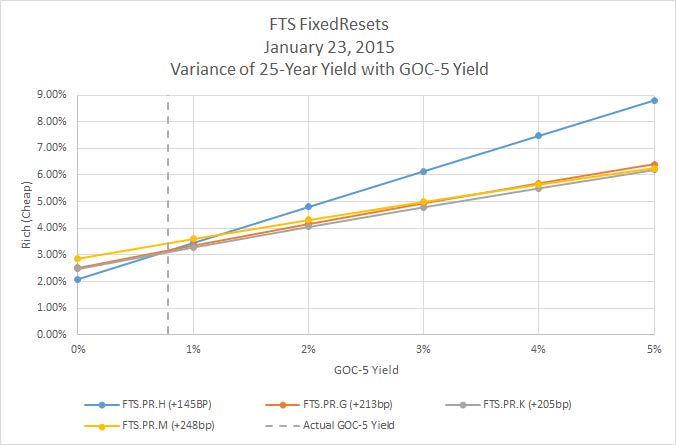
Further, we can use the Yield Calculator for Resets, which was given a thorough explanation in early December to determine the 25-year yield expected for each of the GOC-5 levels – note that no prior call is assumed in any of these calculations and that the end-price is set equal to current price. We derive the following table (nb: incorrect figures from the original post have been struck out and replaced with corrected figures 2015-2-4).
| GOC5 | FTS.PR.H | FTS.PR.G | FTS.PR.K | FTS.PR.M |
| 5% | 8.80% | 6.41% | 6.19% | |
| 4% | 7.47% | 5.69% | 5.50% | |
| 3% | 6.14% | 4.94% | 4.79% | |
| 2% | 4.80% | 4.16% | 4.05% | |
| 1% | 3.45% | 3.35% | 3.28% | |
| 0% | 2.09% | 2.51% | 2.47% |
… and plotted as:
Click for Big
Corrected 2015-2-4
What makes this chart particularly fascinating is that the minimal difference between the four calculated yields is found at a value for GOC-5 that is very close to the actual GOC-5 rate of 0.78% at the close of that day:
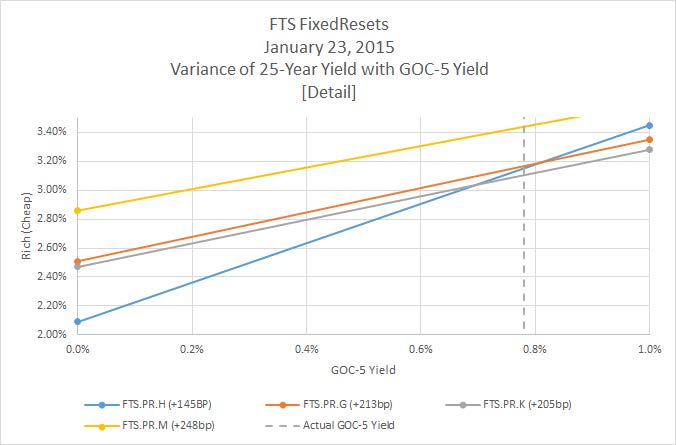
Click for Big
Corrected 2015-2-4
This bears investigating … one might almost wonder if there isn’t some market making going on that has the effect of grouping these yields together …
Update, 2015-02-04: Prefhound wants to see the prices for the Implied Volatility fitting adjusted to reflect the period until the next Exchange Date. OK, here goes!
| FTS.PR.H | FTS.PR.G | FTS.PR.K | FTS.PR.M | ||
| Spread | 145 | 213 | 205 | 248 | |
| Exchange Date |
2015-6-1 | 2018-9-1 | 2019-3-1 | 2019-12-1 | |
| Dividends Until Exchange Date |
2 | 15 | 17 | 20 | |
| Current Dividend |
1.0625 | 0.9708 | 1.00 | 1.025 | |
| Future Dividends | |||||
| GOC5 | 5% | 1.6125 | 1.7825 | 1.7625 | 1.87 |
| 4% | 1.3625 | 1.5325 | 1.5125 | 1.62 | |
| 3% | 1.1125 | 1.2825 | 1.2625 | 1.37 | |
| 2% | 0.8625 | 1.0325 | 1.0125 | 1.12 | |
| 1% | 0.6125 | 0.7825 | 0.7625 | 0.87 | |
| 0% | 0.3625 | 0.5325 | 0.5125 | 0.62 | |
| Price Adjustment | |||||
| GOC5 | 5% | -0.35 | -1.64 | -2.07 | -2.03 |
| 4% | 0.15 | 2.11 | 2.18 | 2.98 | |
| 3% | 0.03 | 1.17 | 1.12 | 1.73 | |
| 2% | -0.10 | 0.23 | 0.05 | 0.48% | |
| 1% | -0.23 | -0.71 | -1.01 | -0.78 | |
| 0% | -0.35 | -1.64 | -2.07 | -2.03 | |
| Effective Price | |||||
| GOC5 | 5% | 18.56 | 27.74 | 28.39 | 29.81 |
| 4% | 18.43 | 26.81 | 27.33 | 28.56 | |
| 3% | 18.31 | 25.87 | 26.27 | 27.31 | |
| 2% | 18.18 | 24.93 | 25.20 | 26.06 | |
| 1% | 18.06 | 23.99 | 24.14 | 24.81 | |
| 0% | 17.93 | 23.06 | 23.08 | 23.56 | |
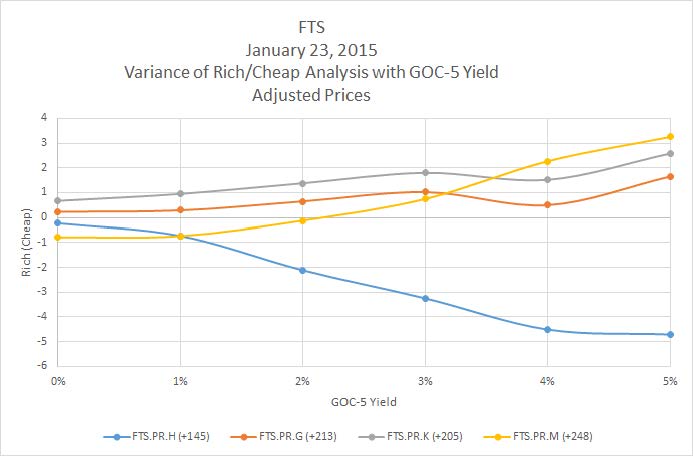
And now we will perform a series of computations using the January 23 bids as adjusted in the above table, using the appropriate GOC-5:
| Rich / (Cheap) | ||||||
| GOC5 | ImpVol | Spread | FTS.PR.H | FTS.PR.G | FTS.PR.K | FTS.PR.M |
| 5% | 1% | 193 | -4.71 | 1.65 | 2.58 | 3.25 |
| 4% | 1% | 194 | -4.51 | 0.50 | 1.52 | 2.27 |
| 3% | 1% | 216 | -3.25 | 1.02 | 1.80 | 0.75 |
| 2% | 3% | 225 | -2.11 | 0.65 | 1.38 | -0.12 |
| 1% | 7% | 226 | -0.73 | 0.29 | 0.95 | -0.74 |
| 0% | 26% | 184 | -0.23 | 0.23 | 0.67 | -0.79 |
This allows the following chart to be drawn:
Click for Big
The price adjustments, of course, are very large, but it doesn’t make any difference to the fitting, which uses only prices. The Expected Future Current Yields are calculated only for display purposes. At any rate, while there are significant differences, the qualitative conclusions are the same – this chart looks pretty much the same as the one with unadjusted prices, although there’s a curious jog in the ‘Adjusted Price’ one.
The Black and Scholes model is valid only if one assume that future price variation will be in the shape of a bell-curve. Future price of preferred shares will vary mainly with future interest rate. Interest rate in the last five years were not in the shape of a bell-curve. Why should it be different in the future?
Thanks for your very usefull blog
OK, I’m really on the spot now! Let me check a few things first:
1. The Jan 23 Rich / Cheap table: does it include the difference in dividends prior to reset? That is, if reset is far away, some of todays price reflects higher dividends in the interim compared with something that has already reset. In the case of FTS.PR.K I estimate this is about $1.40, so has the Richness calculation backed this out? (Table shows $1.22 Rich at 1% GOC-5)? So, if it is 1.22 Rich AND is paying out $1.40 more dividends in the time until reset, then its price should fall $2.62 by equilibrium?
2. Very briefly, I made a cash flow projection based on a GOC assumption with a single long run fixed reset return that makes PV = 0 for each issue. This approach does include a call at the end if Price = Dividend / Return > $25 in 30 years. The output then is a long run return from investing in each issue. I compared those returns rather than Rich/Cheap with a built-in implied volatility (another factor with some impact on valuation). I am happy to send the analysis on if you like. Anyway, these are the long run returns thus obtained for GOC-5 = 0.85%
FTS.PR.H 3.23% (Jan 23 Price Used = 18.22)
FTS.PR.K 3.03% (25.27)
FTS.PR.M 3.47% (25.59)
FTS.PR.G 3.27% (24.73)
This differs from what you call “Expected Future Current Yield”, but it does kind of indicate that PR.H and K are not hugely out of line with each other. In this scenario, PR.M and PR.G are called in 30 years. If called sooner, PR.M’s return would be somewhat lower, PR.G somewhat higher.
If equilibrium GOC-5 is allowed to vary, the relative ordering of these long run returns also varies — and that was behind my digression in the first note.
3. My real question was not a discussion about different analytical approaches, but whether the Rich/Cheap analysis you discuss was reflected in relative values in the subsequent 10 days when things normalized. If it is reflected in subsequent changes it validates your model. If not, things are more complicated due to some of the other factors involved. I’m curious about how well we understand Fixed Resets.
Castor, welcome to the blog!
The Black-Scholes model is used in the calculation not on raw interest rates, but on the spread over GOC-5. This has a much better chance of being normally distributed.
That being said, I will be more than happy to use a different model for option pricing, if you can tell me what it is, how to implement it and why it is better than what I have now.
Prefhound
1. The calculations were originally performed with unadjusted prices. I have prepared calculations in the update to the post for adjusted prices and don’t think there’s much qualitative difference.
2. OK, so this is basically the same thing as I calculated in the post using the “Yield Calculator for Resets”, except for the call provision. I didn’t calculate for GOC5 = 0.85%, but I did calculate for GOC5=1% with the results:
FTS.PR.H 3.45% (Jan 23 Price Used = 18.28) **Diff: 0.22%**
FTS.PR.K 3.28% (25.15) **Diff: 0.25% **
FTS.PR.M 3.60% (25.58) **Diff: 0.13% **
FTS.PR.G 3.35% (24.70) ** Diff: 0.08% **
Differences between your calculation and mine are noted.
Note that I made an error in my original calculation for FTS.PR.M. I have corrected the post and report the corrected figure here. Differences between our calculations are reasonably reasonable, considering we are using GOC-5 yields that are 0.15% different.
3. Well, I’m not sure about the “10 days” part. Differences can persist for quite a while and actually this is one of my pet hobby horses.
If I understand you correctly, you basically want to take the indications of rich/cheap and regress them against actual changes over an X day period. This is often done in what I deprecate as pseudo-quantitative analytics, because from a portfolio management perspective it doesn’t make sense.
I’m under no obligation to hold my position if a cheap security becomes rich a few days before the arbitrary cut-off; nor am I forced to sell on Day X if it’s still cheap. As long as the cheap securities become not-cheap at some reasonable time in the future, I’m (probably) going to make money. The bracketed ‘probably’ is because my rich/cheap analysis might change between Day 0 and Day ‘Eventual’, due to other factors (e.g., changes in GOC-5, changes in Implied Volatility, etc.)
You cannot use regression on fixed-period returns to validate a rich/cheap analysis!
Prefhound
Also it should be noted that there is an element of chance to the required yields as well. FTS.PR.M, with a higher Issue Reset Spread (+248), should yield more than the lower-spread FTS.PR.H (+145), because the difference pays for the higher call risk with the higher-spread issue.
In fact, with the calculation as presented on January 23, with a spread of 213bp and an Implied Volatility of 6%, I calculate that the “Expected Future Current Yield” of FTS.PR.H should be 2.91%, compared to 3.10% for FTS.PR.M. That’s quite a difference … and quite rightly, because FTS.PR.M is in grave danger of being called.
If, for instance, Fortis wakes up one morning and realizes that market prices are such that it can issue new paper at +150, the return on FTS.PR.H will have greatly exceeded those on FTS.PR.M.
OK, I appreciate you taking my question seriously although I confess to being a bit confused digging back through this post looking for changes.
1. No, I wasn’t looking for a regression. I was just looking for a simple “we had rich-cheap = x$ on day A and this went to y$ on day B an the corresponding relative price change observed (z$) was (or was not) about the same”. Might be easier to have a look myself.
2. It’s kind of interesting that rich/cheap did not vary much correcting for dividends prior to reset ($1.22 to 0.95 for pr.K). Perhaps that is because the whole set (excluding Pr.H) got an adjustment, so the effect was diluted by 2/3
3. I accept the argument that the call is worth something negative. In your approach you adjust for the option spread up front, whereas in the cash flow approach I was using, I still have the option to adjust for it at the end.
Given that this post is now a few days old and getting a little mouldy, I suggest we pause here. Keep up the fine work and thanks again for the answers.