Archive for October, 2008

BoE Releases October 2008 Financial Stability Report

Tuesday, October 28th, 2008

The October 2008 edition of the BoE’s Financial Stability Report has been released.

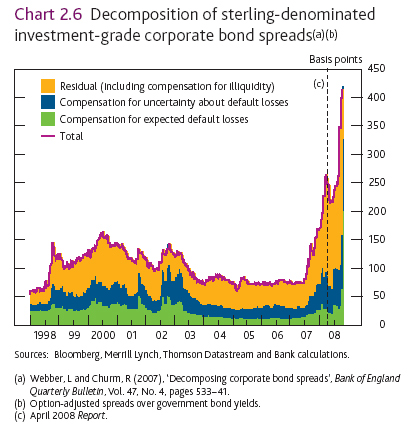
There’s an interesting graph of Sterling credit spreads:

Despite the slowing economy, corporate insolvency rates remain near historical lows. Many companies extended debt maturities during the recent boom, with Dealogic data suggesting that only about 10% of the stock of sterling-denominated bonds and loans outstanding are due to mature in 2009. But within that aggregate picture, there are pockets of vulnerability. Company accounts suggest that the proportion of debt held by businesses whose profits were not large enough to cover their debt interest payments picked up sharply in 2007 to around a quarter of the outstanding stock of debt

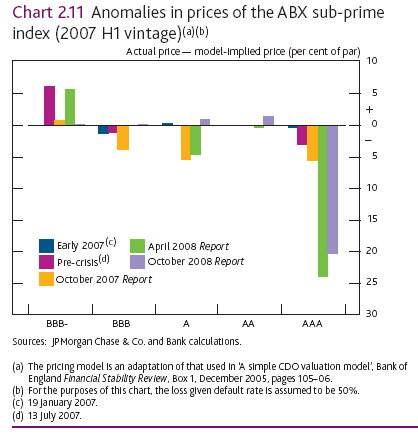
Also of interest is the continuing disconnect between fundamental value and market price of AAA subprime paper:

They update their estimation of ultimate credit losses (as opposed to mark-to-market losses) initiated in the April Financial Stability Report and conclude:

As Chart C shows, it is difficult to reconcile the outlook for expected credit losses on UK prime RMBS (Chart B), and hence the likely economic value of those securities, with current implied market values (Chart A). Based on this comparison, it is estimated that a little under half of the loss of market value of UK prime RMBS is likely to reflect discounts for uncertainty about future collateral performance and market illiquidity.(12) And around one third of mark-to-market losses on US sub-prime RMBS can be attributed to the premia demanded by investors for uncertainty and market illiquidity.

They emphasize that uncertainty and excess leverage are working together to greatly increase the calculated probability of default:

The uncertainty about the underlying values of banks’ assets was amplified by the high leverage with which UK and global financial institutions entered the downturn. To give an illustrative example,(1) in the middle of 2008 major UK banks had assets of just over £6 trillion and equity capital of around £200 billion. So if the standard deviation of asset returns pre-crisis was, say 1.5% per year, then levels of UK banks’ capital would have delivered a probability of default of a little over 1% a year (Chart 4.4). But if uncertainty doubled to 3% in the crisis — for example, as a result of higher macroeconomic and counterparty risk — then the implied default probability would rise to a little under 15%. In essence, that was what happened to UK and global banks during the summer, as the combination of asset valuation uncertainty and leverage markedly increased default fears and thus raised questions about the adequacy of banks’ capitalisation. That was the case despite capital ratios being above regulatory minima throughout the period (Chart 4.5).

… which in turn places a greater importance on the mark-to-market value of assets …

When the probability of default is low, the value of assets on banks’ balance sheets is determined by their economic value — the value built up from underlying expected cash flows on those assets on the assumption that they are held to maturity. But as default probabilities rise, so do the chances of the assets needing to be liquidated prior to maturity at market prices. So as the expected probability of bank default rose during September (Chart 3.1 in Section 3), it became rational for market participants to alter the way by which they assessed
the underlying value of banks’ assets, effectively placing more weight on the mark-to-market value of these assets. Given the high illiquidity and uncertainty premia in market prices (discussed in Section 2), this implied lower asset values and higher potential capital needs for banks. This valuation effect served as an additional amplifier of institutional distress.

It appears that the BoE will be pushing for better bank capitalization:

By historical standards, banks have operated with relatively low levels of capital in recent years. For example, long-run evidence shows that capital ratios for US banks have fallen significantly from levels of around 50% in the mid-19th century (Chart 6.1). The structure of banking systems, and the safety nets in place to support them, have changed dramatically over the period. While it is difficult to determine the optimum level of capital, recent events suggest that capital levels across the financial system as a whole have fallen too far.

Existing regulatory tools need to be adapted and new ones developed, to ensure that the financial system is better capitalised in advance of the next downturn and to address the build-up of risk through the cycle. A range of specific proposals have already been put forward. A leverage ratio — a minimum ratio of capital to total assets — would impose a constraint on the growth of banks’ balance sheets relative to their stock of capital. A system of dynamic provisioning would force banks to build up reserves against future losses in good times, providing a resource which could be drawn on in bad times. These and other proposals are outlined in detail in Box 6.

All in all, a very good review of the situation.

October 27, 2008

Monday, October 27th, 2008

The extraordinary Money Market disintermediation (discussed on the weekend) continues, with Morgan Stanley badly hit:

Morgan Stanley clients withdrew almost one- third of their cash from money-market accounts last month, forcing the firm to buy $23 billion of securities held by the funds to keep them afloat.

Redemptions were $46 billion in September, mostly from funds that invest in corporate debt, Morgan Stanley said in an Oct. 9 regulatory filing. The New York-based company made sure the money-market funds had enough cash to repay investors by acquiring some of their assets with financing from “various available stabilization facilities.”

Not surprisingly, US Commercial Paper rates are spiking:

Yields on commercial paper rose as the Federal Reserve began buying the debt directly from companies, showing the central bank’s efforts to unfreeze short- term credit markets have yet to take hold.

Rates on the highest-ranked 30-day commercial paper, which many corporations use to finance their day-to-day operations, jumped 25 basis points to 2.88 percent, according to yields offered by companies and compiled by Bloomberg.

The Fed today set the rate it’s willing to accept for 90-day unsecured commercial paper at 1.88 percent plus a 1 percentage point credit surcharge. The 90-day secured asset-backed rate was set at 3.88 percent, according to Fed data compiled by Bloomberg.

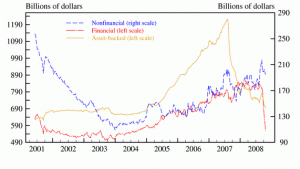
The Fed’s graph tells the tale:

There is a note from Bloomberg that overnight US Equity futures and the cash market opening are decoupling:

U.S. stock-index futures are becoming less reliable as predictors of market moves.

With equity investors around the world contending with the worst drop since the Great Depression, futures on the Standard & Poor’s 500 Index misstated gains or losses by an average 1.4 percentage point in October, twice the gap in the third quarter, data compiled by Bloomberg show. One of the biggest misses was Oct. 24, when futures fell as much as 60 points, while the index itself dropped 37 points in the first half hour of trading, before closing down 31.

… which may be related to derivatives losses at Deutsche Bank:

Deutsche Bank AG, Germany’s biggest bank, lost more than $400 million on equity derivatives trades as stock markets headed for their biggest rout since the 1930s, two people with direct knowledge of the matter said.

The loss, equal to almost half of the Frankfurt-based company’s second-quarter revenue from equity sales and trading, is a black eye for Richard Carson, global head of equity derivatives, and may signal more job losses at the bank.

Econbrowser‘s James Hamilton has posted supporting a Fed cut to 1.00%, on grounds that:

  • The three month bill rate is 1.00%
  • inflation is unlikely with oil below $70; unemployment is a greater concern, and
  • risks to the dollar are minimal considering the global nature of the crisis

Viral Acharya and Raghu Sundaram have posted an analysis of the UK & US bank loan guarantees on VoxEU:

In the UK, an institution seeking a guarantee on an issue will be charged an annual fee of 50 basis points plus that institution’s median 5-year credit-default swap (CDS) spread observed in the 12 months before 7 October 2008.

In the US, each participating institution will pay a flat 75 basis points per annum on the entire amount of its new senior unsecured liabilities (subject to the 125% cap mentioned above). If the institution has informed the FDIC of its intent to also issue non-guaranteed long-term debt, then the 75 basis points fee applies to the guaranteed portion of its new debt issues. But in the latter case, the institution must also pay a one-time fee of 37.5 basis points of that portion of its senior unsecured liabilities as of 30 September 2008, that will mature on or before 30 June 2009.

Even a casual glance at these numbers suggests that the British Treasury’s fees are a great deal higher than the proposed American flat fee structure (0.75% versus anything between 109 basis points for HSBC to over 178 basis points for Nationwide).

If the entire available guarantee amount of GBP 250 billion is taken up, the resulting subsidy to be borne by UK taxpayers is of the order of about GBP 0.675 billion per year, or about GBP 2 billion over the three years of the scheme.

Assuming a total guarantee figure of $1.5 trillion (an estimate that is likely on the lower side), this means an annual [US] government subsidy to the participating banks of $18 billion, or well over $50 billion over the three years of the scheme.

By way of comparison, the Canadian Lenders’ Assurance Fund:

Insurance provided through the facility will be priced on a commercial basis. The base annualized fee will be 135 basis points [note 2]. There will be a surcharge of 25 basis points for eligible institutions rated at or above A- or equivalent. There will be a further surcharge of 25 basis points for other eligible financial institutions. There will also be a further surcharge for insurance on non-Canadian dollar denominated debt.

Note 2: This is the average over the twelve months ending August 2008 of the spread between the yield on Canadian dollar five-year senior unsecured bonds issued by the five largest Canadian banks and the comparable Government of Canada bond

Spend-every-penny Flaherty announced today that Desjardins will be eligible for the facility.

I reported in early September that the five-year TIPS note was in danger … any more auctions like today’s will eliminate the uncertainty!

The average yield was 3.27 percent which means that the new bond yields more than the nominal 5 year note. The so called breakeven spread is the spread at which inflation would need to average for the holder of the TIPS to breakeven with the nominal bond and it generally predicts a positive rate of inflation.

In this case, the TIPS is yielding above the nominal bond by about 70 basis points in which case the market is saying that it thinks that inflation will average negative 0.7 percent per year for the next 4 ½ years.

Another post on VoxEU, by Romain Ranciere, Aaron Tornell and Frank Westermann, takes the somewhat heretical view that the credit crunch is not a big deal:

How big is the current US bailout? The $700 billion bailout bill is equivalent to 5% of GDP. Adding to it the cost of other rescues – Bear Stearns, Freddie Mac and Fannie Mae, AIG – the total bailout costs could go up to $1,400 billion, which is around 10% of GDP. In contrast,

  • Mexico incurred bailout costs of 18% of GDP following the 1994 Tequila crisis.
  • In the aftermath of the 1997-98 Asian crisis, the bailout price tag was 18% of GDP in Thailand and a whopping 27% in South Korea.
  • Somewhat lower costs, although of the same order of magnitude, were incurred by Scandinavian countries in the banking crises of the late 1980s. 11% in Finland (1991), 8% in Norway (1987), and 4% in Sweden (1990).
  • Lastly, the 1980s savings and loans debacle in the US had a cumulative fiscal cost for the taxpayer of 2.6% of GDP.

The bailout costs that the taxpayers are facing today can be seen as an ex post payback for years of easy access to finance in the US economy. The implicit bailout guarantees against systemic crises have supported a high growth path for the economy – albeit a risky one. In effect, the guarantees act as an investment subsidy that leads investors to (1) lend more and (2) at cheaper interest rates. This results in greater investment and growth in financially constrained sectors – such as housing, small businesses, internet infrastructure, and so on. Investors are willing to do so because they know that if a systemic crisis were to take place, the government will make sure they get repaid (at least partially).


Perhaps the financial sector lent excessively, leading to overinvestment in the housing sector today and the IT sector in the late 1990s. But the bottom line remains that risk-taking has positive consequences in the long run even if it implies that crises will happen from time to time. Over history, the countries that have experienced (rare) crises are the ones that have grown the fastest.1 In those countries, investors and businesses take on more risks and as a result have greater investment and growth. Compare Thailand’s high-but-jumpy growth path with India’s slow-but-steady growth path before it implemented liberalisation a few years ago. Over the last 25 years, Thailand grew 32% more than India in terms of per-capita income despite a major financial crisis. Similarly, easier access to finance and risk-taking explains, in part, why the US economy has strongly outperformed those of France and Germany in the last decades.

Hear, hear! It is a natural human preference that things we cannot control be predictable … but to suffocate the financial system with scads of new rules and restrictions would be the equivalent of the school board banning running in the playground because occasionally a kid falls and skins his knee.

The loonie got killed today:

The Canadian dollar depreciated by as much as 1.5 percent to C$1.2972 per U.S. dollar, from C$1.2775 on Oct. 24, the lowest since Sept. 21, 2004. It traded at C$1.2914 at 2:24 p.m. in Toronto. One Canadian dollar buys 77.44 U.S. cents.

as did Canadian equities

The Standard & Poor’s/TSX Composite Index slid 8.1 percent to 8,537.34 in Toronto, the most since a 11 percent plunge on “Black Monday” of Oct. 19, 1987. The S&P/TSX, which derives three-quarters of its value from resource and finance shares, has fallen 27 percent in October, poised for its biggest monthly decline since January 1919.

Prefs did not escape unscathed, with PerpetualDiscounts closing at a yield of 7.00%, a level last seen in April 1995. This is equivalent to interest of 9.80% at the standard 1.4x equivalency factor, while long corporates now yield about 7.25% for a pre-tax interest-equivalent spread of 255bp.

Note that these indices are experimental; the absolute and relative daily values are expected to change in the final version. In this version, index values are based at 1,000.0 on 2006-6-30.
The Fixed-Reset index was added effective 2008-9-5 at that day’s closing value of 1,119.4 for the Fixed-Floater index.
Index Mean Current Yield (at bid) Mean YTW Mean Average Trading Value Mean Mod Dur (YTW) Issues Day’s Perf. Index Value
Ratchet N/A N/A N/A N/A 0 N/A N/A
Fixed-Floater 5.50% 5.76% 67,748 14.67 6 +0.2466% 941.1
Floater 6.96% 7.06% 46,577 12.44 2 -5.6391% 495.0
Op. Retract 5.36% 6.29% 131,496 4.04 14 -0.8102% 987.0
Split-Share 6.41% 11.25% 57,664 3.96 12 -1.0120% 914.6
Interest Bearing 8.50% 15.65% 60,182 3.16 3 -3.4857% 830.4
Perpetual-Premium 6.83% 6.91% 48,313 12.60 1 -0.5217% 908.8
Perpetual-Discount 6.93% 7.00% 173,519 12.59 70 -2.1472% 783.0
Fixed-Reset 5.37% 5.09% 833,816 15.17 10 -0.7326% 1,070.9
Major Price Changes
Issue Index Change Notes
IAG.PR.A PerpetualDiscount -14.9697% Now with a pre-tax bid-YTW of 8.34% based on a bid of 14.03 and a limitMaturity. Closing quote 14.03-16.12, 10×13. Day’s range 16.12-50.
BAM.PR.B Floater -11.3158%  
BSD.PR.A InterestBearing -8.4079% Asset coverage of 0.9+:1 as of October 24 according to Brookfield Funds. Plunge is probably related to the suspension of retractions … but mind you, the preferreds now have full exposure to declines in the underlying portfolio – so maybe it’s just that. On Review-Negative by DBRS. Now with a pre-tax bid-YTW of 20.26% based on a bid of 5.12 and a hardMaturity 2015-3-31 at 10.00. Closing quote 5.12-33, 33×5. Day’s range 5.11-81.
RY.PR.H PerpetualDiscount -8.3410% Now with a pre-tax bid-YTW of 7.08% based on a bid of 20.00 and a limitMaturity. Closing Quote 20.00-22.13 (!). Day’s range of 21.00-81.
POW.PR.B PerpetualDiscount -7.2456% Now with a pre-tax bid-YTW of 7.50% based on a bid of 18.05 and a limitMaturity. Closing Quote 18.05-85, 4X1. Day’s range of 18.45-27.
POW.PR.D PerpetualDiscount -6.4871% Now with a pre-tax bid-YTW of 7.44% based on a bid of 17.01 and a limitMaturity. Closing Quote 17.01-05, 1X4. Day’s range of 17.05-18.20.
CM.PR.D PerpetualDiscount -5.3508% Now with a pre-tax bid-YTW of 7.74% based on a bid of 18.75 and a limitMaturity. Closing Quote 18.75-18, 26X5. Day’s range of 18.75-19.81.
FIG.PR.A InterestBearing -5.3455% Asset coverage of just under 1.4:1 as of October 15, according to Faircourt. Now with a pre-tax bid-YTW of 13.06% based on a bid of 7.26 and a hardMaturity 2014-12-31 at 10.00. Closing quote 7.26-38, 7X5. Day’s range of 7.25-66.
FTN.PR.A SplitShare -4.9875% Asset coverage of 2.2+:1 as of September 30 according to the company. Now with a pre-tax bid-YTW of 10.21% based on a bid of 7.62 and a hardMaturity 2015-12-1 at 10.00. Closing quote of 7.62-80, 32X11. Day’s range 7.80-01.
BMO.PR.J PerpetualDiscount -4.7187% Now with a pre-tax bid-YTW of 7.31% based on a bid of 15.75 and a limitMaturity. Closing Quote 15.75-24, 7X3. Day’s range of 16.00-69.
TD.PR.O PerpetualDiscount -4.7040% Now with a pre-tax bid-YTW of 6.77% based on a bid of 18.03 and a limitMaturity. Closing Quote 18.03-38, 2X4. Day’s range of 18.00-90.
PWF.PR.F PerpetualDiscount -4.6384% Now with a pre-tax bid-YTW of 6.92% based on a bid of 19.12 and a limitMaturity. Closing Quote 19.12-89, 5X4. Day’s range of 19.05-20.10.
PWF.PR.E PerpetualDiscount -4.5000% Now with a pre-tax bid-YTW of 6.59% based on a bid of 21.01 and a limitMaturity. Closing Quote 21.01-29, 2X10. Day’s range of 21.25-00.
BAM.PR.M PerpetualDiscount -4.4328% Now with a pre-tax bid-YTW of 9.52% based on a bid of 12.72 and a limitMaturity. Closing Quote 12.72-04, 1X1. Day’s range of 12.72-50.
SLF.PR.C PerpetualDiscount -4.3098% Now with a pre-tax bid-YTW of 7.37% based on a bid of 15.32 and a limitMaturity. Closing Quote 15.32-50, 4X10. Day’s range of 15.40-00.
GWO.PR.H PerpetualDiscount -4.2254% Now with a pre-tax bid-YTW of 7.24% based on a bid of 17.00 and a limitMaturity. Closing Quote 17.00-70, 5X5. Day’s range of 17.01-85.
RY.PR.B PerpetualDiscount -4.1622% Now with a pre-tax bid-YTW of 6.64% based on a bid of 17.73 and a limitMaturity. Closing Quote 17.73-90, 4X3. Day’s range of 17.50-26.
CM.PR.G PerpetualDiscount -4.1621% Now with a pre-tax bid-YTW of 7.79% based on a bid of 17.50 and a limitMaturity. Closing Quote 17.50-75, 2X5. Day’s range of 17.50-36.
MFC.PR.C PerpetualDiscount -4.1029% Now with a pre-tax bid-YTW of 7.31% based on a bid of 15.66 and a limitMaturity. Closing Quote 15.66-75, 3X4. Day’s range of 15.70-20.
BNA.PR.B SplitShare -4.0984% Asset coverage of just under 2.8:1 as of September 30 according to the company. Coverage now of 2.O-:1 based on BAM.A at 20.50 and 2.4 BAM.A held per preferred. Now with a pre-tax bid-YTW of 11.18% based on a bid of 17.55 and a hardMaturity 2016-3-25 at 25.00. Compare with BNA.PR.A (18.77% to 2010-9-30) and BNA.PR.C (13.24% to 2019-1-10). Closing quote 17.55-39. Day’s range 17.55-40.
RY.PR.A PerpetualDiscount -4.0090% Now with a pre-tax bid-YTW of 6.56% based on a bid of 17.00 and a limitMaturity. Closing Quote 17.00-22, 5X3. Day’s range of 17.00-93.
ELF.PR.G PerpetualDiscount +4.1667% Now with a pre-tax bid-YTW of 8.01% based on a bid of 15.00 and a limitMaturity. Closing Quote 15.00-94, 20X10. 700 shares traded in three transactions at 14.75.
NA.PR.N FixedReset +6.5217% Now trading through the BNS issues. So go figure.
Volume Highlights
Issue Index Volume Notes
MFC.PR.A OpRet 251,045 RBC sold 9 lots to (various?) anonymous(es) at 24.10, totalling 181,000 shares. Now with a pre-tax bid-YTW of 5.03% based on a bid of 23.76 and a softMaturity 2015-12-18 at 25.00.
TD.PR.M OpRet 75,800 CIBC crossed 60,000 at 24.65, then another 12,000 at the same price. Now with a pre-tax bid-YTW of 5.17% based on a bid of 24.51 and a softMaturity 2013-10-30 at 25.00.
TD.PR.P PerpetualDiscount 56,380 National bought 12,100 from Nesbitt at 21.00; anonymous bought 10,000 from TD at 21.50. Now with a pre-tax bid-YTW of 6.34% based on a bid of 20.84 and a limitMaturity.
CM.PR.A OpRet 53,900 TD crossed 10,000 at 25.15, then another 30,000 at the same price, then bought 11,500 from CIBC at the same price again. Now with a pre-tax bid-YTW of 5.32% based on a bid of 25.01 and a softMaturity 2011-7-30 at 25.00.
MFC.PR.B PerpetualDiscount 41,901 CIBC crossed 25,000 at 17.50. Now with a pre-tax bid-YTW of 6.93% based on a bid of 17.05 and a limitMaturity.

There were forty-three other index-included $25-pv-equivalent issues trading over 10,000 shares today.

HIMIPref™ Tracking of IQW.PR.C Halted

Monday, October 27th, 2008

It happened last month with IQW.PR.D and now IQW.PR.C has become impossible to handle in a standard manner.

Today’s closing bid for IQW.PR.C is $0.25, less than what the “accrued dividend” would be if it was still paying dividends, and the price rejected as an obvious error. I will no longer be tracking it.

I will continue to report the quarterly conversions of this issue into common.

New Issue: TD Fixed-Reset, 5.60%+274

Monday, October 27th, 2008

TD Bank has announced:

that it has entered into an agreement with a group of underwriters led by TD Securities Inc. for an issue of 8 million non-cumulative 5-Year Rate Reset Class A Preferred Shares, Series AC (the Series AC Shares), carrying a face value of $25.00 per share, to raise gross proceeds of $200 million. TDBFG intends to file in Canada a prospectus supplement to its January 11, 2007 base shelf prospectus in respect of this issue.

TDBFG has also granted the underwriters an option to purchase, on the same terms, up to an additional 2 million Series AC Shares. This option is exercisable in whole or in part by the underwriters at any time up to two business days prior to closing. The maximum gross proceeds raised under the offering will be $250 million should this option be exercised in full.

The Series AC Shares will yield 5.60% annually, payable quarterly, as and when declared by the Board of Directors of TDBFG, for the initial period ending January 31, 2014. Thereafter, the dividend rate will reset every five years at a level of 274 basis points over the then five-year Government of Canada bond yield.

Holders of the Series AC Shares will have the right to convert their shares into non-cumulative Floating Rate Class A Preferred Shares, Series AD (the Series AD Shares), subject to certain conditions, on January 31, 2014, and on January 31st every five years thereafter. Holders of the Series AD Shares will be entitled to receive quarterly floating dividends, as and when declared by the Board of Directors of TDBFG, equal to the three-month Government of Canada Treasury bill yield plus 274 basis points.

The issue is anticipated to qualify as Tier 1 capital for TDBFG and the expected closing date is November 5, 2008. TDBFG will make an application to list the Series AC Shares as of the closing date on the Toronto Stock Exchange.

The first dividend will be for $0.3337, payable January 31, based on anticipated closing November 5, 2008.

Well … if this doesn’t knock hell out of the Fixed-Reset market, I don’t know what will! I mentioned when reviewing the BoC Monetary Policy Report that we could see more at these levels …

Update, 2008-11-4 TD has announced:

that a group of underwriters led by TD Securities Inc. has exercised the option to purchase an additional 0.8 million non-cumulative 5-Year Reset Preferred Shares, Series AC (the Series AC Shares) carrying a face value of $25.00 per share. This brings the total issue announced on October 27, 2008, and expected to close November 5, 2008, to 8.8 million shares and gross proceeds raised under the offering to $220 million.

BoC Monetary Policy Report, 2008-10-23

Saturday, October 25th, 2008

The Bank of Canada released its October 2008 Monetary Policy Report on Thursday …

Core inflation is projected to remain below 2 per cent until the end of 2010. Assuming oil prices in a range of US$81 to US$88 per barrel, consistent with recent futures prices, total CPI inflation should peak in the third quarter of 2008, and is projected to fall below 1 per cent in mid-2009 before returning to the 2 per cent target by the end of 2010.

In line with the new outlook, some further monetary stimulus will likely be required to achieve the 2 per cent inflation target over the medium term.

Over the 1978–2004 period, which is long enough for cyclical and irregular effects to wash out, the growth in labour productivity for the total economy averaged 1.2 per cent per year. Recently, this trend appears to have fallen to slightly below 1.0 per cent, owing partly to the considerable amount of structural adjustment under way in the economy and perhaps partly to firms hiring additional labour, given concerns about tightening labour markets (Chart A). As these factors dissipate, aggregate productivity growth should pick up.

As a simple illustration, major Canadian banks have an average asset-to-capital multiple of 18. The comparable figure for U.S. investment banks is over 25, for European banks, in the 30s, and for some major global banks, over 40.

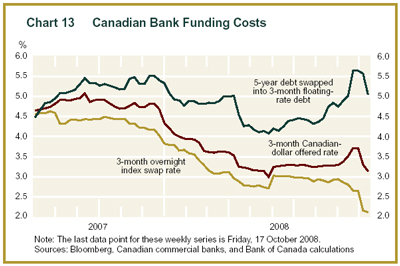
Credit spreads for financial institutions, as measured by the difference between a weighted average of borrowing rates across the term structure and the expected overnight rate, spiked to around 200 basis points in early October. While strong actions taken by governments and central banks to support financial institutions have led to some retracement in these spreads, it is expected that spreads will be reduced only slowly as confidence is gradually rebuilt. Since the onset of the financial market turbulence in August 2007, effective borrowing costs for Canadian financial institutions have eased somewhat, with the rise in credit spreads more than offset by the 225-basis-point cumulative reduction in the target overnight rate (Chart 13). These indicative borrowing costs likely do not, however, adequately take account of the decreased availability coming from illiquid and risk-averse interbank markets.

The huge spread on 5-year money may go a long way to explain why Royal Bank was willing to issue Fixed-Resets at 5.60%+267. Who knows … with a new fiscal year on the way, we may see more issues like that …

Econbrowser, the Fed's Balance Sheet and Interest on Reserves

Saturday, October 25th, 2008

Econbrowser‘s James Hamilton takes advantage of a lazy Saturday to post a lengthy and thoroughly worth-while post on The Federal Reserve’s Balance Sheet.

I won’t discuss it in detail here – it’s mostly explanatory and can speak for itself very well – but I will reproduce the table to encourage Assiduous Readers to review the extraordinary efforts the Fed is making to Save the World:

Balance sheet of the Federal Reserve.
Based on end-of-week values, in millions of dollars.
Data source: Federal Reserve Release H.4.1.
Reproduced from Econbrowser
Aug 8, 2007 Sep 3, 2008

Oct 1, 2008 Oct 22, 2008
Securities 790,820 479,726 491,121 490,617
Repos 18,750 109,000 83,000 80,000
Loans 255 198,376 587,969 698,050
&#160 &#160 Discount window &#160 &#160 255 &#160 &#160 19,089 &#160 &#160 49,566 &#160 &#160 107,561
&#160 &#160 TAF   &#160 &#160 150,000 &#160 &#160 149,000 &#160 &#160 263,092
&#160 &#160 PDCF     &#160 &#160 146,565 &#160 &#160 102,377
&#160 &#160 AMLF     &#160 &#160 152,108 &#160 &#160 107,895
&#160 &#160 Other credit     &#160 &#160 61,283 &#160 &#160 90,323
&#160 &#160 Maiden Lane   &#160 &#160 29,287 &#160 &#160 29,447 &#160 &#160 26,802
Other F.R. assets 41,957 100,524 320,499 519,713
Miscellaneous 51,210 51,681 50,539 50,662
Factors supplying reserve funds 902,993 939,307 1,533,128 1,839,042
 
Currency in circulation 814,626 836,836 841,003 856,821
Reverse repos 30,132 41,756 93,063 95,987
Treasury general 4,670 5,606 5,278 55,625
Treasury supplement     344,473 558,987
Other 46,770 51,278 77,816 50,860
Reserve balances 6,794 3,831 171,495 220,762
Factors absorbing reserve funds 902,993 939,307 1,533,128 1,839,042
 
Off balance sheet
Securities lent to dealers   120,790 259,672 226,357

This being PrefBlog, of course, I have to find something with which to take issue! There’s not enough debate in blogs! The ability just to write essays and ignore criticism is the great failing of many blogs – and I don’t include Econbrowser in this category by the way, I consider the authors to meet very high standards for intellectually honesty.

Anyway, part of the post reads:

I had a call from a reporter this week asking me to explain why the Fed raised the interest rate paid on reserves. I think she was expecting a 30-second sound bite, but instead we went back and forth for about 15 minutes and I’m not sure even then that I succeeded in getting the basic idea across. At that point she asked me, “Do you see it as an encouraging development that the Fed has taken this step to address the credit crunch?” My immediate answer was no. It’s not an encouraging development because it means that the heroic efforts that the Fed has taken previously weren’t enough. The Fed’s first $100 billion didn’t do it. The Fed’s first $1 trillion didn’t do it. Having the Treasury take over the $5 trillion in debts and guarantees of Fannie and Freddie didn’t do it. The Treasury’s $3/4 trillion rescue/bailout package didn’t do it. And another quarter trillion will?

My disagreement, briefly stated, is:

  • It’s not much of a development
  • To the extent that it is a development, it’s encouraging

The Fed’s ambition to pay interest on reserve deposits has been discussed on PrefBlog on May 16, May 7, April 29 and January 29.

The Fed’s primer on reserve balances is getting a little dated at this point, but the current version is from May 2007 and contains the following language:

The Fed has long advocated the payment of interest on the reserves that banks maintain at Federal Reserve Banks. Such a step would have to be approved by Congress, which traditionally has been opposed because of the revenue loss that would result to the U.S. Treasury. Each year the Treasury receives the Fed’s revenue that is in excess of its expenses. The payment of interest on reserves would, of course, be an additional expense to the Fed.

The Congressional Budget Office estimates the cost of the measure to be in the $250-300-million range annually. Fed Governor Laurency Meyer was begging for authority to pay interest in 1998:

In recent years, developments in computer technology have allowed depositories to begin sweeping consumer transaction deposits into nonreservable accounts. In consequence, the balances that depositories hold at Reserve Banks to meet reserve requirements have fallen to quite low levels. These consumer sweep programs are expected to spread further, threatening to lower required reserve balances to levels that may begin to impair the implementation of monetary policy. Should this occur, the Federal Reserve would need to adapt its monetary policy instruments, which could involve disruptions and costs to private parties as well as to the Federal Reserve. However, if interest were allowed to be paid on required reserve balances and on demand deposits, changes in the procedures used for implementing monetary policy might not be needed.

Read the whole speech, it’s interesting (subject to the reader being a monetary policy geek).

So now the argument takes form:

  • US Banks, for good reasons or bad, are subject to reserve requirements on certain types of account
  • If the account is reservable, they will have to send a fraction of the money deposited to the Fed and get no interest
  • Depositors want interest. Depositors LIKE interest
  • Depositors will move to higher yielding money market funds unless the deposits pay a competitive rate
  • Therefore, the banks must eat the cost of zero-interest reserves when setting rates
  • Therefore, they encourage the move of deposits to sweep accounts, or other non-reservable vehicles
  • This hinders the transmission of the Fed’s monetary policy

To illustrate the last point, consider a world in which:

  • Deposits are 100% reservable
  • Reserves pay the Fed Funds Target Rate

In such a world, deposits will pay Fed Funds less a spread, and – importantly – changes in the FF rate will be instantaneously transmitted to depositors and the Fed’s implementation of monetary policy will be very quickly transmitted to the real economy.

All of this may be what Prof. Hamilton referred to as the fifteen minute back and forth, but he doesn’t discuss the history of the policy in his post.

Be that as it may, since the Fed has been begging for the authority to pay interest on reserves, and since Congress finally gave them this authority in 2006 – to commence in 2011 – I don’t really consider the three-year advancement in the effective date to be all that exciting a development. But, to the extent that it may be considered a development, it’s a good one.

Zero-interest reserves are, effectively, a tax on deposits and they are an extremely destructive tax. I think we can all breathe a sigh of relief that interest on reserves did not become a political issue so close to an election, at the very least.

It should be noticed that transmission of monetary policy is an issue in Canada, despite the fact that we do not have a fractional reserve system. There were problems with the transmission of the penultimate rate cut which were resolved with extraordinary measures via the CMHC.

Update: It has been pointed out to me that the CBO estimate of the costs of paying interest on reserve balances is inoperable, given that reserve balances are now in the $200-billion range rather than the $8.3-billion assumed by the CBO.

However, it will be remembered that in times of crisis, the disintermediation that has occurred in good times reverses; that is, investors who invested directly in, say, Commercial Paper, cash in their chips and return to bank deposits on grounds of safety; the banks then invest these funds in that same Commercial Paper and earn a spread as the intermediary – the process is called reintermediation.

What we are now seeing is reintermediation on a grand scale: now that interest is being paid on excess reserves, the banks themselves can avoid the perceived credit risk of Commercial Paper and leave their funds on deposit with the Fed; it is the Fed that is now putting the cash to work via such programmes as the TAF (this fulfills some of the term-extension function of banks); Maiden Lane (the Bear Stearns assets – term extension and credit risk); the Primary Dealer Credit Facility (replacing brokerage paper); the Asset Backed Commercial Paper Money Market Fund Liquidity Facility; and currency swaps (which subcontract the same work in different countries to the respective central banks).

The effect of this reintermediation has been referred to as “the Bernanke Twist”, a reprise of Kennedy’s Operation Twist, and characterized as working on the risk-premium rather than the liquidity premium. On the other hand Macroblog takes the view (endorsed by his employer!) that the primary intent is to set a lower bound for the Fed Funds rate (why lend to a bank at 1% when you can lend to the Fed at 2%?) and thereby reinforce the Fed’s primacy in monetary policy.

I see no reason why both explanations cannot be correct; it is simply that the reintermediation has occurred by happenstance and taken everybody by surprise; I am not aware of any argument being made to support reintermediation in the years of discussion regarding interest on reserve balances, although I hardly consider myself to be an expert on Fed policy.

As an aside, I will note that all these academic distinctions between credit risk and liquidity risk do not necessarily apply in the real world of bozo-investing. Huge amounts of funds are controlled by retail stockbrokers and individuals who have no idea that such a distinction exists, let alone make a serious attempt to analyze it. Ask these guys, for instance, why Pepsico paper is trading so wide of Treasuries:

Pepsico (an AA2 issuer) tapped the market for $2bilion 5 year notes and $1billion 10 year notes.

The 5 year issue had been trading in the secondary market at around a 260 spread to the 5 year Treasury. The issue priced at T+ 4 3/8 percent.

The 10 year issue had been trading at a spread of about 270 basis points to the 10 year Treasury. The issue priced at T+ 4 ¼ percent.

Each issue required a gigantic concession to where outstanding paper was trading to successfully clear the market. So the 5 year priced nearly 180 basis points cheap to outstandings and the 10 year traded about 155 cheap to comparable paper.

… and you will get the answer “credit risk”. Not one of them will even think about calculating the default rate implied by a credit spread of 425bp on ten-year paper and ask themselves whether it’s reasonable.

As another example, is the lock-up of the Commercial Paper market. I mean, holy smokes, Lehman goes bust, Reserve Primary Fund breaks the buck by a few pennies and Whoosh! $89.2-billion gets withdrawn from US-based MMFs the next day. Sorry, these are not rational actions made by coldly calculating players carefully plotting default risk versus their risk aversion. This is sheer panic, referred to as liquidity risk for convenience.

In the current environment, the banks can’t operate properly. They can’t make a highly lucrative ten-year loan to a solid company like Pepsico, because they’re terrified that Charles Schumer will provide an investment opinion on their bank and cause a run. All this forces the Fed to reintermediate, with a little help from Treasury’s Supplementary Financing Programme which has been discussed by Econbrowser‘s James Hamilton; in this particular case, it is not just the Fed, but Treasury as well that is reintermediating, bulking up their balance sheet by selling their own bonds to finance a diversified portfolio of corporates.

In loose terms, this reintermediation was forseen (or at least allowed for) by the CBO in their previously referenced cost estimate of paying interest on reserves:

CBO projects that, after the Federal Reserve changes its policies in 2012, the required reserve balances will be greater than under the current policy structure and the balances will generate additional net income to the Federal Reserve. Although the Federal Reserve will pay interest on the added reserves at approximately the federal funds rate, it will invest the reserves in Treasury securities, earning a rate of return approximately 0.6 of a percentage point more than it pays. As a result of that differential, CBO estimates that the Federal Reserve will generate profits on the added revenues of about $119 million over the 2012-2016 period.

The CBO estimate applies to normal times, and I certainly support the proposition that the Fed should get out of the reintermediation business as quickly as possible! However, in these extraordinary times, I suggest that the Fed’s spread is much more than the 60bp. For instance, the most recent TAF auction lent 28-day money at 1.11%; given that four-week bills were at 42bp this represents a spread of 69bp … not much, maybe, but holy smokes! This is FOUR-WEEK PAPER we’re talking about, guys! With respect to the Commercial Paper Funding Facility:

The commercial paper purchased by the SPV will be discounted based on a rate equal to a spread over the three-month overnight index swap (OIS) rate on the day of purchase. The SPV will not purchase interest-bearing commercial paper. The spread for unsecured commercial paper will be 100 basis points per annum and the spread for ABCP will be 300 basis points per annum. For unsecured commercial paper, a 100 basis points per annum unsecured credit surcharge must be paid on each trade execution date.

So yes, while the huge amount of reserves currently on the books will come with interest costs far in excess of the $350-million projection, these reserves can be used to buy higher yielding commercial paper at what is (in normal times) a penalty rate. Hopefully, the gross-up of the Fed’s balance sheet will gradually disappear as first the banks, then ultimate investors, are feeling brave enough to reintermediate.

My interlocuter – who pointed out that $350-million gross interest expense was a massive understatement – also asked me how much I thought it would take to get the job done.

Well, I don’t know. There are a lot of excesses to unwind, and we won’t be able to say we’re done until all – or, at least, most – of the currently unfashionable assets have rolled off the books one way or another; by being paid off (as I continue to think will be largely the case; it will be recalled that the credit agencies are projecting ultimate losses of 20-25% on 2006 sub-prime paper and the AAA tranches held by the banks have about 20% subordination) or by … er … not being paid off, which is the position of the Apocalyptionists.

Until then, what the Fed is doing is pure Bagehot, albeit on a larger scale than Bagehot dreamed of, and in a fashion that has been the result of Whack-a-Mole firefighting more than careful advance planning: the Fed is providing liquidity as required at a penalty rate. The only question in my mind is whether the penalties are high enough … but as the market mood veers toward analysis from its current panic, the penalties can always be raised pour encourager les autres.

The only mistake so far, I think, is allowing Lehman to fail … but neither I, nor any responsible commentator I know of, dreamed at the time that the bankruptcy would have such enormous systemic effects.
FCS.PR.A : Partial Redemption

Saturday, October 25th, 2008

Faircourt Asset Management has announced:

In connection with the annual redemption of the Trust, 149,777 Trust Units were submitted for redemption without matching Preferred Securities. Based on the terms of the annual redemption as detailed in the Final Prospectus dated February 27, 2006, the Manager announces that $1,497,770 in aggregate principal amount of the Trust’s 5.75% outstanding Preferred Securities (the “Preferred Securities”) will be redeemed on October 22, 2008 (the “Redemption Date”) at a price of $10.4097 for each $10.00 principal amount of Securities, being equal to the aggregate of (i) $10.3750 (the “Redemption Price”), and (ii) all accrued and unpaid interest hereon to but excluding the Redemption Date. The record date of the Preferred Securities partial redemption is October 13, 2008. [later “clarified” to October 14 – JH] Unitholders who submitted unmatched Trust Units will receive $5.9142 per Trust Unit ($6.2892 Net Asset Value per Trust Unit less the $0.3750 call premium on the Preferred Securities). Payment will be made in full on October 22, 2008 (the “Payment Date”).

I love that word “clarification”! It covers so much!

On June 30, 2008, there were 1,939,730 units (a unit is one FCS.UN and one FCS.PR.A), so the number redeemed is 7.7% of the June 30 total. I am unable to determine how many FCS.PR.A disappeared due to Concurrent Retraction.

Distributions to the capital unitholders have been halted and the issue is under Review-Negative by DBRS.

FCS.PR.A is not tracked by HIMIPref™.

FIG.PR.A & FCS.PR.A – Capital Unit Distributions Halted

Saturday, October 25th, 2008

Faircourt Asset Management has announced:

that in accordance with the terms of Trust Indentures governing the Preferred Securities and the maintenance of a minimum 1.4 times asset coverage to be maintained by the Trusts, dated November 17, 2004 for Faircourt Income & Growth Split Trust and March 16, 2006 for Faircourt Split Trust, monthly distributions on the Trust Units (TSX: FIG.UN, FCS.UN) will be suspended until further notice, in order to protect the Trusts’ Net Asset Value and to preserve the Trusts’ ability to rebuild and meet their respective investment objectives in the long term.

This announcement does not affect the quarterly distributions related to the Preferred Securities of either Trust (TSX: FIG.PR.A, FCS.PR.A).

The potential for a buy-back or partial redemption of FIG.PR.A has been discussed on PrefBlog; it is currently a member of the HIMIPref™ InterestBearing subindex. FCS.PR.A had a partial redemption last year and another one this year.

Both issues are currently under Review-Negative by DBRS.

Update, 2008-10-29: Note that according to the June 30 Financials, there were 9,964,308 Preferred Securites and 7,061,762 Capital units, or about 0.71 Capital Units per Preferred … which is good to remember when computing asset coverage!

Split-Share Buy-Backs? WFS.PR.A & FIG.PR.A Examined

Saturday, October 25th, 2008

Assiduous Reader pugwash doesn’t say much, but when he does it’s to the point.

In the comments to October 20 he asked:

Newb question:

At current prices, why doesn’t BAM (for example) buy some of its prefs back.

… and I replied …

Don’t be so down on yourself, it’s a perfectly good question.

There have been scattered reports of LBO Debt Buybacks:

Kohlberg Kravis Roberts & Co. and PAI Partners bought loans used for their takeovers after prices tumbled in February. The purchases helped cut the global backlog of leveraged buyout debt to $91 billion from $230 billion nine months ago, according to Bank of America Corp.

… and more recently:

Apollo, TPG and Blackstone are reported to be close to a deal to buy USD 12.5 billion in “distressed” buyout debt, at the bargain price of what the New York Times has identified as “in the mid-80 cents on the dollar.” This is lower than the USD 87 cents identified as the average trading price by a special Credit Suisse index, but more than the 70-80 cents that many other buyout loans are currently trading at.

With respect to BAM particularly … the glib, meaningless answer is that they expect to be able to invest those funds as vultures, earning more than they could save from a buy-back of their own debt. Brookfield has a very expansionist agenda and could well just be waiting for a major bankruptcy, for instance, to put good assets that fit with their portfolio on the market for a song.

Even if that is not the case, there is always the question of liquidity. They have about $3-billion in liquidity now and they may be hoarding it … why buy back 5-year debt when they have the same amount of debt maturing next year that might be a nightmare to refinance? Nobody knows for sure how long this very tight environment is going to last … so everybody’s sitting on whatever cash they have …

… and now he’s followed up the crusher …

Thanks – helpful answer:

Which breeds a follow on question – how about the buy back situation with split share prefs (particularly short dated ones).

Doesn’t it make sense in today’s market for the issuer to buy back the pref at way below the $10 they will have to pay in a few years time.

Wouldn’t this also improve the asset coverage ratio.

Or is this what the difficult to understand retraction feature, you mentioned in September for eg WFS is all about.

Well, there’s a glib and cynical answer to that one and it’s tempting just to say: a buy-back is a voluntary reduction of Assets Under Management by the Manager; therefore a voluntary reduction of pay; and how likely is that?

But there is also the question of reputation. There are many shops (e.g., Mulvihill, Quadravest, Faircourt, inter alia) that make quite a good living packaging split shares and default on one series of prefs might make it harder to sell another.

I’m not a big believer in reputation, at least not as far as investment returns go (outright theft, fraud and such is another matter). The Street’s memory is short – the markets for Monthly Auction Preferred Shares and bank-issued 100-year floating rate bonds collapsed twenty years ago and now everybody’s pretending to be surprised about the collapse of the Auction Rate Securities market in the States. If nothing else, most readers will know that there are many stockbrokers and asset managers with little or no investment ability but who – somehow! – are able to attract money. The business is about selling, not performance.

Mulvihill is a particularly good case in point; I got extremely upset with them in the wake of the Tech Wreck for proposing to buy back full units of Global Telecom (GT.A & GT.PR.A) at a time when the asset coverage of the preferreds was less than 1.0, and when the combined price of the securities was less than NAV.

I took the view that there was nothing in the prospectus to prevent them from buying back the prefs only; and that buying back the capital units was an irresponsible waste of preferred shareholders’ money. They took the view that the prospectus forced them to buy back equal numbers of the two classes. The prospectus is very badly drafted; interested readers may decide for themselves who was right.

Anyway, my point is that despite my strong disapproval of their actions with respect to the buy-back plan, I have still been willing to invest in WFS.PR.A. Another day, another dollar … if you do business only with people you agree with all the time, you’ll soon not be doing much business.

So, speaking of WFS.PR.A (which is currently under Review-Negative, and I suspect a downgrade to Pfd-3 is forthcoming) let’s have a look at the prospectus:

Subject to applicable law, the Company may at any time or times purchase Preferred Shares and Class A Shares for cancellation at prices per Unit not exceeding the NAV per Unit on the Valuation Date immediately prior to such purchase.

… and we see that they’ve learnt something about prospectus-writing, because right there on the front page it says:

The Preferred Shares and the Class A Shares are offered separately but will be issued only on the basis that an equal number of each class of shares will be issued and outstanding.

So in the case of WFS.PR.A, they have the ability to buy-back full units for cancellation, as long as they do it at a price below NAV, which will improve the NAV of the remaining units. This situation is particularly poignant for WFS.PR.A because it is currently sitting on a whack of cash – which has cushioned the blow of falling share prices in this awful market. As of June 30:

  • Canada, 35.9%
  • US, 23.3%
  • International, 23.0%
  • Cash, 21.3%
  • Other, -3.5%

Note also that 17.6% of the equities held were hedged with Puts. Putting that cash to work buying units might be a Good Thing: As of October 16, NAV was $13.82; WFS.PR.A closed at $8.00; WFS closed at $3.93; so the units as a whole closed at a 13.7% discount to NAV.

The other consideration they must account for when determining whether or not to buy back units is whether they will pre-empt unitholder retractions or be adding to them. From a business perspective, a simple pre-emption is a wonderful thing, since they will have lost the AUM anyway and it’s simply a question of who gets to keep the discount. I have previously noted that the discount is so extreme that even the Monthly Retraction, with its 4% built-in fee, is attractive. The “Annual Concurrent Retraction”, for which the retractor will receive full NAV, is even more attractive to arbitrageurs, but doesn’t happen until June.

So the question, as of October 16 prices, is who gets to keep the 13% market value discount to NAV? In a buy-back, the company gets to keep it; in a monthly retraction, the company only gets about a third of it; in an Annual Retraction, the company gets none of it. A buy-back would certainly make sense for both the Preferred Shareholders AND the capital unitholders … but, unfortunately, they don’t get a vote. It’s in the lap of Mulvihill.

Another highly interesting situation worth highlighting is the potential for FIG.PR.A to be partially called. Their prospectus has none of this silly stuff about keeping the number of shares equal; instead it states:

Preferred Securities may be redeemed in whole or in part by the Trust upon notice to Securityholders in accordance with the Trust Indenture at any time that the aggregate principal amount outstanding of the Preferred Securities exceeds 40% of the Total Assets. All Preferred Securities outstanding at maturity or immediately prior to the termination of the Trust, if earlier, will be redeemed by the Trust. The Preferred Securities would, in any such case, be redeemed at par, plus any accrued but unpaid interest.

This implies that redemption at par is an option for the company whenever asset coverage falls below 2.5:1. The surprising thing is that they have done it, redeeming about one-sixth of the preferreds in March. Now that distributions have been halted for the capital shares:

Faircourt Asset Management Inc., as Manager of Faircourt Income & Growth Split Trust (TSX: FIG.UN, FIG.PR.A) and Faircourt Split Trust (TSX: FCS.UN, FCS.PR.A) announces today that in accordance with the terms of Trust Indentures governing the Preferred Securities and the maintenance of a minimum 1.4 times asset coverage to be maintained by the Trusts, dated November 17, 2004 for Faircourt Income & Growth Split Trust and March 16, 2006 for Faircourt Split Trust, monthly distributions on the Trust Units (TSX: FIG.UN, FCS.UN) will be suspended until further notice, in order to protect the Trusts’ Net Asset Value and to preserve the Trusts’ ability to rebuild and meet their respective investment objectives in the long term.

… and the prefs are under Review-Negative, there is the potential – POTENTIAL! – for another partial call at par, which would be very good news for the preferred shareholders, given that FIG.PR.A closed at 7.67-70, 1×1 yesterday. Note, however, that they also have authorization to buy back the preferreds:

The Trust Indenture will provide that, subject to applicable law, the Trust may, in its sole discretion, from time to time, purchase (in the open market or by invitation for tenders) Preferred Securities for cancellation up to a maximum in any calendar year of ten percent of the aggregate principal amount of Preferred Securities outstanding at the beginning of that calendar
year.

So, what can I say to summarize? Rule #1 is, of course, be familiar with the prospectus. If investing was easy, it wouldn’t be fun! Bear in mind at all times that what’s good for you is not necessarily good for the Manager – I have not heard back from the company yet, but until I do, my working hypothesis is that the BSD.PR.A suspension of retractions is abusive to the shareholders. And if you decide to play any arbitrage games, remember at all times that it’s not a straightforward arbitrage – there are a lot of things that can go wrong.

October 24, 2008

Friday, October 24th, 2008

Holy smokes. Thirty-year Treasuries hit an all-time low yield in the morning, 3.93%, following overnight carnage in overseas equities. Corporates were hugely wide. Sterling got slaughtered and Denmark bucked the trend hiking the policy rate by 50bp to defend the krone. Trading curbs were imposed on US equity futures after a 6% limit-drop overnight.

All this before the markets opened!

And then it fizzled. It did in Canada, anyway:

The Standard & Poor’s/TSX Composite Index dropped 0.4 percent to 9,294.09 in Toronto after earlier falling 7.5 percent, the most in eight years, to the lowest since September 2004. The S&P/TSX, which derives three-quarters of its value from finance, energy and materials shares, slid 2.8 percent this week and is poised for a 21 percent drop in October, the steepest since the crash of 1987.

… but US Equities tanked:

The Standard & Poor’s 500 Index lost 3.5 percent, a smaller decline than European and Asian equities, even after futures on the U.S. measure fell so far that trading was curbed.

… while Treasuries steepened on a volatile but light day:

The 2 year note is trading at 1.50 percent and is better by 10 basis points for the day. The yield on the 5 year note has tumbled 8 basis points to 2.55 percent. The yield on the 10 year note has declined 1 basis point to 3.66percent (it had traded as low as 3.53 percent this morning). The yield in the Long Bond is unchanged at 4.05 percent. As I noted in a previous posting the yield on the bond reached a modern era low earlier today at 3.88 percent.

The 2year/10 year spread has widened 9 basis points to 216 basis points.

Traders and sales persons report light flows in the Treasury market. Several participants reported that clients who did trade were only doing what they were compelled to do. Most activity seemed directed toward reducing risk and balance sheet.

There’s a report that marketting of the BCE takeover debt will commence next week, but I’m not convinced it means a row of beans. You can bet that on this deal, the lawyers are in charge and if there is the slightest possibility that the deal will fail, all parties want to be able to tell the judge they tried. Who knows? Somebody or other will be taking an immediate massive write-down if the deal proceeds.

Whoosh! And that’s the end of that week!

Note that these indices are experimental; the absolute and relative daily values are expected to change in the final version. In this version, index values are based at 1,000.0 on 2006-6-30.
The Fixed-Reset index was added effective 2008-9-5 at that day’s closing value of 1,119.4 for the Fixed-Floater index.
Index Mean Current Yield (at bid) Mean YTW Mean Average Trading Value Mean Mod Dur (YTW) Issues Day’s Perf. Index Value
Ratchet N/A N/A N/A N/A 0 N/A N/A
Fixed-Floater 5.76% 5.76% 67,398 14.62 6 -1.0222% 938.8
Floater 6.55% 6.63% 46,228 13.02 2 -5.1521% 524.6
Op. Retract 5.31% 6.07% 129,153 4.06 14 +0.3441% 995.0
Split-Share 6.36% 10.99% 57,135 4.00 12 -1.7560% 924.0
Interest Bearing 8.19% 15.03% 58,670 3.28 3 -2.8515% 860.4
Perpetual-Premium 6.79% 6.87% 48,785 12.66 1 -1.1178% 913.5
Perpetual-Discount 6.77% 6.84% 173,214 12.79 70 -1.0176% 800.2
Fixed-Reset 5.15% 5.15% 855,801 15.12 10 -0.2786% 1,078.8
Major Price Changes
Issue Index Change Notes
BNA.PR.C SplitShare -7.7188% Asset coverage of just under 2.8:1 as of September 30 according to the company. Coverage now of 2.1-:1 based on BAM.A at 21.72 and 2.4 BAM.A held per preferred. Now with a pre-tax bid-YTW of 12.79% based on a bid of 13.39 and a hardMaturity 2019-1-10 at 25.00. Compare with BNA.PR.A (17.51% to 2010-9-30) and BNA.PR.B (10.42% to 2016-3-25). Closing quote 13.39-14.90, 5×10. Day’s range, 13.38-14.97.
WFS.PR.A SplitShare -7.4720% Asset coverage of 1.4-:1 as of October 16, according to Mulvihill. On Review-Negative by DBRS. Now with a pre-tax bid-YTW of 18.05% based on a bid of 7.43 and a hardMaturity 2011-6-30 at 10.00. Closing quote of 7.43-66, 3×11. Day’s range of 7.50-69.
FIG.PR.A InterestBearing -7.2551% Asset coverage of just under 1.4:1 as of October 15, according to Faircourt. On Review-Negative by DBRS. Now with a pre-tax bid-YTW of 11.86% based on a bid of 7.67 and a hardMaturity 2014-12-31 at 10.00. Closing quote 7.67-70, 1×1. Day’s range of 7.65-27.
BAM.PR.K Floater -7.0698% Let’s look at this rationally, shall we? It pays 70% of prime on $25. The perps, BAM.PR.M & BAM.PR.N pay $1.1875. So we set up an equation, 0.7*Prime*25 / Price(Floater) = 1.1875 / Price(Perp). Use $10.00 for the price of the floater, $13.30 for the price of the perp. Solve for Prime=5.10%. At the prices given, the yield will be equal to the fixed-rate issues when Canada Prime is 5.10%. Make whatever other adjustments you like for liquidity and the drawback/benefit it being floating rate … and I say, for the first time I can remember in a LONG time, floaters are getting competitive with straights. Or, at least, this one is.
MFC.PR.C PerpetualDiscount -6.1494% Now with a pre-tax bid-YTW of 7.00% based on a bid of 16.33 and a limitMaturity. Closing quote 16.33-49, 3×13. Day’s range 16.20-76.
NA.PR.N FixedReset -6.1224% Not particularly meaningful … closing quote 23.00-24.87, 10×3. Day’s range 24.50-60.
ELF.PR.G PerpetualDiscount -4.0000% Now with a pre-tax bid-YTW of 8.34% based on a bid of 14.40 and a limitMaturity. Closing Quote 14.40-75, 5×7. Day’s range of 14.75-00.
MFC.PR.B PerpetualDiscount -3.8462% Now with a pre-tax bid-YTW of 6.75% based on a bid of 17.50 and a limitMaturity. Closing Quote 17.50-80, 1×10. Day’s range of 17.70-20.
FTN.PR.A SplitShare -3.4898% Asset coverage of 2.2+:1 as of September 30 according to the company. Now with a pre-tax bid-YTW of 9.25% based on a bid of 8.02 and a hardMaturity 2015-12-1 at 10.00. Closing quote of 8.02-10, 10×4. Day’s range 8.25-30.
BAM.PR.B Floater -3.4716%  
DFN.PR.A SplitShare -3.4115% Asset coverage of 1.9+:1 as of October 16, according to some guy’s estimate. Now with a pre-tax bid-YTW of 7.30% based on a bid of 9.06 and a hardMaturity 2014-12-1 at 10.00. Closing quote 9.06-44, 3×5. Day’s range 9.05-42.
CM.PR.I PerpetualDiscount -3.3846% Now with a pre-tax bid-YTW of 7.55% based on a bid of 15.70 and a limitMaturity. Closing Quote 15.70-83, 9×3. Day’s range of 15.76-24.
RY.PR.H PerpetualDiscount -3.2373% Now with a pre-tax bid-YTW of 6.48% based on a bid of 21.82 and a limitMaturity. Closing Quote 21.82-77, 2×1. Day’s range 21.50-23.00 (!).
HSB.PR.D PerpetualDiscount -3.1562% Now with a pre-tax bid-YTW of 6.88% based on a bid of 18.41 and a limitMaturity. Closing Quote 18.41-90, 1×8. One Trade at 19.00.
FFN.PR.A SplitShare -3.1250% Asset coverage of 1.6-:1 as of October 15 according to the company. Now with a pre-tax bid-YTW of 10.49% based on a bid of 7.75 and a hardMaturity 2014-12-1 at 10.00. Closing quote of 7.75-06, 19×1. Day’s range of 7.75-81.
FBS.PR.B SplitShare -3.0168% Asset coverage of 1.4+:1 as of October 23 according to TD Securities. On Watch-Negative by DBRS. Now with a pre-tax bid-YTW of 10.00% based on a bid of 8.68 and a hardMaturity 2011-12-15 at 10.00. Closing quote of 8.68-85, 10×6. Day’s range of 8.66-67.
CM.PR.D PerpetualDiscount -2.6536% Now with a pre-tax bid-YTW of 7.31% based on a bid of 19.81 and a limitMaturity. Closing Quote 19.81-00, 3X1. Day’s range of 19.99-59.
BNS.PR.K PerpetualDiscount -2.5128% Now with a pre-tax bid-YTW of 6.35% based on a bid of 19.01 and a limitMaturity. Closing Quote 19.01-50, 5×12. Day’s range 19.00-74.
BCE.PR.Z FixFloat -2.3902%  
BMO.PR.K PerpetualDiscount -2.2843% Now with a pre-tax bid-YTW of 6.97% based on a bid of 19.25 and a limitMaturity. Closing Quote 19.25-75, 3×10. Day’s range 19.18-75.
POW.PR.D PerpetualDiscount -2.2569% Now with a pre-tax bid-YTW of 6.94% based on a bid of 18.19 and a limitMaturity. Closing Quote 18.19-25, 4×10. Day’s range 18.25-60.
BCE.PR.A FixFloat -2.1415%  
LBS.PR.A SplitShare +3.0952% Asset coverage of 1.7+:1 as of October 23, according to Brompton Group. Now with a pre-tax bid-YTW of 8.64% based on a bid of 8.66 and a hardMaturity 2013-11-29 at 10.00. Closing quote of 8.66-99, 74×1. Day’s range of 8.45-66.
BAM.PR.I OpRet +3.7929% Now with a pre-tax bid-YTW of 10.51% based on a bid of 20.25 and softMaturity 2013-12-30 at 25.00. Compare with BAM.PR.H (11.61% to 2012-3-30), BAM.PR.J (9.39% to 2018-3-30) and BAM.PR.O (10.96% to 2013-6-30). Closing quote 20.25-00, 5×13. Day’s range 19.00-21.00.
BNA.PR.B SplitShare +3.9773% See BNA.PR.C, above. Closing Quote 18.30-40, 5×4. Day’s range 18.29-40.
TD.PR.Y FixedReset +4.8297%  
Volume Highlights
Issue Index Volume Notes
GWO.PR.I PerpetualDiscount 291,475 RBC crossed five blocks: 98,400; 100,000; 29,500; 10,000; and 25,00; all at 16.60. Now with a pre-tax bid-YTW of 6.91% based on a bid of 16.50 and a limitMaturity.
BMO.PR.I OpRet 86,600 TD crossed 72,700 at 25.29; Nesbitt crossed 13,500 at the same price. Called for redemption.
MFC.PR.B PerpetualDiscount 45,150 Nesbitt bought 11,000 from anonymous at 18.20, then crossed 15,700 at 17.71. Now with a pre-tax bid-YTW of 6.75% based on a bid of 17.50 and a limitMaturity.
TD.PR.O PerpetualDiscount 41,295 TD crossed 10,000 at 19.00. Now with a pre-tax bid-YTW of 6.45% based on a bid of 18.92 and a limitMaturity.
CM.PR.H PerpetualDiscount 31,925 Now with a pre-tax bid-YTW of 7.47% based on a bid of 16.19 and a limitMaturity.

There were thirty-seven other index-included $25-pv-equivalent issues trading over 10,000 shares today.