Archive for September, 2009

September 30, 2009

Wednesday, September 30th, 2009

I’ve been wondering when there would be some more news on CIT! Here’s a rumour:

Citigroup Inc. and Barclays Capital are offering to provide financing to CIT Group Inc., the commercial lender that’s struggling to avert bankruptcy, according to people familiar with the situation.

The 101-year-old company’s bondholders are also seeking to provide about $2 billion in loans as a restructuring deadline approaches tomorrow, said the people, who declined to be identified because the negotiations are private. New York-based CIT may choose other options, the people said.

CIT said in July it may seek court protection from creditors after Chief Executive Officer Jeffrey Peek failed to win a second government bailout and had to turn to bondholders for $3 billion in rescue financing. The company said in an Aug. 17 regulatory filing that it has to come up with a plan “acceptable” to the majority of a bondholder steering committee that provided it with the emergency cash by Oct. 1.

More rumours:

CIT Group Inc., the 101-year-old commercial lender, is planning to start a debt exchange offer that will include a so-called pre-packaged bankruptcy option, a person familiar with the matter said.

The company plans to start a voluntary swap “within days,” said the person, who declined to be identified because talks are private. At the same time, New York-based CIT proposes that debt holders vote on a pre-packaged bankruptcy plan in case the exchange fails, the person said.

The preferred share market closed the month on a sour note, with PerpetualDiscounts down 13bp and FixedResets losing 7bp. Index figures are still unofficial, but I make PerpetualDiscounts down 1.20% total return for the month and FixedResets up 0.21%. Volume was good on the day, led by the TRP new issue and dominated by other FixedResets.

PerpetualDiscounts closed yielding 5.80%, equivalent to 8.12% interest at the standard equivalency factor of 1.4x. Long Corporates now yield a smidgen under 6.0%, so the pre-tax interest-equivalent spread is now about 215 bp, a widening of 10bp from the 205bp reported September 23 and at the high end of “Credit Crunch Normal”.

Congratulations to Assiduous Reader beluga, who won yesterday‘s over/under contest on the TRP new issue volume!

HIMIPref™ Preferred Indices
These values reflect the December 2008 revision of the HIMIPref™ Indices

Values are provisional and are finalized monthly
Index Mean
Current
Yield
(at bid)
Median
YTW
Median
Average
Trading
Value
Median
Mod Dur
(YTW)
Issues Day’s Perf. Index Value
Ratchet 0.00 % 0.00 % 0 0.00 0 0.9401 % 1,524.6
FixedFloater 5.78 % 4.02 % 50,922 18.56 1 -0.1062 % 2,657.7
Floater 2.40 % 2.05 % 36,609 22.32 4 0.9401 % 1,904.6
OpRet 4.87 % -6.23 % 131,619 0.09 15 -0.0128 % 2,285.0
SplitShare 6.39 % 6.58 % 792,219 4.00 2 -0.1980 % 2,069.0
Interest-Bearing 0.00 % 0.00 % 0 0.00 0 -0.0128 % 2,089.5
Perpetual-Premium 5.79 % 5.70 % 149,116 13.70 12 -0.0331 % 1,873.1
Perpetual-Discount 5.77 % 5.80 % 205,631 14.21 59 -0.1349 % 1,790.7
FixedReset 5.48 % 4.11 % 453,721 4.09 41 -0.0711 % 2,108.8
Performance Highlights
Issue Index Change Notes
SLF.PR.C Perpetual-Discount -1.17 % YTW SCENARIO
Maturity Type : Limit Maturity
Maturity Date : 2039-09-30
Maturity Price : 18.63
Evaluated at bid price : 18.63
Bid-YTW : 6.02 %
PWF.PR.K Perpetual-Discount -1.11 % YTW SCENARIO
Maturity Type : Limit Maturity
Maturity Date : 2039-09-30
Maturity Price : 21.45
Evaluated at bid price : 21.45
Bid-YTW : 5.88 %
MFC.PR.C Perpetual-Discount 1.47 % YTW SCENARIO
Maturity Type : Limit Maturity
Maturity Date : 2039-09-30
Maturity Price : 19.35
Evaluated at bid price : 19.35
Bid-YTW : 5.87 %
BMO.PR.M FixedReset 1.56 % YTW SCENARIO
Maturity Type : Call
Maturity Date : 2013-09-24
Maturity Price : 25.00
Evaluated at bid price : 26.01
Bid-YTW : 4.00 %
TRI.PR.B Floater 2.08 % YTW SCENARIO
Maturity Type : Limit Maturity
Maturity Date : 2039-09-30
Maturity Price : 19.60
Evaluated at bid price : 19.60
Bid-YTW : 2.00 %
Volume Highlights
Issue Index Shares
Traded
Notes
TRP.PR.A FixedReset 896,387 New issue settled today.
YTW SCENARIO
Maturity Type : Limit Maturity
Maturity Date : 2039-09-30
Maturity Price : 24.93
Evaluated at bid price : 24.98
Bid-YTW : 4.50 %
CM.PR.M FixedReset 69,600 RBC crossed 45,000 at 27.55.
YTW SCENARIO
Maturity Type : Call
Maturity Date : 2014-08-30
Maturity Price : 25.00
Evaluated at bid price : 27.39
Bid-YTW : 4.25 %
RY.PR.I FixedReset 59,930 Scotia bought 12,500 from Merrill at 25.75.
YTW SCENARIO
Maturity Type : Limit Maturity
Maturity Date : 2039-09-30
Maturity Price : 23.45
Evaluated at bid price : 25.83
Bid-YTW : 4.32 %
CM.PR.L FixedReset 58,886 Nesbitt crossed 40,000 at 27.51.
YTW SCENARIO
Maturity Type : Call
Maturity Date : 2014-05-30
Maturity Price : 25.00
Evaluated at bid price : 27.50
Bid-YTW : 4.05 %
TD.PR.O Perpetual-Discount 52,385 Nesbitt crossed 38,700 at 22.35.
YTW SCENARIO
Maturity Type : Limit Maturity
Maturity Date : 2039-09-30
Maturity Price : 22.21
Evaluated at bid price : 22.35
Bid-YTW : 5.52 %
BMO.PR.M FixedReset 49,980 Nesbitt bought 10,000 from Blackmont at 25.69.
YTW SCENARIO
Maturity Type : Call
Maturity Date : 2013-09-24
Maturity Price : 25.00
Evaluated at bid price : 26.01
Bid-YTW : 4.00 %
There were 51 other index-included issues trading in excess of 10,000 shares.

TRP.PR.A Closes Firm on Heavy Volume

Wednesday, September 30th, 2009

TRP.PR.A, the 4.60%+192 FixedReset announced last week has settled, trading 896,387 shares in a range of 24.91-03 before closing at 24.98-00, 120×126.

I was actually a little disappointed at the volume – given that the issue was super-sized to 22-million shares, I had been hoping for a million shares trading on opening day … but it was not to be.

Vital statistics are:

TRP.PR.A FixedReset Not Calc! YTW SCENARIO
Maturity Type : Limit Maturity
Maturity Date : 2039-09-30
Maturity Price : 24.93
Evaluated at bid price : 24.98
Bid-YTW : 4.50 %

TRP.PR.A is tracked by HIMIPref™. It will be placed in the FixedReset subindex for now; at some point in the future the FixedReset index will be split into FixedResetPremium and FixedResetDiscount, but I will wait until the latter putative index can be adequately populated.

PRF.PR.A Matures at Par

Wednesday, September 30th, 2009

Connor, Clark & Lunn have announced (with a sigh of relief, I’m sure):

on behalf of ROC Pref Corp. (the “Company”) that the Company has matured as scheduled today. The redemption value will be $25.00 per Preferred Share, equal to the original subscription price, and all scheduled quarterly distributions have been paid. We thank you for your investment in ROC Pref Corp.

PRF.PR.A was last mentioned on PrefBlog when it was downgraded to P-2 by S&P. PRF.PR.A is not tracked by HIMIPref™

BIS Releases Report on Special Purpose Entities

Wednesday, September 30th, 2009

The Bank for International Settlements has released its Report on Special Purpose Entitites. Section I is the Executive Summary & Overview:

Section II provides a summary of market developments that contributed to the growth of the securitisation markets that relied heavily on the use of SPEs. Also described is the confluence of factors that played a part in the market crisis that began in mid-2007.

Section III focuses on the motivations of sponsoring firms and investors for employing SPEs. For originators and sponsors, these may include risk management, funding, accounting, or regulatory capital considerations.

Section IV describes the potential for informational asymmetries and problematic incentives to hamper the use of SPEs, examines potential issues and deficiencies in risk management, and explores ways in which risk transfer can potentially be over- or underestimated by both originators and investors.

Section V presents a series of policy issues and recommendations for consideration.

Appendix 1 is a primer on common types of SPE structures and programs, such as RMBS, CMBS, CDOs, ABCP conduits, structured investment vehicles (SIVs), repackaging vehicles, and transformer structures.

Appendix 2 continues with a more technical discussion of common features of SPEs. Legal forms, methods of achieving asset transfer, and accounting and regulatory capital considerations are discussed. Additionally, the roles of key parties to SPEs (eg the sponsor, originator, and servicer) are described, as well as issues related to the control and management of these entities.

Appendix 3 explores how the risk and return of assets in SPEs can be allocated among various parties and counterparties. Different forms of exposure can result from holding certain tranches and residual interests or from providing liquidity and credit guarantees. This section also includes a discussion of triggers, where the cash flows are redirected should a particular event occur.

Appendix 4 provides global data on the use of SPEs by financial institutions according to vehicle type and geography.

Appendix 5 provides the list of members of the Joint Forum Working Group on Risk Assessment and Capital.

IMF Releases October 2009 Global Financial Stability Report

Wednesday, September 30th, 2009

The International Monetary Fund has released the (prelimary version of) the Global Financial Stability Report, October 2009, with three chapters:

  • The Road to Recovery
  • Restarting Securitization Markets: Policy Proposals and Pitfalls
  • Market Interventions during the Financial Crisis: How Effective and How to Disengage?

I was happy to see the following in the Executive Summary:

But hard work lies ahead in devising capital penalties, insurance premiums, supervisory and resolution regimes, and competition policies to ensure that no institution is believed to be “too big to fail.” Early guidance at defining criteria for identifying systemically important institutions and markets—such as that being formulated by the International Monetary Fund, Financial Stability Board, and Bank for International Settlements for the G-20—should assist in this quest. Once identified, some form of surcharge or disincentive for marginal contributions to systemic risk will need to be formulated and applied.

A surcharge is infinitely preferable to flat prohibitions and Treasury’s special regime. The report repeatedly warns about “cliff effects” in the securitization market; such cliff effects are a sign of incompetent analysis; prohibitions and special regimes bring about cliff effects by their nature.

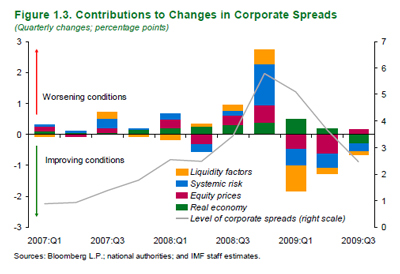
They produce an amazing chart decomposing credit spreads that I have trouble taking seriously:

There are no references cited for this decomposition. While I have great respect for IMF research and am sure they didn’t just pluck the numbers out of the air, it’s quite hard enough to decompose spreads into credit risk & liquidity (see, for example, The Value of Liquidity), without adding other factors.

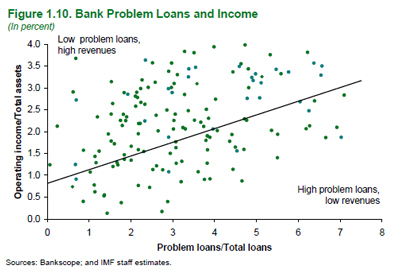
As if on purpose to reinforce my skepticism regarding connections between premises and conclusions, they publish an amazing regression analysis in the section titled “Will bank earnings be robust enough to absorb writedowns and rebuild capital cushions?”:

… with the comment:

To protect bottom line earnings, banks appear to have priced risky lending more expensively—as shown by the upward sloping trend line for European banks in Figure 1.10.

I think they’re trying too hard. Presented by the G-20 with a golden opportunity to expand their bureaucracy – after ten years of looking irrelevance in the face – I suspect that management has sent the word out to come up with the BEST conclusions and the BEST analysis and the BEST policy recommendations right away (for “best”, read “best looking”). Anybody who’s ever read a sell-side economic commentary will be very familiar with this paradigm.

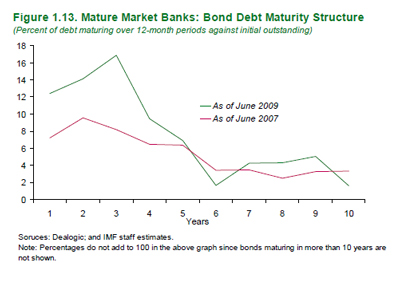
The term-shortening of bank financing was of interest:

We won’t be out of the woods until the term structure of bank liabilities returns to normal.

The second chapter provides a very good overview of securitization.

Break-Even Rate Shock Calculator

Wednesday, September 30th, 2009

Subscribers to PrefLetter and Canadian Moneysaver will know what this is!

The rest of you will have to wait until I republish the articles in about a month’s time.

BERS Calculator (MS-Excel Spreadsheet) NO LONGER AVAILABLE

Update, 2009-10-1: This spreadsheet was originally prepared by James Hymas of Hymas Investment Management Inc. The macro for automatic calculation of the Break Even Rate Shock was developed by Norbert Schlenker of Libra Investments.

Improved BERS Calculator

Update, 2010-9-26: Following comments on Financial Webring Wisdom Forum (link adjusted 2024-1-8), I have added a feature to the standard spreadsheet, above, that allows the user to specify that the issue will be called on the next reset date. This may be useful for those seeking to compare a high-premium, almost-certain-to-be-called FixedReset to a PerpetualDiscount.

New version allowing call certainty for high-premium FixedResets.

Update, 2010-9-27: like_to_retire, one of Financial Webring’s more reliable posters, claims:

Note that the calculator macro is incompatible with Excel 2007 unless the user deletes the reference for the add-in component Solver.xla and adds a new reference for Solver.xlam.

I do not have the facilities for checking this out myself, but thought I’d pass it on.

September 29, 2009

Tuesday, September 29th, 2009

The Ontario Securities Commission has released the 2009 Compliance Team Annual Report.

Lots of volume, with 61 issues in the HIMIPref™ indices trading over 10,000 shares, but not much price action today, with PerpetualDiscounts down 5bp and FixedResets losing 7bp. A bit more volatility than yesterday, with ten issues showing in the Performance Highlights table.

The big news tomorrow will be settlement of the TRP monster issue – I will be most interested to see how many shares trade. I make the over/under line to be a million shares … place yer bets in the comments!

HIMIPref™ Preferred Indices
These values reflect the December 2008 revision of the HIMIPref™ Indices

Values are provisional and are finalized monthly
Index Mean
Current
Yield
(at bid)
Median
YTW
Median
Average
Trading
Value
Median
Mod Dur
(YTW)
Issues Day’s Perf. Index Value
Ratchet 0.00 % 0.00 % 0 0.00 0 -0.1846 % 1,510.4
FixedFloater 5.77 % 4.02 % 51,550 18.57 1 -0.8421 % 2,660.5
Floater 2.43 % 2.07 % 37,053 22.27 4 -0.1846 % 1,886.9
OpRet 4.87 % -5.46 % 132,191 0.09 15 -0.1941 % 2,285.3
SplitShare 6.38 % 6.58 % 821,802 4.01 2 0.0000 % 2,073.1
Interest-Bearing 0.00 % 0.00 % 0 0.00 0 -0.1941 % 2,089.7
Perpetual-Premium 5.78 % 5.69 % 149,616 2.51 12 0.0662 % 1,873.7
Perpetual-Discount 5.76 % 5.80 % 205,075 14.23 59 -0.0477 % 1,793.1
FixedReset 5.49 % 4.09 % 451,456 4.09 40 -0.0655 % 2,110.3
Performance Highlights
Issue Index Change Notes
ELF.PR.F Perpetual-Discount -2.25 % YTW SCENARIO
Maturity Type : Limit Maturity
Maturity Date : 2039-09-29
Maturity Price : 20.42
Evaluated at bid price : 20.42
Bid-YTW : 6.64 %
BMO.PR.M FixedReset -1.99 % YTW SCENARIO
Maturity Type : Limit Maturity
Maturity Date : 2039-09-29
Maturity Price : 25.56
Evaluated at bid price : 25.61
Bid-YTW : 4.26 %
PWF.PR.F Perpetual-Discount -1.65 % YTW SCENARIO
Maturity Type : Limit Maturity
Maturity Date : 2039-09-29
Maturity Price : 22.17
Evaluated at bid price : 22.62
Bid-YTW : 5.89 %
BAM.PR.J OpRet -1.58 % YTW SCENARIO
Maturity Type : Soft Maturity
Maturity Date : 2018-03-30
Maturity Price : 25.00
Evaluated at bid price : 25.50
Bid-YTW : 5.14 %
BAM.PR.I OpRet -1.53 % YTW SCENARIO
Maturity Type : Call
Maturity Date : 2010-07-30
Maturity Price : 25.50
Evaluated at bid price : 25.70
Bid-YTW : 4.45 %
BMO.PR.K Perpetual-Discount -1.49 % YTW SCENARIO
Maturity Type : Limit Maturity
Maturity Date : 2039-09-29
Maturity Price : 22.94
Evaluated at bid price : 23.10
Bid-YTW : 5.75 %
GWO.PR.H Perpetual-Discount 1.02 % YTW SCENARIO
Maturity Type : Limit Maturity
Maturity Date : 2039-09-29
Maturity Price : 20.78
Evaluated at bid price : 20.78
Bid-YTW : 5.88 %
NA.PR.K Perpetual-Premium 1.04 % YTW SCENARIO
Maturity Type : Call
Maturity Date : 2012-06-14
Maturity Price : 25.00
Evaluated at bid price : 25.33
Bid-YTW : 5.65 %
CM.PR.E Perpetual-Discount 1.05 % YTW SCENARIO
Maturity Type : Limit Maturity
Maturity Date : 2039-09-29
Maturity Price : 23.76
Evaluated at bid price : 24.05
Bid-YTW : 5.81 %
HSB.PR.C Perpetual-Discount 1.28 % YTW SCENARIO
Maturity Type : Limit Maturity
Maturity Date : 2039-09-29
Maturity Price : 22.02
Evaluated at bid price : 22.15
Bid-YTW : 5.79 %
Volume Highlights
Issue Index Shares
Traded
Notes
BMO.PR.N FixedReset 57,587 RBC crossed 27,500 at 27.95.
YTW SCENARIO
Maturity Type : Call
Maturity Date : 2014-03-27
Maturity Price : 25.00
Evaluated at bid price : 27.93
Bid-YTW : 3.80 %
BMO.PR.J Perpetual-Discount 49,757 YTW SCENARIO
Maturity Type : Limit Maturity
Maturity Date : 2039-09-29
Maturity Price : 20.90
Evaluated at bid price : 20.90
Bid-YTW : 5.45 %
RY.PR.I FixedReset 38,230 YTW SCENARIO
Maturity Type : Call
Maturity Date : 2014-03-26
Maturity Price : 25.00
Evaluated at bid price : 26.00
Bid-YTW : 4.16 %
BMO.PR.M FixedReset 37,796 YTW SCENARIO
Maturity Type : Limit Maturity
Maturity Date : 2039-09-29
Maturity Price : 25.56
Evaluated at bid price : 25.61
Bid-YTW : 4.26 %
CM.PR.I Perpetual-Discount 33,660 YTW SCENARIO
Maturity Type : Limit Maturity
Maturity Date : 2039-09-29
Maturity Price : 20.30
Evaluated at bid price : 20.30
Bid-YTW : 5.79 %
TD.PR.O Perpetual-Discount 33,094 YTW SCENARIO
Maturity Type : Limit Maturity
Maturity Date : 2039-09-29
Maturity Price : 22.17
Evaluated at bid price : 22.31
Bid-YTW : 5.52 %
There were 61 other index-included issues trading in excess of 10,000 shares.

FRB Boston Paper on Use of Funds from Housing ATM

Tuesday, September 29th, 2009

The Boston Fed has released a Public Policy Discussion Paper by Daniel Cooper titled Did Easy Credit Lead to Economic Peril? Home Equity Borrowing and Household Behavior in the Early 2000s, which dispels at least part of the notion that Americans went insane earlier this decade and spent their home equity loans on beer and prostitutes:

Using data from the Panel Study of Income Dynamics, this paper examines how households’ home equity extraction during 2001‐to‐2003 and 2003‐to‐2005 affected their spending and saving behavior. The results show that a one‐dollar increase in equity extraction led to ninetyfive or ninety‐eight cents higher consumption expenditures. Nearly all of this spending increase was reversed in the subsequent period. A fair amount of these expenditures went toward home improvements and repairs. In addition, households used home equity to help finance their purchases of used cars. Equity extraction also led to some household balance sheet reshuffling. In particular, households who extracted equity were somewhat more likely than other households to pay down their higher‐cost credit card debt and to invest in other real estate and businesses. Overall, the results in this paper are consistent with households’ extracting equity during the first half of this decade to fund one‐time durable good consumption needs.

The author concludes, in part:

Overall, the results suggest that households’ reasons for borrowing against their homes have changed little over time. Households who have lower levels of financial wealth are more likely to extract equity as are households who experience strong local or regional house-price growth. In addition, the consumption analysis suggests that households borrowed against their homes in the early 2000s, to finance one-time consumption shocks. A one-dollar increase in equity extraction led to a roughly ninety-five cent increase in consumption between 2001 and 2003, which did not persist over time. In particular, consumption fell by roughly the same amount in the period ( 2003-to-2005) following the period when households extracted equity.

Additional analysis suggests that households extract equity for one-time, durable goods purchases. Roughly a quarter of each dollar of equity extraction goes toward home repairs and improvements, consistent with anecdotal evidence. Households also extract equity, for used car purchases. There is limited evidence, however, that households’ (non-durable) food purchases increase when they borrow against their homes. The findings also show that households have a roughly 10 percentage point higher predicted probability of paying down their non-collateralized debt when they extract equity than when they do not. Homeowners are also slightly more likely to invest in other real estate or personal businesses when they borrow against their houses. As a result, equity extraction has household balance sheet effects in addition to the effect of households’ borrowing to fund their one-time consumption needs.

The analysis in this paper does not cover the final years of the recent house-price boom, since the PSID data are available only through 2005.

So, while in hindsight it is obvious that American households became over-leveraged during the early part of the housing boom, it is something of a relief to learn that the money was spent on durable goods rather than immediate consumption.

Update, 2009-10-1: The Bank of Canada has released a related study by Ian Christensen, Paul Corrigan, Caterina Mendicino and Shin-Ichi Nishiyama titled Consumption, Housing Collateral, and the Canadian Business Cycle:

Using Bayesian methods, we estimate a small open economy model in which consumers face limits to credit determined by the value of their housing stock. The purpose of this paper is to quantify the role of collateralized household debt in the Canadian business cycle. Our findings show that the presence of borrowing constraints improves the performance of the model in terms of overall goodness of fit. In particular, the presence of housing collateral generates a positive correlation between consumption and house prices. Finally we find that housing collateral induced spillovers account for a large share of consumption growth during the housing market boom-bust cycle of the late 1980s.

New Issue: FFH FixedReset 5.75%+315

Tuesday, September 29th, 2009

Fairfax Financial Holdings has announced:

that it will issue in Canada 8 million Preferred Shares, Series C at a price of $25.00 per share, for aggregate gross proceeds of $200 million, on a bought deal basis to a syndicate of Canadian underwriters.

Holders of the Preferred Shares, Series C will be entitled to receive a cumulative quarterly fixed dividend yielding 5.75% annually for the initial five year period ending December 31, 2014. Thereafter, the dividend rate will be reset every five years at a rate equal to the then current 5-year Government of Canada bond yield plus 3.15%.

Holders of Preferred Shares, Series C will have the right, at their option, to convert their shares into Preferred Shares, Series D, subject to certain conditions, on December 31, 2014, and on December 31st every five years thereafter. Holders of the Preferred Shares, Series D will be entitled to receive cumulative quarterly floating dividends at a rate equal to the then current three-month Government of Canada Treasury Bill yield plus 3.15%.

Fairfax has granted the underwriters an option, exercisable in whole or in part at any time up to 48 hours prior to closing, to purchase an additional 2 million Preferred Shares, Series C at the same offering price for additional gross proceeds of $50 million.

Fairfax intends to use the net proceeds of the offering to augment its cash position, to increase short term investments and marketable securities held at the holding company level, to retire outstanding debt and other corporate obligations from time to time, and for general corporate purposes. The offering is expected to close on or about October 5, 2009.

The first dividend is payable 2009-12-31 for $0.34362.

This issue continues – and extends – the trend towards lower quality in FixedReset issuance: the issue is provisionally rated Pfd-3(low) by DBRS and P-3 by S&P.

It is rather interesting that a financial holding company is issuing cumulative preferreds (and I gnash my teeth about it, because “cumulative” has been a very good proxy for “non-financial” in my analysis). Assiduous Readers will remember that Treasury’s wish-list for bank regulation includes:

many of the [Bank Holding Companies] that have been most active in volatile capital markets activities have not been held to the highest consolidated regulatory capital standard available. To remedy this situation, in addition to the current [Financial Holding Company (FHC)] eligibility requirements, all FHCs should be required to achieve and maintain well-capitalized and well-managed status on a consolidated basis.

In civilized countries (as opposed to Canada), Tier 1 Capital is not cumulative, so Fairfax is either unconcerned about the prospects of consolidation or is convinced that this issue will be grandfathered if consolidation becomes effective.

CM DRIP: Preferred Dividends into Discounted Common

Tuesday, September 29th, 2009

Better late than never! The Canadian Imperial Bank of Commerce has announced (2009-5-29):

amendments to its Shareholder Investment Plan. Under the Plan, shareholders resident in Canada or the United States may elect to have dividends reinvested in
additional common shares of CIBC.

CIBC has decided to issue shares from treasury at a 3% discount from the Average Market Price (as defined in the Plan) until such time as CIBC elects otherwise. The discount applies to the distribution of common shares under the “Dividend Reinvestment Option” or “Stock Dividend Option” portions of the
Plan. The discount will not apply to shares purchased under the “Share Purchase Option” of the Plan.

Under the Plan, CIBC determines whether the additional common shares are purchased on the secondary market or are newly-issued by CIBC. Previously, shares were purchased on the secondary market with no discount from the Average Market Price.

In addition, under the amended Plan CIBC may designate certain series of CIBC preferred shares as eligible to participate in the Plan. Holders of eligible preferred shares may elect to have dividends on those preferred shares reinvested in common shares of CIBC. CIBC has designated each series of currently authorized preferred shares as eligible to participate in the Plan.

These changes will be effective starting with the dividend payable on July 28, 2009 to common and preferred shareholders of record on June 29, 2009.

Ongoing participants in the Plan will automatically have the discount applied to the reinvestment of their dividends on the July 28, 2009 payment date.

The letter to plan participants states:

The 3% discount will continue until further notice. CIBC reserves the right, in its sole discretion, to amend or cancel the discount or the Plan at any time, to determine whether common shares purchased under the Plan will be purchased on the secondary market or issued from treasury and to determine which series of CIBC preferred shares, if any, are eligible to participate in the Plan.

There does not appear to be a convenient way in which the current status of the DRIP can be checked on-line. Those interested in participating will have to check the Financial News Releases regularly, or contact Investor Relations.

The following CM preferred share issues are outstanding: CM.PR.P, CM.PR.R, CM.PR.A, CM.PR.D, CM.PR.E, CM.PR.G, CM.PR.H, CM.PR.I, CM.PR.J, CM.PR.K, CM.PR.L, CM.PR.M. All are tracked by HIMIPref™. There is also the ridiculous Series 28, which is not listed and therefore has no symbol.