The OSC says it can’t enforce OBSI compensation recommendations:
The Ontario Securities Commission (OSC) says that it does not have the authority to require dealers to comply with compensation recommendations from the Ombudsman for Banking Services and Investments (OBSI).
The OSC published the final version of its statement of priorities for the current fiscal year today, defending its commitment to investor protection and promising to hold a summit this fall to examine seniors’ issues. But it also declared that it couldn’t enforce OBSI’s recommendations even if it wanted to, without first amending securities legislation.
Responding to comments it received on a draft version of the statement, the OSC notes: “Some commenters have suggested that the OSC should compel payments to investors [when OBSI rules in their favour]. The OSC does not have this authority and would need legislation to expand its powers in order to force binding decisions.”
Still, the regulator reiterates its belief in the importance of having a single dispute-resolution service for investors. And it says: “The [Canadian Securities Administrators (CSA)] has committed to continue to work with OBSI to ensure it has the capacity to effectively discharge its mandate.”
Perhaps. But the threat of an investigation into procedures is a pretty big stick, regardless of the ethics of using it. We’ll see how this plays out.
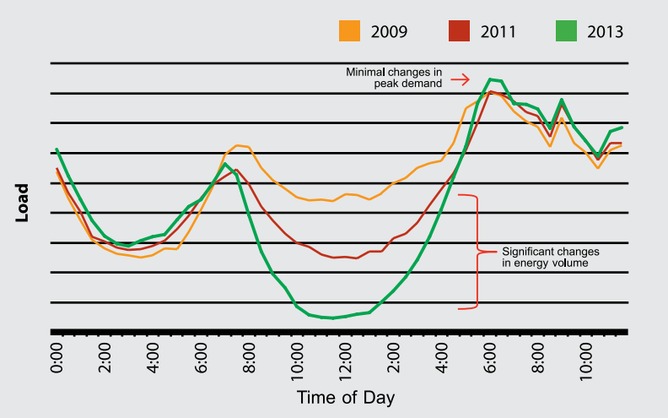
Assiduous Reader JP brings to my attention an article about Australian Solar Power entitled Slash Australians’ power bills by beheading a duck at night. It seems they have an “afternoon chasm” in grid energy demand:
 Click for Big
Such a chasm is feared in California, as discussed on June 5. What I found interesting in the article – which talks mainly about reducing peak demand through battery storage in houses with solar panels and improved energy efficiency in those without – was the degree of hidden subsidies:
Indeed, the ENA – the national body representing electricity transmission and distribution businesses throughout Australia – has recently suggested that a power consumer without solar PV panels now pays about A$60 a year more to subsidise homes with solar PV panels, due to “under-recovery of network costs” during summer evening peak periods.
Even so, that A$60 a year cost is much smaller than the subsidy to users of air conditioners.
The Productivity Commission estimates that the installation of each air conditioner adds A$2500 to the capital cost of powerlines and power stations: costs that all power consumers have to cover.
Much of that extra equipment is used for only a few hours each year, mainly on hot summer evenings.
Note that the author is trying on a rhetorical trick by discussing the annual rate of the solar panel subsidy vs. the capital cost of the air conditioner subsidy. The A$60 annual subsidy to solar users is equal to A$4,140 present value if discounted at 3%, or A$1,200 if discounted at 5%, neatly bracketing the A$2,500 present value of the air conditioner subsidy in order to make arguments over discount rates more interesting.
Mind you, though, JP has a rejoinder:
Given your above analysis, the $ solar subsidy is not much different than the effective air conditioning subsidy. So if you are correct about present value, the author’s is factually incorrect when he writes: “[the] A$60 a year [solar] cost is much smaller than the subsidy to users of air conditioners”
I can’t given my limited math check your present value numbers — obviously present value of a flow of funds depends on length of flow — you fail to make explicit your estimate of a solar panel’s life expectancy / the life expectancy of the regulations guaranteeing the solar subsidy. My guess of a reasonable range is 20-40 years.
I question your >>rhetorical trick by discussing the annual rate of the solar panel subsidy vs. the capital cost of the air conditioner subsidy<< .
I agree the "annual rate of a subsidy” is a very different measure than “the capital cost of a subsidy” and employing the two concepts in the same paragraph suggests either 1) lack of rigour, 2)laziness, or 3) an attempt to spin an argument. I suggest the author is guilty of 1) and 2) rather than 3).
The author is not contrasting two unrelated and different subsides but I think implicitly suggesting that subsidy to solar over time increases the subsidy for air conditioners (peak power requirements as a % of total demand from big power plants increases as solar increases its penetration.)
So its not “[annual] solar panel subsidy vs. the capital cost subsidy” but the combined subsidies resulting in >>the A$350 a year that households without air conditioners are being slugged to subsidise the bills of households running air conditioning at peak times.<< (I am unclear how the A$350 number is arrived at)
I was assuming the solar subsidy was to perpetuity. That may be wrong; but the life of the individual panel is not necessarily a factor in the calculation.
JP also passes along two older stories – one about negative power prices in the US:
Wind power has two advantages. Green energy laws in many states require utilities to buy wind energy under long-term contracts as part of their clean-energy goals and take that power even when they don’t need it. Wind farms also receive a federal tax credit of $22 for every megawatt-hour generated.
Thus, even when there is no demand for the power they produce, operators keep turbines spinning, sending their surplus to the grid because the tax credit assures them a profit.
On gusty days in the five states with the most wind power – – Texas, California, Iowa, Illinois and Oregon — this can flood power grids, causing prices to drop below zero during times when demand is light. Wholesale electricity during off-peak hours in Illinois has sold for an average price of $23.39 per megawatt hour since Jan. 1, after hitting a record low of -$41.08 on Oct. 11, the least since the Midwest Independent Transmission System Operator Inc. began sharing real-time pricing in 2005.
… and one about the pain in Spain:
In May [2013], the tariff deficit reached a whopping $34 billion.
What drove this deficit?
Overly generous renewable energy subsidies are at least partially to blame.
In 2007, Spain paid a premium of $556 per megawatt-hour for electricity that rooftop solar panels supplied to the electric grid, compared with an average $52 paid to competing coal- or gas-fired power plants. By 2012, a whopping $10.6 billion in subsidies were paid out to the renewable energy industry, rising by about 20% from the previous year, and covering more than one third of all electricity generated in Spain.
A recent report explained how Spain has sustained this massive deficit to date:
This debt derives from the financing of the difference between costs and revenues from regulated activities, accumulated in previous years. Most of the outstanding debt (66%) is held by FADE, the Deficit Securitization Fund for the Electricity System, the electricity firms hold 19% and third parties have 15%. The deficit was initially financed by the five largest electricity firms (Endesa, 44.16%; Iberdrola , 35.01%; Gas Natural Fenosa , 13.75%; Hidroeléctrica del Cantábrico, 6.08%; and E.On España, 1.00%), but the firms had transferred most of their deficit collection rights to FADE by the end of 2012. In 2012, FADE issued bonds for 9.9 billion euros at a cost for consumers of 5.617%.
Maybe the Spanish should declare sanctions and then enforce them:
The Federal Reserve on Monday announced a $508 million penalty against BNP Paribas, S.A., Paris, France–the largest penalty ever assessed by the agency–for violations of U.S. sanctions laws. The Federal Reserve also issued a joint cease and desist order with the Autorité de Contrôle et de Prudentiel et de Résolution (ACPR), the home country supervisor of BNP Paribas. The cease and desist order requires BNP Paribas to implement a program to ensure global compliance with U.S. sanctions laws. BNP Paribas continues to operate branches in New York, Chicago, and San Francisco, and an agency in Houston, all of which are covered by the enhanced policies and procedures required by the order.
These actions are taken in conjunction with actions by the Asset Forfeiture and Money Laundering Section of the Criminal Division of the Department of Justice, the Office of the U.S. Attorney for the Southern District of New York, the United States Department of Treasury’s Office of Foreign Assets Control (OFAC), the New York County District Attorney’s Office, and the New York Department of Financial Services for violations of U.S. sanctions laws and various New York State laws. The assessments issued by the agencies, including the Federal Reserve, total $8.9736 billion.
Holy Smokes! Government Motors is getting hammered!
GM Canada’s market share in the Greater Toronto Area plunged more than 50 per cent between 2008 and 2013, hitting just 5.6 per cent last year, according to the suit by 17 Toronto-area dealers. The list of dealers includes operators of some of the biggest GM dealerships in the country and some whose relationship with the company goes back to the 1920s.
…
Each of the Toronto area dealers reported new vehicle sales last year that were their lowest in the 2010-2013 period, and several of them are unprofitable, the statement of claim says.
The suit noted that GM Canada has more dealers in the Greater Toronto Area than any other manufacturer except Chrysler Canada Inc., and its dealers sold the smallest number of new vehicles of any of the major auto makers in the Canadian market.
GM dealers in the Toronto area sold an average of 531 vehicles last year, compared with 1,194 for the average Honda Canada Inc. dealer – a number that leads the market. Chrysler dealers sold 721 vehicles on average.
The BIS Annual Report includes a section titled Debt and the financial cycle: domestic and global:
Signals are mixed for advanced economies that did not see an outright crisis in recent years. Australia, Canada and the Nordic countries experienced large financial booms in the mid- to late 2000s. But the global and European debt crises dented these dynamics; asset prices fluctuated widely and corporate borrowing fell as global economic activity deteriorated. This pushed the medium-term financial cycle indicator on a downward trend, even though households in all these economies continued to borrow, albeit at a slower pace. But the strong increase in commodity prices in recent years prevented a lasting turn of the cycle, and over the last four quarters real property price and (total) credit growth in Australia and Canada has picked up to levels close to or in line with developments in large EMEs.
…
Credit-to-GDP gaps in many EMEs and Switzerland are well above the threshold that indicates potential trouble (Table IV.1). The historical record shows that credit-to-GDP gaps (the difference between the credit-to-GDP ratio and its long-term trend) above 10 percentage points have usually been followed by serious banking strains within three years.5 Residential property price gaps (the deviation of real residential property prices from their long-term trend) also point to risks: they tend to build up during a credit boom and fall two to three years before a crisis. Indeed, the Swiss authorities have reacted to the build-up of financial vulnerabilities by increasing countercyclical capital buffer requirements from 1% to 2% of risk-weighted positions secured by domestic residential property.
Debt service ratios send a less worrying signal. These ratios, which measure the share of income used to service debt (Box IV.B), remain low in many economies. Taken at face value, they suggest that borrowers in China are currently especially vulnerable. But rising rates would push debt service ratios in several other economies into critical territory (Table IV.1, last column). To illustrate, assume that money market rates rise by 250 basis points, in line with the 2004 tightening episode.6 At constant credit-to-GDP ratios, this would push debt service ratios in most of the booming economies above critical thresholds. Experience indicates that debt service ratios tend to remain low for long periods, only to shoot up rapidly one or two years before a crisis, typically in response to interest rate increases.7 Low values therefore do not necessarily mean that the financial system is safe.
There’s a really poorly produced table attached to the report as a JPG, which is just a blur to these old eyes. Interestingly, they also hint that regulation of asset allocation might be … convenient:
Finally, the sheer volume of assets managed by large asset management companies implies that their asset allocation decisions have significant and systemic implications for EME financial markets. For instance, a relatively small (5 percentage point) reallocation of the $70 trillion in assets managed by large asset management companies from advanced economies to EMEs would result in additional portfolio flows of $3.5 trillion. This is equivalent to 13% of the $27 trillion stock of EME bonds and equities. And the ratio could be significantly larger in smaller open economies. Actions taken by asset managers have particularly strong effects if they are correlated across funds. This could be because of top-down management of different portfolios, as is the case for some major bond funds, similar benchmarks or similar risk management systems (Chapter VI).
Can’t wait.
The Canadian preferred share market closed the quarter on a strong note, with PerpetualDiscounts winning 38bp, FixedResets up 11bp and DeemedRetractibles gaining 2bp. Volatility was above average, dominated by winners. Volume was pathetic, since those of us in the highest paid profession on earth can’t be bothered to show up for work immediately prior to a holiday; this gives us more time to sneer at the laziness of bartenders, waitresses and shop clerks.
HIMIPref™ Preferred Indices
These values reflect the December 2008 revision of the HIMIPref™ Indices
Values are provisional and are finalized monthly |
| Index |
Mean
Current
Yield
(at bid) |
Median
YTW |
Median
Average
Trading
Value |
Median
Mod Dur
(YTW) |
Issues |
Day’s Perf. |
Index Value |
| Ratchet |
0.00 % |
0.00 % |
0 |
0.00 |
0 |
-0.0690 % |
2,528.4 |
| FixedFloater |
4.32 % |
3.59 % |
30,348 |
18.16 |
1 |
0.0000 % |
3,978.1 |
| Floater |
2.90 % |
2.98 % |
44,480 |
19.77 |
4 |
-0.0690 % |
2,730.0 |
| OpRet |
4.36 % |
-15.90 % |
21,363 |
0.09 |
2 |
0.1943 % |
2,721.1 |
| SplitShare |
4.69 % |
4.26 % |
56,637 |
3.16 |
6 |
0.0324 % |
3,124.2 |
| Interest-Bearing |
0.00 % |
0.00 % |
0 |
0.00 |
0 |
0.1943 % |
2,488.2 |
| Perpetual-Premium |
5.52 % |
-2.05 % |
81,127 |
0.08 |
17 |
0.0439 % |
2,416.8 |
| Perpetual-Discount |
5.25 % |
5.15 % |
113,432 |
15.07 |
20 |
0.3793 % |
2,567.3 |
| FixedReset |
4.43 % |
3.59 % |
200,643 |
6.66 |
78 |
0.1074 % |
2,556.5 |
| Deemed-Retractible |
4.98 % |
0.78 % |
138,344 |
0.09 |
43 |
0.0167 % |
2,545.8 |
| FloatingReset |
2.67 % |
2.24 % |
124,913 |
3.92 |
6 |
0.1120 % |
2,506.9 |
| Performance Highlights |
| Issue |
Index |
Change |
Notes |
| HSB.PR.D |
Deemed-Retractible |
-1.32 % |
YTW SCENARIO
Maturity Type : Call
Maturity Date : 2014-07-30
Maturity Price : 25.25
Evaluated at bid price : 25.50
Bid-YTW : -6.93 % |
| ELF.PR.H |
Perpetual-Discount |
1.01 % |
YTW SCENARIO
Maturity Type : Call
Maturity Date : 2021-04-17
Maturity Price : 25.00
Evaluated at bid price : 25.00
Bid-YTW : 5.49 % |
| BAM.PR.X |
FixedReset |
1.02 % |
YTW SCENARIO
Maturity Type : Limit Maturity
Maturity Date : 2044-06-30
Maturity Price : 22.27
Evaluated at bid price : 22.73
Bid-YTW : 3.86 % |
| POW.PR.D |
Perpetual-Discount |
1.08 % |
YTW SCENARIO
Maturity Type : Limit Maturity
Maturity Date : 2044-06-30
Maturity Price : 24.02
Evaluated at bid price : 24.30
Bid-YTW : 5.15 % |
| FTS.PR.H |
FixedReset |
1.08 % |
YTW SCENARIO
Maturity Type : Limit Maturity
Maturity Date : 2044-06-30
Maturity Price : 21.44
Evaluated at bid price : 21.44
Bid-YTW : 3.58 % |
| HSE.PR.A |
FixedReset |
1.10 % |
YTW SCENARIO
Maturity Type : Limit Maturity
Maturity Date : 2044-06-30
Maturity Price : 22.64
Evaluated at bid price : 23.01
Bid-YTW : 3.66 % |
| Volume Highlights |
| Issue |
Index |
Shares
Traded |
Notes |
| RY.PR.I |
FixedReset |
95,365 |
TD crossed blocks of 24,400 and 50,000, both at 25.30.
YTW SCENARIO
Maturity Type : Call
Maturity Date : 2019-02-24
Maturity Price : 25.00
Evaluated at bid price : 25.30
Bid-YTW : 3.33 % |
| BAM.PF.F |
FixedReset |
79,400 |
Nesbitt crossed blocks of 50,000 and 22,000, both at 25.40.
YTW SCENARIO
Maturity Type : Call
Maturity Date : 2019-09-30
Maturity Price : 25.00
Evaluated at bid price : 25.41
Bid-YTW : 4.24 % |
| BNS.PR.P |
FixedReset |
51,840 |
TD crossed 50,000 at 25.24.
YTW SCENARIO
Maturity Type : Call
Maturity Date : 2018-04-25
Maturity Price : 25.00
Evaluated at bid price : 25.21
Bid-YTW : 3.04 % |
| ENB.PF.C |
FixedReset |
32,935 |
Nesbitt crossed 22,800 at 25.20.
YTW SCENARIO
Maturity Type : Limit Maturity
Maturity Date : 2044-06-30
Maturity Price : 23.19
Evaluated at bid price : 25.21
Bid-YTW : 4.12 % |
| RY.PR.H |
FixedReset |
30,800 |
Recent new issue.
YTW SCENARIO
Maturity Type : Limit Maturity
Maturity Date : 2044-06-30
Maturity Price : 23.26
Evaluated at bid price : 25.33
Bid-YTW : 3.66 % |
| BMO.PR.K |
Deemed-Retractible |
27,062 |
TD crossed 26,000 at 26.12.
YTW SCENARIO
Maturity Type : Call
Maturity Date : 2014-07-30
Maturity Price : 25.75
Evaluated at bid price : 26.10
Bid-YTW : -5.21 % |
| There were 5 other index-included issues trading in excess of 10,000 shares. |
| Wide Spread Highlights |
| Issue |
Index |
Quote Data and Yield Notes |
| PWF.PR.A |
Floater |
Quote: 19.82 – 20.39
Spot Rate : 0.5700
Average : 0.4320
YTW SCENARIO
Maturity Type : Limit Maturity
Maturity Date : 2044-06-30
Maturity Price : 19.82
Evaluated at bid price : 19.82
Bid-YTW : 2.67 % |
| BNS.PR.C |
FloatingReset |
Quote: 25.26 – 25.50
Spot Rate : 0.2400
Average : 0.1597
YTW SCENARIO
Maturity Type : Hard Maturity
Maturity Date : 2022-01-31
Maturity Price : 25.00
Evaluated at bid price : 25.26
Bid-YTW : 2.56 % |
| ELF.PR.F |
Perpetual-Discount |
Quote: 24.10 – 24.33
Spot Rate : 0.2300
Average : 0.1823
YTW SCENARIO
Maturity Type : Limit Maturity
Maturity Date : 2044-06-30
Maturity Price : 23.85
Evaluated at bid price : 24.10
Bid-YTW : 5.50 % |
| ENB.PR.N |
FixedReset |
Quote: 24.95 – 25.11
Spot Rate : 0.1600
Average : 0.1133
YTW SCENARIO
Maturity Type : Limit Maturity
Maturity Date : 2044-06-30
Maturity Price : 23.19
Evaluated at bid price : 24.95
Bid-YTW : 4.07 % |
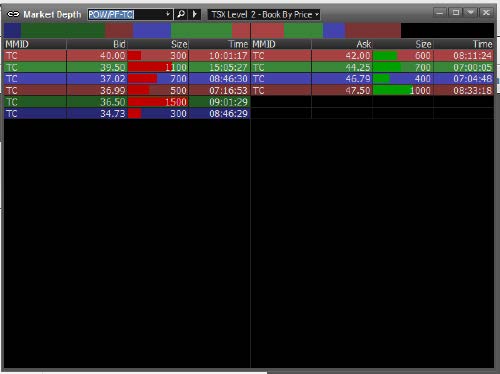
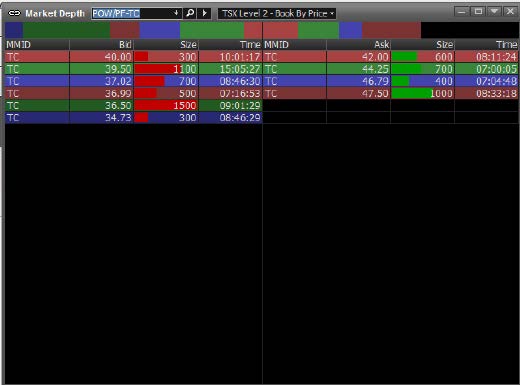
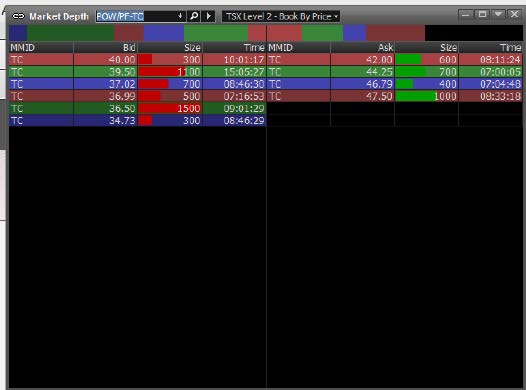
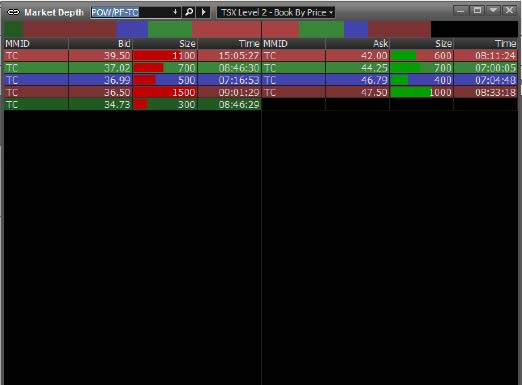
| W.PR.H |
Perpetual-Premium |
Quote: 25.01 – 25.36
Spot Rate : 0.3500
Average : 0.3045
YTW SCENARIO
Maturity Type : Call
Maturity Date : 2014-07-30
Maturity Price : 25.00
Evaluated at bid price : 25.01
Bid-YTW : 2.27 % |
| VNR.PR.A |
FixedReset |
Quote: 25.68 – 25.87
Spot Rate : 0.1900
Average : 0.1468
YTW SCENARIO
Maturity Type : Call
Maturity Date : 2017-10-15
Maturity Price : 25.00
Evaluated at bid price : 25.68
Bid-YTW : 3.78 % |