Archive for December, 2014

AZP.PR.B / AZP.PR.C Conversion Results Known, Maybe

Wednesday, December 31st, 2014

Atlantic Power can’t be bothered to issue a press release or otherwise indicate on their website just what the results of the recent conversion option were, but there is information available on TMXMoney, maybe.

According to the TMX Money page for AZP.PR.C (the FloatingReset), there are 1,661,906 shares outstanding. They are reporting 2,338,094 AZP.PR.B outstanding, which miraculously (considering it’s the Toronto Stock Exchange doing the reporting) adds up to the 4-million EPP.PR.B issued in 2009, which became CZP.PR.B, which became AZP.PR.B.

So that’s a conversion rate of about 42%. In my post just before the decision deadline, I recommended conversion.

FFH.PR.C / FFH.PR.D Conversion Results Known, Maybe

Wednesday, December 31st, 2014

Fairfax can’t be bothered to issue a press release or otherwise indicate on their website just what the results of the recent conversion option were, but there is information available on TMXMoney, maybe.

According to the TMX Money page for FFH.PR.D (the FloatingReset), there are 3,983,616 shares outstanding. They are still reporting 10-million FFH.PR.C outstanding, which was the amount outstanding prior to conversion, but we’ll just assume that, well, you know, Toronto Stock Exchange.

So that’s a conversion rate of about 40%. In my post just before the decision deadline, I recommended conversion.

TRP.PR.A / TRP.PR.F Conversion Results Announced

Wednesday, December 31st, 2014

TransCanada Corporation has announced:

that 12,501,577 of its 22,000,000 fixed rate Cumulative Redeemable First Preferred Shares, Series 1 (Series 1 Shares) were tendered for conversion today, on a one-for-one basis into floating-rate Cumulative Redeemable First Preferred Shares, Series 2 (Series 2 Shares). As a result of the conversion TransCanada has 9,498,423 Series 1 Shares and 12,501,577 Series 2 Shares issued and outstanding. The Series 1 Shares will continue to be listed on the Toronto Stock Exchange (TSX) under the symbol TRP.PR.A. The Series 2 Shares will begin trading on the TSX today under the symbol TRP.PR.F

The Series 1 Shares will continue to pay on a quarterly basis, for the five-year period beginning on December 31, 2014, as and when declared by the Board of Directors of TransCanada, a fixed dividend based on an annual fixed dividend rate of 3.266 per cent.

The Series 2 Shares will pay a floating quarterly dividend for the five-year period beginning on December 31, 2014, as and when declared by the Board of Directors of TransCanada. The floating quarterly dividend rate for the Series 2 Shares for the first quarterly floating rate period (being the period from December 31, 2014 to but excluding March 31, 2015) is 2.815 per cent and will be reset every quarter.

For more information on the terms of, and risks associated with an investment in, the Series 1 Shares and the Series 2 Shares, please see the Corporation’s prospectus supplement dated September 22, 2009 which can be found under the Corporation’s profile on SEDAR at www.sedar.com.

So both the FixedReset TRP.PR.A, with 9.5-million shares outstanding, and the FloatingReset TRP.PR.F (12.5-million) are good-sized, liquid issues, which is a good result for trading purposes.

In my post immediately before the conversion deadline, I had recommended conversion to the FloatingReset, TRP.PR.F.

December 30, 2014

Wednesday, December 31st, 2014

Kevin Carmichael of the Centre for International Governance Innovation writes a piece in the Globe titled Canada’s monetary authority lacks American commitment to transparency:

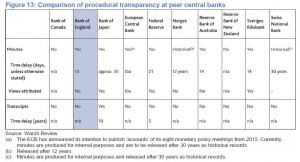
The Bank of Canada believes transcripts and minutes would degrade the quality of debate by making policy makers conscious of an external audience. There also is a belief that since the Governing Council exists by convention, and that it is the governor who is responsible for monetary policy under the Bank of Canada Act, an official record of the policy committee’s meetings is unnecessary. “There are no votes; instead, the Governing Council works toward a consensus viewpoint,” Rebeca Ryall, a media relations officer at the Bank of Canada, said in an e-mail. “This process allows for a frank discussion where Governing Council members are free to challenge one another and push the boundaries of the debate in order to arrive at a decision they are all comfortable with.”

In other words, the members of Governing Council are such pathetic little twerps they will burst into tears if they are contradicted in public. Though I will admit there are other possibilities: the meetings either don’t happen at all, or are closely supervised by a few functionaries from the Ministry of Finance casually wielding rubber hoses.

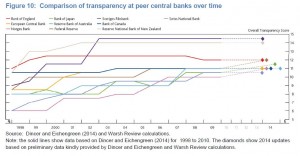
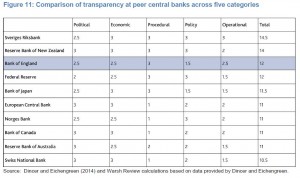
Mr. Carmichael’s article references a paper by Kevin Warsh titled Transparency and the Bank of England’s Monetary Policy Committee which includes the following three charts:

centralBankTransparencyTrend
Click For Big

centralBankTransparencyScoring
Click For Big

centralBankTransparencyProcedural
Click For Big

I will be pleased to concede that the scoring is highly subjective and I will also cheerfully admit that it will be very difficult to prove to a determined skeptic that transparency is a good proxy or predictor for quality of the Bank’s decisions or the effectiveness of its implementation of policy.

After all, the main reason for transparency is to improve the public’s confidence in, and ability to predict the future course of, the process. If, for instance, one section of the minutes, released after three weeks, were to include the statement “If housing prices go up any more we’re gonna have to kick some ass (growls of approbation)“, then I suggest that would probably count as pretty good jawboning and result in very good transmission of monetary policy – particularly should housing prices go up, followed by a 50bp hike in policy rates at the next meeting.

And, given that the Bank of Canada is out of step with its peers (ranking just above the bottom on the current scoring, whereas in 1998 it ranked just below the top), I suggest that the onus of explanation for the variance from international trends is now with the Bank. If they’ve got a better reason for secrecy than cowardice and total lack of intellectual talent, let’s hear it.

Anyway, Assiduous Readers will recognize this as a long-term PrefBlog gripe, last voiced October 30, 2014, when the CDHowe Institute advocated the publication of minutes with particular emphasis on disclosure of dissenting views.

A reliable source advises me that 12,501,577 shares (of 22-million outstanding, or 57%) of TRP.PR.A have been converted to TRP.PR.F, its corresponding FloatingReset. I can’t confirm this on the company site, SEDAR, or the TSX site as yet, but will issue a full post when the company decides to let its investors know what’s going on.

It was a mixed day for the Canadian preferred share market, with PerpetualDiscounts off 5bp, FixedResets gaining 15bp and DeemedRetractibles flat. Volatility continued to be both high and dominated by familiar issues, with ENB issues prominent on the upside, continuing a recovery from the probably credit induced downturn experienced earlier this month. Volume was many adjectives low.

For as long as the FixedReset market is so violently unsettled, I’ll keep publishing updates of the more interesting and meaningful series of FixedResets’ Implied Volatilities. This doesn’t include Enbridge because although Enbridge has a large number of issues outstanding, all of which are quite liquid, the range of Issue Reset Spreads is too small for decent conclusions. The low is 212bp (ENB.PR.H; second-lowest is ENB.PR.D at 237bp) and the high is a mere 268 for ENB.PF.G.

Remember that all rich /cheap assessments are:
» based on Implied Volatility Theory only
» are relative only to other FixedResets from the same issuer
» assume constant GOC-5 yield
» assume constant Implied Volatility
» assume constant spread

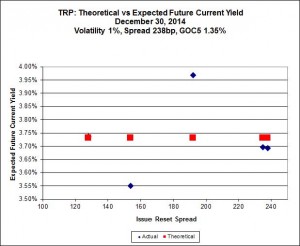
Here’s TRP:

impVol_TRP_141230
Click for Big

So according to this, TRP.PR.A, bid at 20.58, is $1.36 cheap, but it has already reset (at +192). TRP.PR.C, bid at 20.35 and resetting at +154bp on 2016-1-30 is $0.98 rich.

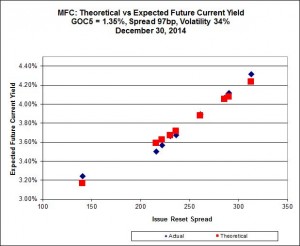
impVol_MFC_141230
Click for Big

MFC.PR.F has wandered off into its own little cheap world again, bid at 21.30 to be $0.50 cheap according to the calculation. It resets 2016-6-19 at +141bp. Implied Volatility continues to be a conundrum. It is far too high if we consider that NVCC rules will never apply to these issues; it is still too low if we consider them to be NVCC non-compliant issues (and therefore with Deemed Maturities in the call schedule).

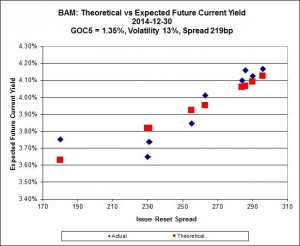
impVol_BAM_141230
Click for Big

There continues to be cheapness in the lowest-spread issue, BAM.PR.X, resetting at +180bp on 2017-6-30, which is bid at 20.99 and appears to be $0.72 cheap, while BAM.PR.R, resetting at +230bp 2016-6-30 is bid at 25.00 and appears to be $1.10 rich.

It seems clear that the higher-spread issues define a curve with significantly more Implied Volatility than is calculated when the low-spread outlier is included.

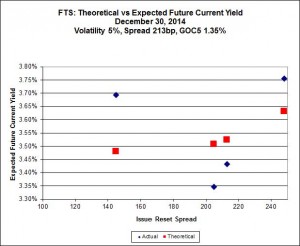
impVol_FTS_141230
Click for Big

This is just weird because the middle is expensive and the ends are cheap but anyway … FTS.PR.H, with a spread of +145bp, and bid at 18.95, looks $1.16 cheap and resets 2015-6-1. FTS.PR.K, with a spread of +205bp, and bid at 25.40, looks $1.17 expensive and resets 2019-3-1

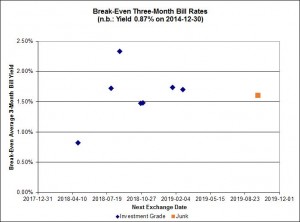
pairs_FR_141230
Click for Big

The average break-even rate has declined from 1.80%-2.00% at the time recent conversion decisions were made to a current very wide range of (mostly) 1.50%-1.70%. This decline means that the estimated profit on TRP.PR.A conversion has declined from $0.48 to a mere $0.16 (at the lower end of the range, 1.50%).

HIMIPref™ Preferred Indices
These values reflect the December 2008 revision of the HIMIPref™ Indices

Values are provisional and are finalized monthly
Index Mean
Current
Yield
(at bid)
Median
YTW
Median
Average
Trading
Value
Median
Mod Dur
(YTW)
Issues Day’s Perf. Index Value
Ratchet 0.00 % 0.00 % 0 0.00 0 0.2439 % 2,522.2
FixedFloater 0.00 % 0.00 % 0 0.00 0 0.2439 % 3,993.2
Floater 3.01 % 3.09 % 64,530 19.48 4 0.2439 % 2,681.3
OpRet 4.41 % -2.45 % 23,304 0.08 2 0.0000 % 2,752.0
SplitShare 4.26 % 3.82 % 35,583 3.67 5 0.1600 % 3,207.3
Interest-Bearing 0.00 % 0.00 % 0 0.00 0 0.0000 % 2,516.4
Perpetual-Premium 5.45 % -4.62 % 67,395 0.08 20 -0.0118 % 2,488.5
Perpetual-Discount 5.17 % 5.06 % 107,827 15.32 15 -0.0538 % 2,667.9
FixedReset 4.20 % 3.59 % 239,893 8.34 77 0.1462 % 2,556.8
Deemed-Retractible 4.95 % 0.27 % 91,755 0.16 40 -0.0010 % 2,627.9
FloatingReset 2.55 % 1.89 % 63,753 3.41 5 0.2435 % 2,551.4
Performance Highlights
Issue Index Change Notes
MFC.PR.F FixedReset -1.97 % YTW SCENARIO
Maturity Type : Hard Maturity
Maturity Date : 2025-01-31
Maturity Price : 25.00
Evaluated at bid price : 21.91
Bid-YTW : 4.61 %
FTS.PR.J Perpetual-Discount -1.90 % YTW SCENARIO
Maturity Type : Limit Maturity
Maturity Date : 2044-12-30
Maturity Price : 23.85
Evaluated at bid price : 24.25
Bid-YTW : 4.93 %
GWO.PR.H Deemed-Retractible -1.42 % YTW SCENARIO
Maturity Type : Hard Maturity
Maturity Date : 2025-01-31
Maturity Price : 25.00
Evaluated at bid price : 24.35
Bid-YTW : 5.21 %
GWO.PR.P Deemed-Retractible -1.35 % YTW SCENARIO
Maturity Type : Hard Maturity
Maturity Date : 2025-01-31
Maturity Price : 25.00
Evaluated at bid price : 25.65
Bid-YTW : 5.10 %
TRP.PR.E FixedReset -1.33 % YTW SCENARIO
Maturity Type : Limit Maturity
Maturity Date : 2044-12-30
Maturity Price : 23.24
Evaluated at bid price : 25.21
Bid-YTW : 3.69 %
CU.PR.D Perpetual-Discount -1.21 % YTW SCENARIO
Maturity Type : Limit Maturity
Maturity Date : 2044-12-30
Maturity Price : 24.06
Evaluated at bid price : 24.48
Bid-YTW : 5.04 %
RY.PR.L FixedReset -1.17 % YTW SCENARIO
Maturity Type : Call
Maturity Date : 2019-02-24
Maturity Price : 25.00
Evaluated at bid price : 26.21
Bid-YTW : 3.13 %
ENB.PF.G FixedReset 1.02 % YTW SCENARIO
Maturity Type : Limit Maturity
Maturity Date : 2044-12-30
Maturity Price : 23.00
Evaluated at bid price : 24.65
Bid-YTW : 4.16 %
MFC.PR.C Deemed-Retractible 1.03 % YTW SCENARIO
Maturity Type : Hard Maturity
Maturity Date : 2025-01-31
Maturity Price : 25.00
Evaluated at bid price : 23.58
Bid-YTW : 5.28 %
ENB.PR.Y FixedReset 1.03 % YTW SCENARIO
Maturity Type : Limit Maturity
Maturity Date : 2044-12-30
Maturity Price : 21.97
Evaluated at bid price : 22.46
Bid-YTW : 4.27 %
HSE.PR.A FixedReset 1.13 % YTW SCENARIO
Maturity Type : Limit Maturity
Maturity Date : 2044-12-30
Maturity Price : 21.54
Evaluated at bid price : 21.54
Bid-YTW : 3.74 %
MFC.PR.B Deemed-Retractible 1.17 % YTW SCENARIO
Maturity Type : Hard Maturity
Maturity Date : 2025-01-31
Maturity Price : 25.00
Evaluated at bid price : 24.30
Bid-YTW : 5.06 %
ENB.PR.J FixedReset 1.17 % YTW SCENARIO
Maturity Type : Limit Maturity
Maturity Date : 2044-12-30
Maturity Price : 22.93
Evaluated at bid price : 24.20
Bid-YTW : 4.15 %
BAM.PR.M Perpetual-Discount 1.17 % YTW SCENARIO
Maturity Type : Limit Maturity
Maturity Date : 2044-12-30
Maturity Price : 21.55
Evaluated at bid price : 21.55
Bid-YTW : 5.55 %
BAM.PF.C Perpetual-Discount 1.18 % YTW SCENARIO
Maturity Type : Limit Maturity
Maturity Date : 2044-12-30
Maturity Price : 21.44
Evaluated at bid price : 21.44
Bid-YTW : 5.70 %
IAG.PR.A Deemed-Retractible 1.23 % YTW SCENARIO
Maturity Type : Hard Maturity
Maturity Date : 2025-01-31
Maturity Price : 25.00
Evaluated at bid price : 23.95
Bid-YTW : 5.17 %
ENB.PF.E FixedReset 1.24 % YTW SCENARIO
Maturity Type : Limit Maturity
Maturity Date : 2044-12-30
Maturity Price : 22.92
Evaluated at bid price : 24.40
Bid-YTW : 4.20 %
ELF.PR.F Perpetual-Discount 1.33 % YTW SCENARIO
Maturity Type : Limit Maturity
Maturity Date : 2044-12-30
Maturity Price : 24.64
Evaluated at bid price : 24.90
Bid-YTW : 5.33 %
ENB.PF.C FixedReset 1.38 % YTW SCENARIO
Maturity Type : Limit Maturity
Maturity Date : 2044-12-30
Maturity Price : 22.84
Evaluated at bid price : 24.18
Bid-YTW : 4.23 %
ENB.PR.P FixedReset 1.39 % YTW SCENARIO
Maturity Type : Limit Maturity
Maturity Date : 2044-12-30
Maturity Price : 22.52
Evaluated at bid price : 23.35
Bid-YTW : 4.18 %
ENB.PR.D FixedReset 1.44 % YTW SCENARIO
Maturity Type : Limit Maturity
Maturity Date : 2044-12-30
Maturity Price : 22.58
Evaluated at bid price : 23.27
Bid-YTW : 4.08 %
ENB.PR.T FixedReset 1.45 % YTW SCENARIO
Maturity Type : Limit Maturity
Maturity Date : 2044-12-30
Maturity Price : 22.36
Evaluated at bid price : 23.08
Bid-YTW : 4.24 %
ENB.PR.N FixedReset 1.62 % YTW SCENARIO
Maturity Type : Limit Maturity
Maturity Date : 2044-12-30
Maturity Price : 22.77
Evaluated at bid price : 23.80
Bid-YTW : 4.21 %
ENB.PR.B FixedReset 1.72 % YTW SCENARIO
Maturity Type : Limit Maturity
Maturity Date : 2044-12-30
Maturity Price : 22.58
Evaluated at bid price : 23.11
Bid-YTW : 4.14 %
GWO.PR.R Deemed-Retractible 1.81 % YTW SCENARIO
Maturity Type : Hard Maturity
Maturity Date : 2025-01-31
Maturity Price : 25.00
Evaluated at bid price : 24.74
Bid-YTW : 4.96 %
ENB.PR.F FixedReset 2.17 % YTW SCENARIO
Maturity Type : Limit Maturity
Maturity Date : 2044-12-30
Maturity Price : 22.70
Evaluated at bid price : 23.55
Bid-YTW : 4.15 %
TRP.PR.B FixedReset 2.67 % YTW SCENARIO
Maturity Type : Limit Maturity
Maturity Date : 2044-12-30
Maturity Price : 17.70
Evaluated at bid price : 17.70
Bid-YTW : 3.84 %
TRP.PR.C FixedReset 4.37 % YTW SCENARIO
Maturity Type : Limit Maturity
Maturity Date : 2044-12-30
Maturity Price : 21.01
Evaluated at bid price : 21.01
Bid-YTW : 3.57 %
Volume Highlights
Issue Index Shares
Traded
Notes
CM.PR.P FixedReset 129,200 Recent new issue.
YTW SCENARIO
Maturity Type : Limit Maturity
Maturity Date : 2044-12-30
Maturity Price : 23.11
Evaluated at bid price : 24.86
Bid-YTW : 3.58 %
TD.PF.C FixedReset 79,440 Recent new issue.
YTW SCENARIO
Maturity Type : Limit Maturity
Maturity Date : 2044-12-30
Maturity Price : 23.13
Evaluated at bid price : 24.92
Bid-YTW : 3.58 %
BAM.PF.C Perpetual-Discount 17,755 RBC crossed 10,000 at 21.45.
YTW SCENARIO
Maturity Type : Limit Maturity
Maturity Date : 2044-12-30
Maturity Price : 21.44
Evaluated at bid price : 21.44
Bid-YTW : 5.70 %
TRP.PR.C FixedReset 15,100 YTW SCENARIO
Maturity Type : Limit Maturity
Maturity Date : 2044-12-30
Maturity Price : 21.01
Evaluated at bid price : 21.01
Bid-YTW : 3.57 %
HSE.PR.C FixedReset 14,300 YTW SCENARIO
Maturity Type : Call
Maturity Date : 2019-12-31
Maturity Price : 25.00
Evaluated at bid price : 25.26
Bid-YTW : 4.35 %
BMO.PR.J Deemed-Retractible 12,170 YTW SCENARIO
Maturity Type : Call
Maturity Date : 2015-02-25
Maturity Price : 25.25
Evaluated at bid price : 25.75
Bid-YTW : -5.34 %
There were 6 other index-included issues trading in excess of 10,000 shares.
Wide Spread Highlights
Issue Index Quote Data and Yield Notes
GWO.PR.H Deemed-Retractible Quote: 24.35 – 24.95
Spot Rate : 0.6000
Average : 0.3944

YTW SCENARIO
Maturity Type : Hard Maturity
Maturity Date : 2025-01-31
Maturity Price : 25.00
Evaluated at bid price : 24.35
Bid-YTW : 5.21 %

FTS.PR.J Perpetual-Discount Quote: 24.25 – 24.80
Spot Rate : 0.5500
Average : 0.3638

YTW SCENARIO
Maturity Type : Limit Maturity
Maturity Date : 2044-12-30
Maturity Price : 23.85
Evaluated at bid price : 24.25
Bid-YTW : 4.93 %

MFC.PR.F FixedReset Quote: 21.91 – 22.38
Spot Rate : 0.4700
Average : 0.3026

YTW SCENARIO
Maturity Type : Hard Maturity
Maturity Date : 2025-01-31
Maturity Price : 25.00
Evaluated at bid price : 21.91
Bid-YTW : 4.61 %

GWO.PR.P Deemed-Retractible Quote: 25.65 – 26.10
Spot Rate : 0.4500
Average : 0.2936

YTW SCENARIO
Maturity Type : Hard Maturity
Maturity Date : 2025-01-31
Maturity Price : 25.00
Evaluated at bid price : 25.65
Bid-YTW : 5.10 %

RY.PR.L FixedReset Quote: 26.21 – 26.55
Spot Rate : 0.3400
Average : 0.2103

YTW SCENARIO
Maturity Type : Call
Maturity Date : 2019-02-24
Maturity Price : 25.00
Evaluated at bid price : 26.21
Bid-YTW : 3.13 %

CU.PR.D Perpetual-Discount Quote: 24.48 – 24.90
Spot Rate : 0.4200
Average : 0.2929

YTW SCENARIO
Maturity Type : Limit Maturity
Maturity Date : 2044-12-30
Maturity Price : 24.06
Evaluated at bid price : 24.48
Bid-YTW : 5.04 %

FCS.PR.C Settles Firm On Good Volume

Wednesday, December 31st, 2014

Faircourt Asset Management has announced (although not yet on their websit):

Faircourt Asset Management Inc., the manager of Faircourt Split Trust (the “Trust”) (TSX: FCS.UN; FCS.PR.B), is pleased to announce that the Trust has completed a public offering (the “Offering”) of 1,500,000 6.00% preferred securities due June 30, 2019 (the “Preferred Securities”) at a price of $10.00 per Preferred Security. The Offering raised gross proceeds of $15,000,000.

The Preferred Securities commence trading today on the Toronto Stock Exchange under the symbol “FCS.PR.C”.

The syndicate of agents for the Offering was co-led by National Bank Financial Inc. and CIBC, and includes Canaccord Genuity Corp., GMP Securities L.P. and Raymond James Ltd.

The net proceeds of the Offering of Preferred Securities will be used to fund the redemption of the 6.25% preferred securities of the Trust which mature on December 31, 2014 (the “6.25% Preferred Securities”). As the Offering has been completed without any matched Preferred Securities and trust units of the Trust being issued, there are insufficient proceeds to fully repay the aggregate principal amount of the outstanding 6.25% Preferred Securities (the “6.25% Outstanding Principal”) from the proceeds of the Offering. The balance of the 6.25% Outstanding Principal will be funded by the Trust through cash currently held by the Trust and the sale of securities from the portfolio of securities held by the Trust. Payment of the 6.25% Outstanding Principal will be made to holders of the 6.25 Preferred Securities in accordance with the provisions of the trust indenture and first supplemental indenture governing the 6.25% Preferred Securities.

For further information about the Offering, please contact: Faircourt Asset Management Inc. at (416) 364-8989 or 1-800-831-0304 or visit our website at www.faircourtassetmgt.com.

This issue has been rated Pfd-3(low) by DBRS:

The Trust has advised DBRS that the initial downside protection available to holders of the 6.00% Preferred Securities is expected to be approximately 36.7% after the payment of all issuance expenses. The downside protection is provided by the Trust Units. Dividends received on the Portfolio will be used to pay a fixed cumulative quarterly distribution to holders of the 6.00% Preferred Securities, while holders of the Trust Units are expected to receive a monthly distribution of $0.02. Based on the current dividend yield on the Portfolio as of December 17, 2014, the 6.00% Preferred Securities dividend coverage ratio is expected to be approximately 0.02 times.

According to the terms of the Trust’s Declaration of Trust, the Trust has the ability to borrow up to 10% of Total Assets (as defined in the Declaration of Trust) under a loan facility in order to meet its investment objectives. Under the terms of the Company’s Trust Indenture, the loan facility is considered Senior Indebtedness, and all amounts owing under the loan facility will be paid in priority to the 6.00% Preferred Securities. There is currently no loan facility in place and therefore, there are currently no amounts owing under a loan facility; however, to the extent that the Trust borrows under a loan facility, the rating on the 6.00% Preferred Securities could be negatively impacted. DBRS will continue to monitor the situation in connection with the ongoing surveillance of the rating on the 6.00% Preferred Securities, and will take appropriate ratings action as necessary.

The DBRS release is largely a copy-paste of their provisional release reported on PrefBlog.

FCS.PR.C will be tracked by HIMIPref™ but assigned to the Scraps index on credit concerns.

There are two items of particular interest in the prospectus, which Faircourt cannot be bothered to publish on their website and which is available on SEDAR via “Faircourt Split Trust Dec 22 2014 12:50:39 ET Final short form prospectus – English PDF 382 K”. A direct link is not permitted because the Alberta Securities Commission does not believe retail scum should have convenient access to public documents.

Asset Coverage Test

The Trust Indenture and the Declaration of Trust provide that the Trust may not make any cash distributions on the Units if, after giving effect to the proposed distribution, the Total Assets less the amount outstanding under the Loan Facility equals less than 1.4 times the principal amount of the 6.00% Preferred Securities then outstanding.

Redemption of 6.00% Preferred Securities by the Trust

6.00% Preferred Securities may be redeemed in whole or in part by the Trust upon notice to 6.00% Preferred Securityholders in accordance with the Trust Indenture at any time that the aggregate principal amount outstanding of the 6.00% Preferred Securities exceeds 40% of the Total Assets. All 6.00% Preferred Securities then outstanding will be redeemed by the Trust at maturity or immediately prior to the termination of the Trust, if earlier. The 6.00% Preferred Securities would, in any such case, be redeemed at par, plus any accrued but unpaid interest.

So that’s a NAV Test of 1.4x, inferior to the more usual 1.5x; given that the 36.7% downside protection referred to by DBRS (quoted above) is Asset Coverage of only 1.6-:1, Faircourt might have felt that there wasn’t enough danger space available with a 1.5x NAV Test.

The other highly significant item is that these shares can be redeemed at any time at par; there’s no capital gains potential for these shares at all given current conditions and in general a little more symmetricallity in potential returns is preferred. It will be noted in the vital statistics, below, that the YTW scenario after its first day of trading in an immediate call.

The issue traded 76,995 shares today (consolidated exchanges) in a range of 9.99-09 before closing at 10.01-05. Vital statistics are:

FCS.PR.C Interest-Bearing YTW SCENARIO
Maturity Type : Call
Maturity Date : 2015-01-29
Maturity Price : 10.00
Evaluated at bid price : 10.01
Bid-YTW : 4.62 %

December 29, 2014

Tuesday, December 30th, 2014

With all the idiotically mandated bonus deferrals, we’re going to see a lot more of this:

Bank of America Corp. maliciously fired a distressed-debt banker to deprive her of a bonus, a Hong Kong judge ruled, awarding Sunny Tadjudin $500,000 after a seven-year legal battle.

Tadjudin’s manager, John Liptak, was determined to fire her despite her improvement in a performance plan, and his malice can be attributed to the bank, High Court Judge Anthony To said in a 141-page ruling issued yesterday. Still, Tadjudin will receive only a fraction of the amount she requested.

Tadjudin, 51, who worked for the bank’s Asian distressed-debt trading group, had sought bonuses totaling $3.7 million after being fired in 2007 following what she said were irrational and arbitrary performance ratings. To ruled against her claims for higher 2005 and 2006 bonuses than she received.

In Canada, of course, we have the example of Scotiabank and David Berry. There is some speculation he will get his due:

How much, if any, of Bank of Nova Scotia’s $55 million legal charge is related to Dave Berry’s $100 million law suit?

Two days back the Bank of Nova Scotia surprised the markets with news that it would be taking a series of charges in the fourth quarter of its recently completed fiscal year. In all there were $451 million of pre-tax charges, which converts to $341 million on an after tax-basis.

One item has attracted particular attention: “Thirdly, the Bank expects to record a legal charge of approximately $55 million related to certain ongoing legal claims in multiple business lines.”

Could that item be related to the $100 million lawsuit filed by David Berry, the bank’s former head of preferred share trading who was terminated more than nine years ago? Berry’s lawsuit – which is slated to trial next year – alleges wrongful dismissal.

The suit also alleges that his termination – at the time he was the highest paid employee at the bank earning a percentage of the profits made by his group – “was the result of blame-shifting, corporate self interest or greed on the part of Scotia Capital and its inadequate internal compliance, training and education procedures.”

It certainly would be nice if those sleaze-bags and ignoramuses at Scotia did the right thing … even ten years later and after umpteen hearings.

The Greek Tragedy is being revived, but there is much less excitement this time:

Investor reaction to the Greek parliament’s failure to pick a president traced the familiar north-south divide. Greek stocks and bonds plunged and markets were buffeted in Italy, Portugal and Spain, while funds flowed into Germany, Europe’s biggest economy and hard-money bastion.

Yet look closer and Italy, the euro zone’s second most-indebted country after Greece, is nowhere near a fiscal calamity. Ten-year borrowing costs are hovering around 2 percent, compared to over 7 percent at the height of the crisis. Bond holders are charging Italy 144 basis points more than Germany to borrow, a far cry from 553 basis points in November 2011.

There were echoes of 2012 in Europe’s political reaction. Back then, German Finance Minister Wolfgang Schaeuble said “we cannot force Greece” to press on with the budget cuts needed to stay in the euro zone, while a German then on the ECB board, Joerg Asmussen, said there was “no alternative” to austerity.

Schaeuble reprised that line in a statement yesterday, saying that tough reforms in Greece were bearing fruit and “they are without any alternative.” Germany will support Greece on its path of reform, he said, though “if Greece chooses a different way, it will become difficult.”

When Greece hurtled toward bankruptcy in early 2010, the European Union had no way of helping countries in need. When Greece toyed with quitting the euro in late 2011, and held a stalemated election in May 2012 before Samaras put together a unity government after a second election six weeks later, it had only a temporary bailout fund.

Now, it has a full-time aid fund in the 500 billion-euro European Stability Mechanism and a central bank tiptoeing — amid opposition from Germany — toward large-scale bond purchases. It also boasts success stories: Ireland, Portugal and Spain have been weaned off financial aid.

The risk is less a splintering of the 18-nation euro zone – – it will become 19 on Jan. 1 when Lithuania joins — than a protracted phase of subpar economic growth that leaves a generation scarred by unemployment and tempted by political extremism, especially in the south.

The trend in robo-advising is getting a boost:

But Wealthsimple, a Toronto startup, is taking the concept [of on-line investing] in precisely the opposite direction. It’s using the Internet as a way to offer up investing that’s not only cheap to manage, but algorithmically steady, safe, and predictable.

The ten-person firm’s idea is to use technology both to cut out the costs of offering traditional investment advice, and to be more agile in automatically managing portfolios. New customers fill out a questionnaire, and are then paired with a certified investment advisor, who works remotely and is available by text, phone, or video chat. (The firm’s one concession to startup trendiness is its insistence on calling its advisors “wealth concierges.”)

The operation is, as far as I can tell, an ETF allocator:

We charge an annual management fee of 0.35-0.50% of assets depending on your account balance. That’s approximately ⅓ the cost of typical advisors in Canada. The only other fee you incur is the very low fee embedded in the investment products in your portfolio (averages is 0.25%) and currency conversion. We have negotiated preferred pricing on both ETF prices and currency of more than 50% and passed along all of those savings to our clients.

Wealthsimple’s management fee covers transactions, rebalancing, advice, and account administration.

Well, it’s bound to come at some point – particularly if trailer fees get banned – but it remains to be seen whether there’s a mass-market comprised of people who don’t mind actually cutting a cheque for their advice. I admit to being a little suspicious of their market timing aspirations:

While we don’t believe in picking stocks or timing the market, we do believe in a thoughtful approach to risks. In the context of the current market environment, there are two primary risks we consider:
•Interest rates
•Market volatility

For the past 30 years, bond investors have been well rewarded as interest rates steadily declined to historic lows (when interest rates go down, bond prices go up). Looking forward, interest rates cannot get much lower. But what will they do?

Interest rate uncertainty carries lots of risk for bond investors. As a result, we use alternatives to bonds wherever possible. For example, we use real estate and dividend stocks which generate income like bonds, but are not as linked to interest rates. We also use a real estate product that is specifically designed to minimize the risk of interest rate uncertainty.

Which brings to mind the question of whether BRICS is actually an asset class or not:

While Chinese and Indian benchmark equity indexes have surged an average 40 percent this year, Russian and Brazilian gauges posted a mean drop of 4.2 percent. The annual divergence is on pace for the biggest since economist Jim O’Neill coined the term in 2001, leaving the combined market capitalization of Chinese and Indian equities $5.2 trillion larger than that of Russia and Brazil, according to data compiled by Bloomberg.

At the time BRIC was coined it was useful to describe the broad and increasing importance of the four largest emerging-market economies, but it was never suitable as an investing concept,” Mark Gordon-James, a senior investment manager at Aberdeen Asset Management, which managed $526 billion at the end of September, said in an interview on Dec. 18 from London.

But worry not! The marketers will soon find another bandwagon!

It was a mixed day for the Canadian preferred share market, with PerpetualDiscounts gaining 8bp, FixedResets rocketing up 55bp and DeemedRetractibles off 7bp. The Performance Highlights table is suitably lengthy, notable for a high proportion of FixedReset winners, particularly in the names that were hit hard in the early part of the month – ENB, TRP & HSE. But all this was on volume that was pathetically, horribly, awfully, grossly, incredibly low.

For as long as the FixedReset market is so violently unsettled, I’ll keep publishing updates of the more interesting and meaningful series of FixedResets’ Implied Volatilities. This doesn’t include Enbridge because although Enbridge has a large number of issues outstanding, all of which are quite liquid, the range of Issue Reset Spreads is too small for decent conclusions. The low is 212bp (ENB.PR.H; second-lowest is ENB.PR.D at 237bp) and the high is a mere 268 for ENB.PF.G.

Remember that all rich /cheap assessments are:

  • based on Implied Volatility Theory only
  • are relative only to other FixedResets from the same issuer
  • assume constant GOC-5 yield
  • assume constant Implied Volatility
  • assume constant spread

Here’s TRP:

impVol_TRP_141229
Click for Big

So according to this, TRP.PR.A, bid at 20.58, is $1.36 cheap, but it has already reset (at +192). TRP.PR.D, bid at 25.34 and resetting at +238bp on 2019-4-30 is $0.34 rich and TRP.PR.E, bid at 25.55 and resetting at +235bp on 2019-10-30 (two months prior to the next TRP.PR.A reset), is $0.75 rich.

impVol_MFC_141229
Click for Big

There is an excellent fit to theory for the MFC issues, but Implied Volatility continues to be a conundrum. It is far too high if we consider that NVCC rules will never apply to these issues; it is still too low if we consider them to be NVCC non-compliant issues (and therefore with Deemed Maturities in the call schedule).

impVol_BAM_141229
Click for Big

There continues to be cheapness in the lowest-spread issue, BAM.PR.X, resetting at +180bp on 2017-6-30, which is bid at 21.00 and appears to be $0.84 cheap, while BAM.PR.R, resetting at +230bp 2016-6-30 is bid at 25.25 and appears to be $1.19 rich.

It seems clear that the higher-spread issues define a curve with significantly more Implied Volatility than is calculated when the low-spread outlier is included.

impVol_FTS_141229
Click for Big

This is just weird because the middle is expensive and the ends are cheap but anyway … FTS.PR.H, with a spread of +145bp, and bid at 18.95, looks $1.15 cheap and resets 2015-6-1. FTS.PR.K, with a spread of +205bp, and bid at 25.40, looks $1.12 expensive and resets 2019-3-1

pairsFR_141229
Click for Big

The average break-even rate has declined from 1.80%-2.00% at the time recent conversion decisions were made to a current very wide range of (mostly) 1.40%-1.80%. This decline means that the estimated profit on TRP.PR.A conversion has declined from $0.48 to a mere $0.06 (at the lower end of the range, 1.40%).

HIMIPref™ Preferred Indices
These values reflect the December 2008 revision of the HIMIPref™ Indices

Values are provisional and are finalized monthly
Index Mean
Current
Yield
(at bid)
Median
YTW
Median
Average
Trading
Value
Median
Mod Dur
(YTW)
Issues Day’s Perf. Index Value
Ratchet 0.00 % 0.00 % 0 0.00 0 -0.0717 % 2,516.1
FixedFloater 0.00 % 0.00 % 0 0.00 0 -0.0717 % 3,983.5
Floater 3.01 % 3.11 % 65,003 19.44 4 -0.0717 % 2,674.8
OpRet 4.41 % -2.14 % 23,257 0.08 2 0.0784 % 2,752.0
SplitShare 4.27 % 4.04 % 35,851 3.68 5 0.0991 % 3,202.2
Interest-Bearing 0.00 % 0.00 % 0 0.00 0 0.0784 % 2,516.4
Perpetual-Premium 5.45 % -3.90 % 69,028 0.08 20 0.2034 % 2,488.8
Perpetual-Discount 5.16 % 5.04 % 110,633 15.34 15 0.0760 % 2,669.3
FixedReset 4.21 % 3.58 % 243,931 8.37 77 0.5527 % 2,553.0
Deemed-Retractible 4.95 % 0.70 % 92,530 0.16 40 -0.0660 % 2,627.9
FloatingReset 2.56 % 1.93 % 63,553 3.41 5 -0.0785 % 2,545.2
Performance Highlights
Issue Index Change Notes
GWO.PR.R Deemed-Retractible -1.70 % YTW SCENARIO
Maturity Type : Hard Maturity
Maturity Date : 2025-01-31
Maturity Price : 25.00
Evaluated at bid price : 24.30
Bid-YTW : 5.19 %
MFC.PR.B Deemed-Retractible -1.36 % YTW SCENARIO
Maturity Type : Hard Maturity
Maturity Date : 2025-01-31
Maturity Price : 25.00
Evaluated at bid price : 24.02
Bid-YTW : 5.20 %
MFC.PR.C Deemed-Retractible -1.35 % YTW SCENARIO
Maturity Type : Hard Maturity
Maturity Date : 2025-01-31
Maturity Price : 25.00
Evaluated at bid price : 23.34
Bid-YTW : 5.41 %
PWF.PR.A Floater -1.28 % YTW SCENARIO
Maturity Type : Limit Maturity
Maturity Date : 2044-12-29
Maturity Price : 19.25
Evaluated at bid price : 19.25
Bid-YTW : 2.75 %
POW.PR.D Perpetual-Discount -1.06 % YTW SCENARIO
Maturity Type : Limit Maturity
Maturity Date : 2044-12-29
Maturity Price : 24.05
Evaluated at bid price : 24.30
Bid-YTW : 5.15 %
ENB.PR.D FixedReset 1.06 % YTW SCENARIO
Maturity Type : Limit Maturity
Maturity Date : 2044-12-29
Maturity Price : 22.38
Evaluated at bid price : 22.94
Bid-YTW : 4.15 %
GWO.PR.N FixedReset 1.06 % YTW SCENARIO
Maturity Type : Hard Maturity
Maturity Date : 2025-01-31
Maturity Price : 25.00
Evaluated at bid price : 20.92
Bid-YTW : 4.88 %
ENB.PR.Y FixedReset 1.18 % YTW SCENARIO
Maturity Type : Limit Maturity
Maturity Date : 2044-12-29
Maturity Price : 21.81
Evaluated at bid price : 22.23
Bid-YTW : 4.32 %
ENB.PF.A FixedReset 1.21 % YTW SCENARIO
Maturity Type : Limit Maturity
Maturity Date : 2044-12-29
Maturity Price : 22.89
Evaluated at bid price : 24.25
Bid-YTW : 4.22 %
ENB.PF.G FixedReset 1.29 % YTW SCENARIO
Maturity Type : Limit Maturity
Maturity Date : 2044-12-29
Maturity Price : 22.91
Evaluated at bid price : 24.40
Bid-YTW : 4.21 %
ENB.PR.T FixedReset 1.29 % YTW SCENARIO
Maturity Type : Limit Maturity
Maturity Date : 2044-12-29
Maturity Price : 22.16
Evaluated at bid price : 22.75
Bid-YTW : 4.31 %
TRP.PR.B FixedReset 1.29 % YTW SCENARIO
Maturity Type : Limit Maturity
Maturity Date : 2044-12-29
Maturity Price : 17.24
Evaluated at bid price : 17.24
Bid-YTW : 3.94 %
ELF.PR.G Perpetual-Discount 1.30 % YTW SCENARIO
Maturity Type : Limit Maturity
Maturity Date : 2044-12-29
Maturity Price : 22.57
Evaluated at bid price : 22.86
Bid-YTW : 5.19 %
ENB.PR.N FixedReset 1.34 % YTW SCENARIO
Maturity Type : Limit Maturity
Maturity Date : 2044-12-29
Maturity Price : 22.58
Evaluated at bid price : 23.42
Bid-YTW : 4.30 %
PWF.PR.P FixedReset 1.38 % YTW SCENARIO
Maturity Type : Limit Maturity
Maturity Date : 2044-12-29
Maturity Price : 21.30
Evaluated at bid price : 21.30
Bid-YTW : 3.66 %
MFC.PR.L FixedReset 1.40 % YTW SCENARIO
Maturity Type : Call
Maturity Date : 2019-06-19
Maturity Price : 25.00
Evaluated at bid price : 25.40
Bid-YTW : 3.56 %
ENB.PF.E FixedReset 1.47 % YTW SCENARIO
Maturity Type : Limit Maturity
Maturity Date : 2044-12-29
Maturity Price : 22.80
Evaluated at bid price : 24.10
Bid-YTW : 4.26 %
IFC.PR.A FixedReset 1.57 % YTW SCENARIO
Maturity Type : Hard Maturity
Maturity Date : 2025-01-31
Maturity Price : 25.00
Evaluated at bid price : 22.60
Bid-YTW : 4.70 %
ENB.PR.F FixedReset 1.59 % YTW SCENARIO
Maturity Type : Limit Maturity
Maturity Date : 2044-12-29
Maturity Price : 22.42
Evaluated at bid price : 23.05
Bid-YTW : 4.26 %
ENB.PR.H FixedReset 1.59 % YTW SCENARIO
Maturity Type : Limit Maturity
Maturity Date : 2044-12-29
Maturity Price : 21.11
Evaluated at bid price : 21.11
Bid-YTW : 4.32 %
BAM.PF.D Perpetual-Discount 1.65 % YTW SCENARIO
Maturity Type : Limit Maturity
Maturity Date : 2044-12-29
Maturity Price : 21.24
Evaluated at bid price : 21.52
Bid-YTW : 5.71 %
ENB.PR.B FixedReset 1.66 % YTW SCENARIO
Maturity Type : Limit Maturity
Maturity Date : 2044-12-29
Maturity Price : 22.33
Evaluated at bid price : 22.72
Bid-YTW : 4.22 %
TRP.PR.C FixedReset 1.77 % YTW SCENARIO
Maturity Type : Limit Maturity
Maturity Date : 2044-12-29
Maturity Price : 20.13
Evaluated at bid price : 20.13
Bid-YTW : 3.73 %
TRP.PR.D FixedReset 1.91 % YTW SCENARIO
Maturity Type : Call
Maturity Date : 2019-04-30
Maturity Price : 25.00
Evaluated at bid price : 25.34
Bid-YTW : 3.58 %
MFC.PR.F FixedReset 2.01 % YTW SCENARIO
Maturity Type : Hard Maturity
Maturity Date : 2025-01-31
Maturity Price : 25.00
Evaluated at bid price : 22.35
Bid-YTW : 4.37 %
TRP.PR.E FixedReset 2.04 % YTW SCENARIO
Maturity Type : Limit Maturity
Maturity Date : 2044-12-29
Maturity Price : 23.35
Evaluated at bid price : 25.55
Bid-YTW : 3.62 %
ENB.PR.P FixedReset 2.04 % YTW SCENARIO
Maturity Type : Limit Maturity
Maturity Date : 2044-12-29
Maturity Price : 22.35
Evaluated at bid price : 23.03
Bid-YTW : 4.25 %
TRP.PR.A FixedReset 2.29 % YTW SCENARIO
Maturity Type : Limit Maturity
Maturity Date : 2044-12-29
Maturity Price : 20.58
Evaluated at bid price : 20.58
Bid-YTW : 4.06 %
HSE.PR.A FixedReset 4.36 % YTW SCENARIO
Maturity Type : Limit Maturity
Maturity Date : 2044-12-29
Maturity Price : 21.30
Evaluated at bid price : 21.30
Bid-YTW : 3.78 %
Volume Highlights
Issue Index Shares
Traded
Notes
TD.PF.C FixedReset 59,200 Recent new issue.
YTW SCENARIO
Maturity Type : Limit Maturity
Maturity Date : 2044-12-29
Maturity Price : 23.14
Evaluated at bid price : 24.95
Bid-YTW : 3.57 %
CM.PR.P FixedReset 28,300 Recent new issue.
YTW SCENARIO
Maturity Type : Limit Maturity
Maturity Date : 2044-12-29
Maturity Price : 23.12
Evaluated at bid price : 24.89
Bid-YTW : 3.58 %
BMO.PR.T FixedReset 22,200 YTW SCENARIO
Maturity Type : Limit Maturity
Maturity Date : 2044-12-29
Maturity Price : 23.26
Evaluated at bid price : 25.23
Bid-YTW : 3.55 %
MFC.PR.F FixedReset 19,700 YTW SCENARIO
Maturity Type : Hard Maturity
Maturity Date : 2025-01-31
Maturity Price : 25.00
Evaluated at bid price : 22.35
Bid-YTW : 4.37 %
TD.PF.A FixedReset 16,895 YTW SCENARIO
Maturity Type : Limit Maturity
Maturity Date : 2044-12-29
Maturity Price : 23.33
Evaluated at bid price : 25.51
Bid-YTW : 3.51 %
TD.PF.B FixedReset 14,440 YTW SCENARIO
Maturity Type : Limit Maturity
Maturity Date : 2044-12-29
Maturity Price : 23.32
Evaluated at bid price : 25.41
Bid-YTW : 3.53 %
There were 1 other index-included issues trading in excess of 10,000 shares.
Wide Spread Highlights
Issue Index Quote Data and Yield Notes
TD.PR.R Deemed-Retractible Quote: 26.21 – 26.84
Spot Rate : 0.6300
Average : 0.3819

YTW SCENARIO
Maturity Type : Call
Maturity Date : 2015-01-28
Maturity Price : 25.75
Evaluated at bid price : 26.21
Bid-YTW : -5.46 %

MFC.PR.B Deemed-Retractible Quote: 24.02 – 24.60
Spot Rate : 0.5800
Average : 0.3506

YTW SCENARIO
Maturity Type : Hard Maturity
Maturity Date : 2025-01-31
Maturity Price : 25.00
Evaluated at bid price : 24.02
Bid-YTW : 5.20 %

GWO.PR.R Deemed-Retractible Quote: 24.30 – 24.82
Spot Rate : 0.5200
Average : 0.3365

YTW SCENARIO
Maturity Type : Hard Maturity
Maturity Date : 2025-01-31
Maturity Price : 25.00
Evaluated at bid price : 24.30
Bid-YTW : 5.19 %

MFC.PR.C Deemed-Retractible Quote: 23.34 – 23.79
Spot Rate : 0.4500
Average : 0.3131

YTW SCENARIO
Maturity Type : Hard Maturity
Maturity Date : 2025-01-31
Maturity Price : 25.00
Evaluated at bid price : 23.34
Bid-YTW : 5.41 %

RY.PR.F Deemed-Retractible Quote: 25.67 – 26.04
Spot Rate : 0.3700
Average : 0.2388

YTW SCENARIO
Maturity Type : Call
Maturity Date : 2015-05-24
Maturity Price : 25.25
Evaluated at bid price : 25.67
Bid-YTW : 1.27 %

ENB.PR.J FixedReset Quote: 23.92 – 24.30
Spot Rate : 0.3800
Average : 0.2515

YTW SCENARIO
Maturity Type : Limit Maturity
Maturity Date : 2044-12-29
Maturity Price : 22.80
Evaluated at bid price : 23.92
Bid-YTW : 4.21 %

December 24, 2014

Wednesday, December 24th, 2014

S&P has Russia on Watch-Negative:

S&P said in its statement that there’s at least a 50 percent chance that Russia’s rating will be lowered to junk within 90 days as it put the country on negative credit watch. Moody’s Investors Service and Fitch Ratings rank Russia one step higher than S&P, which lowered its rating one level in April to BBB-.

The move “stems from what we view as a rapid deterioration of Russia’s monetary flexibility and the impact of the weakening economy on its financial system,” S&P said. The ratings company expects to conclude its review in mid-January. The ruble held its gains after the S&P announcement yesterday, suggesting investors have already priced in the possibility of credit downgrades.

Gross domestic product may shrink as much as 4.7 percent next year, the most since 2009, should a “stress scenario” eventuate where oil averages $60 a barrel, the central bank said Dec. 15. Net capital outflows may have more than doubled this year to $134 billion.

In October, Moody’s cut Russia’s credit rating by one level to its second-lowest investment grade, citing concerns over the impact of sanctions on the economy. The continued erosion of Russia’s foreign-exchange reserves because of capital flight, low oil prices and borrowers’ lack of access to credit were also cited by Moody’s.

Christmas came early for Canadian preferred share investors, the market rocketed upwards with PerpetualDiscounts winning 70bp, FixedResets gained 37bp and DeemedRetractibles were up 50bp in a session that was foreshortened so that members of the highest paid profession on earth could stand around complaining about the inferior work ethic of minimum wage waiters and shop clerks. The Performance Highlights table is suitably gigantic; volume, however, was quite low.

PerpetualDiscounts now yield 5.05%, equivalent to 6.56% interest at the standard equivalency factor of 1.3x. Long corporates now yield about 4.1% so the pre-tax interest-equivalent spread (in this context, the Seniority Spread) is now about 245bp, a very sharp narrowing from the 270bp reported December 17.

For as long as the FixedReset market is so violently unsettled, I’ll keep publishing updates of the more interesting and meaningful series of FixedResets’ Implied Volatilities. This doesn’t include Enbridge because although Enbridge has a large number of issues outstanding, all of which are quite liquid, the range of Issue Reset Spreads is too small for decent conclusions. The low is 212bp (ENB.PR.H; second-lowest is ENB.PR.D at 237bp) and the high is a mere 268 for ENB.PF.G.

Remember that all rich /cheap assessments are:

  • based on Implied Volatility Theory only
  • are relative only to other FixedResets from the same issuer
  • assume constant GOC-5 yield
  • assume constant Implied Volatility
  • assume constant spread

Here’s TRP:

impVol_TRP_141224
Click for Big

So according to this, TRP.PR.A, bid at 20.12, is $1.59 cheap, but it has already reset (at +192). TRP.PR.D, bid at 25.11 and resetting at +238bp on 2019-4-30 is $0.43 rich and TRP.PR.E, bid at 25.30 and resetting at +235bp on 2019-10-30 (two months prior to the next TRP.PR.A reset), is $0.82 rich.

impVol_MFC_141224
Click for Big

There is an excellent fit to theory for the MFC issues, but Implied Volatility continues to be a conundrum. It is far too high if we consider that NVCC rules will never apply to these issues; it is far too low if we consider them to be NVCC non-compliant issues (and therefore with Deemed Maturities in the call schedule).

impVol_BAM_141224
Click for Big

There continues to be cheapness in the lowest-spread issue, BAM.PR.X, resetting at +180bp on 2017-6-30, which is bid at 20.83 after another day of excellent performance and appears to be $0.82 cheap, while BAM.PR.R, resetting at +230bp 2016-6-30 is bid at 25.19 and appears to be $1.24 rich.

It will be noticed that due to price changes in issues other than BAM.PR.X, this issue gained over a point and yet became cheaper to the rest; additionally, it seems clear that the higher-spread issues define a curve with significantly more Implied Volatility than is calculated when the low-spread outlier is included.

impVol_FTS_141224
Click for Big

This is just weird because the middle is expensive and the ends are cheap but anyway … FTS.PR.H, with a spread of +145bp, and bid at 18.77, looks $1.24 cheap and resets 2015-6-1. FTS.PR.K, with a spread of +205bp, and bid at 25.15, looks $1.04 expensive and resets 2019-3-1

pairsFR_141224
Click for Big
Click for Big

The average break-even rate has declined from 1.80%-2.00% at the time recent conversion decisions were made to a current cluster of (mostly) 1.50%-1.65%. This decline means that the estimated profit on TRP.PR.A conversion has declined from $0.48 to a mere $0.16 (at the lower end of the range, 1.50%).

HIMIPref™ Preferred Indices
These values reflect the December 2008 revision of the HIMIPref™ Indices

Values are provisional and are finalized monthly
Index Mean
Current
Yield
(at bid)
Median
YTW
Median
Average
Trading
Value
Median
Mod Dur
(YTW)
Issues Day’s Perf. Index Value
Ratchet 0.00 % 0.00 % 0 0.00 0 -0.1574 % 2,517.9
FixedFloater 0.00 % 0.00 % 0 0.00 0 -0.1574 % 3,986.3
Floater 3.01 % 3.12 % 65,755 19.42 4 -0.1574 % 2,676.7
OpRet 4.41 % -3.39 % 24,220 0.08 2 -0.0196 % 2,749.9
SplitShare 4.28 % 4.08 % 35,850 3.69 5 0.0713 % 3,199.0
Interest-Bearing 0.00 % 0.00 % 0 0.00 0 -0.0196 % 2,514.5
Perpetual-Premium 5.44 % -3.29 % 71,137 0.08 20 0.1610 % 2,483.7
Perpetual-Discount 5.16 % 5.05 % 109,250 15.38 15 0.6970 % 2,667.3
FixedReset 4.23 % 3.58 % 245,785 8.58 77 0.3659 % 2,539.0
Deemed-Retractible 4.95 % -0.68 % 96,125 0.11 40 0.4981 % 2,629.6
FloatingReset 2.56 % 1.92 % 63,660 3.43 5 0.4177 % 2,547.2
Performance Highlights
Issue Index Change Notes
SLF.PR.G FixedReset -2.02 % YTW SCENARIO
Maturity Type : Hard Maturity
Maturity Date : 2025-01-31
Maturity Price : 25.00
Evaluated at bid price : 21.36
Bid-YTW : 4.67 %
PWF.PR.P FixedReset -1.22 % YTW SCENARIO
Maturity Type : Limit Maturity
Maturity Date : 2044-12-24
Maturity Price : 21.01
Evaluated at bid price : 21.01
Bid-YTW : 3.68 %
BAM.PR.K Floater -1.01 % YTW SCENARIO
Maturity Type : Limit Maturity
Maturity Date : 2044-12-24
Maturity Price : 16.66
Evaluated at bid price : 16.66
Bid-YTW : 3.15 %
IAG.PR.A Deemed-Retractible -1.00 % YTW SCENARIO
Maturity Type : Hard Maturity
Maturity Date : 2025-01-31
Maturity Price : 25.00
Evaluated at bid price : 23.71
Bid-YTW : 5.28 %
BAM.PR.N Perpetual-Discount 1.04 % YTW SCENARIO
Maturity Type : Limit Maturity
Maturity Date : 2044-12-24
Maturity Price : 21.42
Evaluated at bid price : 21.42
Bid-YTW : 5.58 %
ENB.PR.J FixedReset 1.06 % YTW SCENARIO
Maturity Type : Limit Maturity
Maturity Date : 2044-12-24
Maturity Price : 22.72
Evaluated at bid price : 23.75
Bid-YTW : 4.22 %
BAM.PF.F FixedReset 1.07 % YTW SCENARIO
Maturity Type : Call
Maturity Date : 2019-09-30
Maturity Price : 25.00
Evaluated at bid price : 25.60
Bid-YTW : 3.95 %
GWO.PR.L Deemed-Retractible 1.09 % YTW SCENARIO
Maturity Type : Call
Maturity Date : 2015-01-30
Maturity Price : 26.00
Evaluated at bid price : 26.08
Bid-YTW : 1.37 %
BAM.PR.X FixedReset 1.12 % YTW SCENARIO
Maturity Type : Limit Maturity
Maturity Date : 2044-12-24
Maturity Price : 20.83
Evaluated at bid price : 20.83
Bid-YTW : 4.04 %
RY.PR.L FixedReset 1.14 % YTW SCENARIO
Maturity Type : Call
Maturity Date : 2019-02-24
Maturity Price : 25.00
Evaluated at bid price : 26.53
Bid-YTW : 2.80 %
ENB.PF.C FixedReset 1.19 % YTW SCENARIO
Maturity Type : Limit Maturity
Maturity Date : 2044-12-24
Maturity Price : 22.67
Evaluated at bid price : 23.78
Bid-YTW : 4.29 %
BAM.PF.B FixedReset 1.20 % YTW SCENARIO
Maturity Type : Limit Maturity
Maturity Date : 2044-12-24
Maturity Price : 23.32
Evaluated at bid price : 25.30
Bid-YTW : 3.87 %
IAG.PR.G FixedReset 1.22 % YTW SCENARIO
Maturity Type : Call
Maturity Date : 2017-06-30
Maturity Price : 25.00
Evaluated at bid price : 26.52
Bid-YTW : 1.79 %
MFC.PR.B Deemed-Retractible 1.29 % YTW SCENARIO
Maturity Type : Hard Maturity
Maturity Date : 2025-01-31
Maturity Price : 25.00
Evaluated at bid price : 24.35
Bid-YTW : 5.02 %
GWO.PR.P Deemed-Retractible 1.29 % YTW SCENARIO
Maturity Type : Call
Maturity Date : 2020-03-31
Maturity Price : 25.25
Evaluated at bid price : 25.88
Bid-YTW : 4.81 %
SLF.PR.A Deemed-Retractible 1.44 % YTW SCENARIO
Maturity Type : Hard Maturity
Maturity Date : 2025-01-31
Maturity Price : 25.00
Evaluated at bid price : 24.67
Bid-YTW : 4.93 %
PWF.PR.R Perpetual-Premium 1.44 % YTW SCENARIO
Maturity Type : Call
Maturity Date : 2021-04-30
Maturity Price : 25.00
Evaluated at bid price : 26.02
Bid-YTW : 4.92 %
SLF.PR.D Deemed-Retractible 1.64 % YTW SCENARIO
Maturity Type : Hard Maturity
Maturity Date : 2025-01-31
Maturity Price : 25.00
Evaluated at bid price : 23.56
Bid-YTW : 5.21 %
SLF.PR.E Deemed-Retractible 1.68 % YTW SCENARIO
Maturity Type : Hard Maturity
Maturity Date : 2025-01-31
Maturity Price : 25.00
Evaluated at bid price : 23.64
Bid-YTW : 5.22 %
SLF.PR.C Deemed-Retractible 1.72 % YTW SCENARIO
Maturity Type : Hard Maturity
Maturity Date : 2025-01-31
Maturity Price : 25.00
Evaluated at bid price : 23.65
Bid-YTW : 5.16 %
GWO.PR.G Deemed-Retractible 1.72 % YTW SCENARIO
Maturity Type : Call
Maturity Date : 2015-01-23
Maturity Price : 25.00
Evaluated at bid price : 25.38
Bid-YTW : -13.88 %
GWO.PR.R Deemed-Retractible 1.85 % YTW SCENARIO
Maturity Type : Hard Maturity
Maturity Date : 2025-01-31
Maturity Price : 25.00
Evaluated at bid price : 24.72
Bid-YTW : 4.96 %
CU.PR.D Perpetual-Discount 2.02 % YTW SCENARIO
Maturity Type : Limit Maturity
Maturity Date : 2044-12-24
Maturity Price : 24.34
Evaluated at bid price : 24.77
Bid-YTW : 4.97 %
CU.PR.E Perpetual-Discount 2.02 % YTW SCENARIO
Maturity Type : Limit Maturity
Maturity Date : 2044-12-24
Maturity Price : 24.33
Evaluated at bid price : 24.76
Bid-YTW : 4.97 %
BAM.PR.T FixedReset 2.02 % YTW SCENARIO
Maturity Type : Limit Maturity
Maturity Date : 2044-12-24
Maturity Price : 23.40
Evaluated at bid price : 24.69
Bid-YTW : 3.74 %
TRP.PR.C FixedReset 2.04 % YTW SCENARIO
Maturity Type : Limit Maturity
Maturity Date : 2044-12-24
Maturity Price : 20.05
Evaluated at bid price : 20.05
Bid-YTW : 3.78 %
GWO.PR.I Deemed-Retractible 2.06 % YTW SCENARIO
Maturity Type : Hard Maturity
Maturity Date : 2025-01-31
Maturity Price : 25.00
Evaluated at bid price : 23.75
Bid-YTW : 5.16 %
MFC.PR.F FixedReset 2.14 % YTW SCENARIO
Maturity Type : Hard Maturity
Maturity Date : 2025-01-31
Maturity Price : 25.00
Evaluated at bid price : 21.91
Bid-YTW : 4.57 %
HSE.PR.A FixedReset 2.31 % YTW SCENARIO
Maturity Type : Limit Maturity
Maturity Date : 2044-12-24
Maturity Price : 20.41
Evaluated at bid price : 20.41
Bid-YTW : 3.91 %
FTS.PR.J Perpetual-Discount 2.44 % YTW SCENARIO
Maturity Type : Limit Maturity
Maturity Date : 2044-12-24
Maturity Price : 24.32
Evaluated at bid price : 24.74
Bid-YTW : 4.82 %
Volume Highlights
Issue Index Shares
Traded
Notes
TD.PF.C FixedReset 63,650 Recent new issue.
YTW SCENARIO
Maturity Type : Limit Maturity
Maturity Date : 2044-12-24
Maturity Price : 23.13
Evaluated at bid price : 24.92
Bid-YTW : 3.55 %
MFC.PR.A OpRet 52,800 Scotia crossed 50,000 at 25.31.
YTW SCENARIO
Maturity Type : Call
Maturity Date : 2015-06-19
Maturity Price : 25.00
Evaluated at bid price : 25.27
Bid-YTW : 2.01 %
CM.PR.E Perpetual-Premium 28,773 Called for Redemption effective 2015-1-31.
YTW SCENARIO
Maturity Type : Call
Maturity Date : 2015-01-23
Maturity Price : 25.00
Evaluated at bid price : 24.98
Bid-YTW : -0.33 %
TRP.PR.A FixedReset 27,895 Resets to 3.266% effective Dec 31.
YTW SCENARIO
Maturity Type : Limit Maturity
Maturity Date : 2044-12-24
Maturity Price : 20.12
Evaluated at bid price : 20.12
Bid-YTW : 4.11 %
IAG.PR.E Deemed-Retractible 26,000 Called for redemption effective 2014-12-31.
YTW SCENARIO
Maturity Type : Call
Maturity Date : 2015-12-31
Maturity Price : 25.75
Evaluated at bid price : 25.99
Bid-YTW : 4.80 %
CM.PR.P FixedReset 25,588 Recent new issue.
YTW SCENARIO
Maturity Type : Limit Maturity
Maturity Date : 2044-12-24
Maturity Price : 23.12
Evaluated at bid price : 24.90
Bid-YTW : 3.55 %
There were 15 other index-included issues trading in excess of 10,000 shares.
Wide Spread Highlights
Issue Index Quote Data and Yield Notes
BAM.PF.E FixedReset Quote: 25.15 – 26.15
Spot Rate : 1.0000
Average : 0.5936

YTW SCENARIO
Maturity Type : Limit Maturity
Maturity Date : 2044-12-24
Maturity Price : 23.19
Evaluated at bid price : 25.15
Bid-YTW : 3.90 %

POW.PR.B Perpetual-Premium Quote: 25.02 – 25.39
Spot Rate : 0.3700
Average : 0.2475

YTW SCENARIO
Maturity Type : Call
Maturity Date : 2015-01-23
Maturity Price : 25.00
Evaluated at bid price : 25.02
Bid-YTW : 0.45 %

HSE.PR.C FixedReset Quote: 25.36 – 25.69
Spot Rate : 0.3300
Average : 0.2261

YTW SCENARIO
Maturity Type : Call
Maturity Date : 2019-12-31
Maturity Price : 25.00
Evaluated at bid price : 25.36
Bid-YTW : 4.24 %

PVS.PR.D SplitShare Quote: 24.35 – 24.63
Spot Rate : 0.2800
Average : 0.1848

YTW SCENARIO
Maturity Type : Hard Maturity
Maturity Date : 2021-10-08
Maturity Price : 25.00
Evaluated at bid price : 24.35
Bid-YTW : 5.02 %

TRP.PR.A FixedReset Quote: 20.12 – 20.48
Spot Rate : 0.3600
Average : 0.2666

YTW SCENARIO
Maturity Type : Limit Maturity
Maturity Date : 2044-12-24
Maturity Price : 20.12
Evaluated at bid price : 20.12
Bid-YTW : 4.11 %

POW.PR.A Perpetual-Premium Quote: 25.17 – 25.49
Spot Rate : 0.3200
Average : 0.2289

YTW SCENARIO
Maturity Type : Call
Maturity Date : 2015-01-23
Maturity Price : 25.00
Evaluated at bid price : 25.17
Bid-YTW : -6.65 %

December 23, 2014

Wednesday, December 24th, 2014

On December 19 my attention was drawn to a parallel between the Suez Crisis in 1956 and the current Ukraine Crisis. The Chinese provide a counter-parallel, assuming that’s a word:

China is stepping up its role as the lender of last resort to some of the world’s most financially strapped countries.

Chinese officials signaled on the weekend they are willing to expand a $24 billion currency swap program to help Russia weather the worst economic crisis since the 1998 default. China has provided $2.3 billion in funds to Argentina since October as part of a currency swap, and last month it lent $4 billion to Venezuela, whose reserves cover just two years of debt payments.

By lending to nations shut out of overseas capital markets, Chinese President Xi Jinping is bolstering the country’s influence in the global economy and cutting into the International Monetary Fund’s status as the go-to financier for governments in financial distress. While the IMF tends to demand reforms aimed at stabilizing a country’s economy in exchange for loans, analysts speculate that China’s terms are more focused on securing its interests in the resource-rich countries.

Today’s PrefBlog Movie Of The Week is:

Ukraine opened a criminal probe after several gold bars at the central bank’s storage in the southern city of Odessa turned to be painted lead.

“The management of the central bank’s branch in Odessa asked us to investigate fraud by their employee,” Volodymyr Shablienko, head of the Odessa police’s press office, said by phone today. “We are conducting a forensic audit now.”

A central bank employee passed lead bars covered with golden paint to the storage unit, registering them as gold, the Vesti newspaper reported today, citing an unidentified person with knowledge of the matter in Odessa’s police department.

Speaking of Russian, how about them banks, eh?:

After arresting a decline in the ruble, Russia is now trying to avert a banking crisis.

Lawmakers rushed legislation through the lower house of parliament today allowing the Deposit Insurance Agency to buy stakes in banks before they face bankruptcy proceedings to keep the system stable. While the ruble strengthened for a third day as the government told state-run exporters to sell foreign currency, it’s still down 30 percent in three months. Standard & Poor’s said today it may cut Russia’s credit rating to junk in part because of concern about the banking system.

The central bank put National Bank Trust, the country’s 15th-biggest based on retail deposits, under the control of the Deposit Insurance Agency yesterday. An investor will soon be selected to carry out the 30 billion-ruble ($550 million) rescue, the Bank of Russia said.

Trust, once part of exiled former oil tycoon Mikhail Khodorkovsky’s business empire, had a capital hole of tens of billions of rubles and lost more than 3 billion rubles in retail deposits last week, central bank Deputy Governor Mikhail Sukhov said yesterday. Bank of Russia’s press service confirmed his comments, earlier reported by the Interfax newswire.

And the Dow Jones Industrial Average is also pretty interesting:

The Dow Jones Industrial Average rose 5.6 percent over the past five days for the biggest rally since 2011, climbing to 18,024.17 yesterday, as the central bank pledged patience in raising interest rates while data showed the economy roared the most in the third quarter since 2003. A measure of expected volatility in the Dow has fallen the most in three years during the recent rally.

The Dow closed at a six-month low on Oct. 16 before rallying more than 1,882 points, or 12 percent, to top 18,000. The Chicago Board Options Exchange Dow Jones Industrial Average (INDU) Volatility Index, a measure of demand for options on the blue-chip stocks gauge, has bounced back after two jumps of more than 70 percent since September.

The industrial average has risen about 175 percent during the bull market that began in March 2009, propelled by better-than-estimated corporate results and three rounds of Fed bond purchases. The Standard & Poor’s 500 Index has more than tripled in that time. It rose 0.2 percent yesterday to finish at an all-time high.

The press might get interested in credit ratings again; e.g., Bloomberg:

One large company and four smaller firms didn’t follow their own methodologies in determining ratings, the SEC said in its report on Nationally Recognized Statistical Rating Organizations, or NRSROs.

After reviewing e-mails of one of the larger raters, the regulator determined that business and market-share conditions influenced the substance of its criteria. Employees on the business side of this rater worked in a concerted effort to change the criteria to appease an industry trade group, the SEC said.

OK, so let’s look at the relevant section in the actual staff report, titled 2014 SUMMARY REPORT OF COMMISSION STAFF’S EXAMINATIONS OF EACH NATIONALLY RECOGNIZED STATISTICAL RATING ORGANIZATION:

The Staff’s review of one larger NRSRO’s revisions to one of its rating criteria, including extensive review of its emails, suggests that this NRSRO’s business and market-share concerns influenced the substance of the criteria. Some of this NRSRO’s business personnel engaged in a concerted effort to address concerns raised by a trade association about this NRSRO’s contemplated revisions to the criteria report, and this criteria report was changed in a manner that addressed the business personnel’s concerns and was advantageous to the trade group. Also, documentation to support this change was lacking. The Staff recommended that this NRSRO enforce its policies and procedures and internal controls to separate the analytical process from commercial influence and ensure that the analytic justification of its criteria is adequately recorded and maintained. The Staff also recommended that this NRSRO’s Board retain an independent auditor, to be approved by OCR, to conduct a review of the development of the criteria and provide a written report summarizing the review to this NRSRO’s Board and compliance group as well as OCR.

It’s very difficult to see anything to be upset about here. First, the external body being dealt with was a trade group, not an individual company, which alleviates at least some of the automatic concerns right away (to a degree that can only be determined once we know how the trade group functions, for starters). Second, SEC Staff are shocked and horrified that the changes sought by the trade group are advantageous to the trade group. Well, yeah. Does anybody really expect anything else? Third, the criteria were changed in a manner that addressed the business personnel’s concerns … OK. Were the business personnel’s concerns grounded or ungrounded? Fourth, the documentation to support this change was lacking. Well, I can let you guys in on a little secret about regulatory paperwork: it’s always lacking. God and all his angels could not maintain records that would survive a determined fault-finding mission by regulators; not while doing any work of substance, anyway.

So the summary sounds bad, and the raw material hints that maybe something could be bad, but there’s nothing of real substance in this finding. However, look for it to be quoted as unequivocal damnation in debates to come.

Fortis Inc., proud issuer of FTS.PR.E, FTS.PR.F, FTS.PR.G, FTS.PR.H, FTS.PR.J, FTS.PR.K and FTS.PR.M, was confirmed at Pfd-2(low) by DBRS and removed from ‘Review-Developing’:

DBRS Limited (DBRS) has today removed the A (low) Issuer Rating, A (low) Unsecured Debentures and Pfd-2 (low) Preferred Shares ratings of Fortis Inc. (Fortis, the Parent or the Company) from Under Review with Developing Implications and has confirmed the ratings as listed above with Stable trends. This action follows the completion of the Company’s acquisition of UNS Energy Corporation (UNS) (the Acquisition) and the conversion of $1.8 billion of convertible debentures into common equity in late October 2014.

In DBRS’s view, the overall business risk profile of Fortis’ investment portfolio should remain in the A (low) range following the completion of the Acquisition.

Fortis’ financing of the USD 2.5 billion Acquisition was consistent with DBRS’s expectation. Fortis issued $1.8 billion in convertible debentures, approximately $600 million in preferred shares and the remaining portion in debt. Most of the convertible debentures were converted into common equity in late October 2014. As a result, the financial risk profile on a non-consolidated basis remains consistent with DBRS’s expectation, with all pro forma non-consolidated credit ratios improving from 2013. Fortis’ non-consolidated debt in the capital structure would remain within DBRS’s 20% guideline for holding company notching while all other key credit metrics would solidly remain within the current rating range.

FTS has been on Review-Developing for over a year.

The Canadian preferred share market was on wheels today, with PerpetualDiscounts up 33bp, FixedResets winning 47bp and DeemedRetractibles gaining 18bp. The Performance Highlights table is suitably enormous, with only one loser; led on the upside by the low-reset insurance issues that had the stuffing kicked out of them in the first week of the month. Volume was above average.

For as long as the FixedReset market is so violently unsettled, I’ll keep publishing updates of the more interesting and meaningful series of FixedResets’ Implied Volatilities. This doesn’t include Enbridge because although Enbridge has a large number of issues outstanding, all of which are quite liquid, the range of Issue Reset Spreads is too small for decent conclusions. The low is 212bp (ENB.PR.H; second-lowest is ENB.PR.D at 237bp) and the high is a mere 268 for ENB.PF.G.

Remember that all rich /cheap assessments are:

  • based on Implied Volatility Theory only
  • are relative only to other FixedResets from the same issuer
  • assume constant GOC-5 yield
  • assume constant Implied Volatility
  • assume constant spread

Here’s TRP:

impVol_TRP_141223
Click for Big

So according to this, TRP.PR.A, bid at 20.30, is $1.41 cheap, but it has already reset (at +192). TRP.PR.D, bid at 25.11 and resetting at +238bp on 2019-4-30 is $0.43 rich and TRP.PR.E, bid at 25.27 and resetting at +235bp on 2019-10-30, is $0.79 rich.

This particular calculation is fascinating because it is apparent that – disregarding the TRP.PR.A outlier – the slope of the line used to calculate implied volatility is negative. I can’t remember seeing one of those since the Credit Crunch!

impVol_MFC_141223
Click for Big

The impressive performance of MFC.PR.F brought it back to consistency with the curve defined by the higher reset issues today, but the Implied Volatility continues to be a conundrum. It is far too high if we consider that NVCC rules will never apply to these issues; it is far too low if we consider them to be NVCC non-compliant issues (and therefore with Deemed Maturities in the call schedule).

impVol_BAM_141223
Click for Big

There continues to be cheapness in the lowest-spread issue, BAM.PR.X, resetting at +180bp on 2017-6-30, which is bid at 20.60 after superb performance today and appears to be $0.76 cheap, while BAM.PR.R, resetting at +230bp 2016-6-30 is bid at 25.08 and appears to be $1.36 rich.

impVol_FTS_141223
Click for Big

This is just weird because the middle is expensive and the ends are cheap but anyway … FTS.PR.H, with a spread of +145bp, and bid at 18.78, looks $1.18 cheap and resets 2015-6-1. FTS.PR.K, with a spread of +205bp, and bid at 24.94, looks $0.96 expensive and resets 2019-3-1

pairsFR_141223
Click for Big

The average break-even rate has declined from 1.80%-2.00% at the time recent conversion decisions were made to a current cluster of (mostly) 1.55%-1.60%. This decline means that the estimated profit on TRP.PR.A conversion has declined from $0.48 to a mere $0.21 (at the lower end of the range, 1.55%).

HIMIPref™ Preferred Indices
These values reflect the December 2008 revision of the HIMIPref™ Indices

Values are provisional and are finalized monthly
Index Mean
Current
Yield
(at bid)
Median
YTW
Median
Average
Trading
Value
Median
Mod Dur
(YTW)
Issues Day’s Perf. Index Value
Ratchet 0.00 % 0.00 % 0 0.00 0 2.5690 % 2,521.9
FixedFloater 0.00 % 0.00 % 0 0.00 0 2.5690 % 3,992.6
Floater 3.01 % 3.11 % 66,751 19.44 4 2.5690 % 2,680.9
OpRet 4.41 % -3.08 % 25,222 0.08 2 0.0588 % 2,750.4
SplitShare 4.28 % 4.08 % 37,327 3.69 5 0.1490 % 3,196.8
Interest-Bearing 0.00 % 0.00 % 0 0.00 0 0.0588 % 2,515.0
Perpetual-Premium 5.45 % -0.21 % 71,880 0.08 20 0.1291 % 2,479.8
Perpetual-Discount 5.20 % 5.08 % 110,410 15.31 15 0.3281 % 2,648.8
FixedReset 4.24 % 3.63 % 247,985 16.45 77 0.4734 % 2,529.7
Deemed-Retractible 4.97 % 1.04 % 96,558 0.27 40 0.1766 % 2,616.6
FloatingReset 2.57 % 2.11 % 63,812 3.50 5 0.0079 % 2,536.6
Performance Highlights
Issue Index Change Notes
FTS.PR.J Perpetual-Discount -1.02 % YTW SCENARIO
Maturity Type : Limit Maturity
Maturity Date : 2044-12-23
Maturity Price : 23.76
Evaluated at bid price : 24.15
Bid-YTW : 4.94 %
BAM.PR.T FixedReset 1.00 % YTW SCENARIO
Maturity Type : Limit Maturity
Maturity Date : 2044-12-23
Maturity Price : 23.19
Evaluated at bid price : 24.20
Bid-YTW : 3.84 %
MFC.PR.B Deemed-Retractible 1.01 % YTW SCENARIO
Maturity Type : Hard Maturity
Maturity Date : 2025-01-31
Maturity Price : 25.00
Evaluated at bid price : 24.04
Bid-YTW : 5.18 %
BAM.PF.B FixedReset 1.01 % YTW SCENARIO
Maturity Type : Limit Maturity
Maturity Date : 2044-12-23
Maturity Price : 23.22
Evaluated at bid price : 25.00
Bid-YTW : 3.93 %
BNS.PR.P FixedReset 1.01 % YTW SCENARIO
Maturity Type : Call
Maturity Date : 2018-04-25
Maturity Price : 25.00
Evaluated at bid price : 25.91
Bid-YTW : 2.37 %
CU.PR.C FixedReset 1.06 % YTW SCENARIO
Maturity Type : Call
Maturity Date : 2017-06-01
Maturity Price : 25.00
Evaluated at bid price : 25.80
Bid-YTW : 2.75 %
MFC.PR.C Deemed-Retractible 1.12 % YTW SCENARIO
Maturity Type : Hard Maturity
Maturity Date : 2025-01-31
Maturity Price : 25.00
Evaluated at bid price : 23.45
Bid-YTW : 5.34 %
TRP.PR.A FixedReset 1.15 % YTW SCENARIO
Maturity Type : Limit Maturity
Maturity Date : 2044-12-23
Maturity Price : 20.30
Evaluated at bid price : 20.30
Bid-YTW : 4.07 %
FTS.PR.F Perpetual-Discount 1.22 % YTW SCENARIO
Maturity Type : Limit Maturity
Maturity Date : 2044-12-23
Maturity Price : 24.53
Evaluated at bid price : 24.80
Bid-YTW : 4.97 %
PWF.PR.P FixedReset 1.29 % YTW SCENARIO
Maturity Type : Limit Maturity
Maturity Date : 2044-12-23
Maturity Price : 21.27
Evaluated at bid price : 21.27
Bid-YTW : 3.63 %
BAM.PR.Z FixedReset 1.38 % YTW SCENARIO
Maturity Type : Call
Maturity Date : 2017-12-31
Maturity Price : 25.00
Evaluated at bid price : 25.65
Bid-YTW : 3.86 %
IAG.PR.A Deemed-Retractible 1.61 % YTW SCENARIO
Maturity Type : Hard Maturity
Maturity Date : 2025-01-31
Maturity Price : 25.00
Evaluated at bid price : 23.95
Bid-YTW : 5.15 %
CU.PR.E Perpetual-Discount 1.76 % YTW SCENARIO
Maturity Type : Limit Maturity
Maturity Date : 2044-12-23
Maturity Price : 23.87
Evaluated at bid price : 24.27
Bid-YTW : 5.08 %
BAM.PR.C Floater 1.76 % YTW SCENARIO
Maturity Type : Limit Maturity
Maturity Date : 2044-12-23
Maturity Price : 16.74
Evaluated at bid price : 16.74
Bid-YTW : 3.13 %
GWO.PR.H Deemed-Retractible 1.77 % YTW SCENARIO
Maturity Type : Hard Maturity
Maturity Date : 2025-01-31
Maturity Price : 25.00
Evaluated at bid price : 24.68
Bid-YTW : 5.03 %
BAM.PR.K Floater 2.50 % YTW SCENARIO
Maturity Type : Limit Maturity
Maturity Date : 2044-12-23
Maturity Price : 16.83
Evaluated at bid price : 16.83
Bid-YTW : 3.11 %
TRP.PR.C FixedReset 2.61 % YTW SCENARIO
Maturity Type : Limit Maturity
Maturity Date : 2044-12-23
Maturity Price : 19.65
Evaluated at bid price : 19.65
Bid-YTW : 3.86 %
BAM.PR.X FixedReset 2.64 % YTW SCENARIO
Maturity Type : Limit Maturity
Maturity Date : 2044-12-23
Maturity Price : 20.60
Evaluated at bid price : 20.60
Bid-YTW : 4.08 %
PWF.PR.A Floater 2.90 % YTW SCENARIO
Maturity Type : Limit Maturity
Maturity Date : 2044-12-23
Maturity Price : 19.50
Evaluated at bid price : 19.50
Bid-YTW : 2.71 %
BAM.PR.B Floater 3.07 % YTW SCENARIO
Maturity Type : Limit Maturity
Maturity Date : 2044-12-23
Maturity Price : 16.80
Evaluated at bid price : 16.80
Bid-YTW : 3.12 %
SLF.PR.G FixedReset 3.07 % YTW SCENARIO
Maturity Type : Hard Maturity
Maturity Date : 2025-01-31
Maturity Price : 25.00
Evaluated at bid price : 21.80
Bid-YTW : 4.43 %
MFC.PR.F FixedReset 4.48 % YTW SCENARIO
Maturity Type : Hard Maturity
Maturity Date : 2025-01-31
Maturity Price : 25.00
Evaluated at bid price : 21.45
Bid-YTW : 4.82 %
GWO.PR.N FixedReset 5.47 % A real move. All trades after 3:18pm were higher than the “last” 20.83 bid; and these amounted to 3300 shares.
YTW SCENARIO
Maturity Type : Hard Maturity
Maturity Date : 2025-01-31
Maturity Price : 25.00
Evaluated at bid price : 20.83
Bid-YTW : 4.89 %
Volume Highlights
Issue Index Shares
Traded
Notes
CM.PR.E Perpetual-Premium 192,259 Called for redemption effective January 31
YTW SCENARIO
Maturity Type : Call
Maturity Date : 2015-01-22
Maturity Price : 25.00
Evaluated at bid price : 24.97
Bid-YTW : -0.03 %
TD.PF.C FixedReset 110,049 Recent new issue.
YTW SCENARIO
Maturity Type : Limit Maturity
Maturity Date : 2044-12-23
Maturity Price : 23.10
Evaluated at bid price : 24.85
Bid-YTW : 3.56 %
CM.PR.P FixedReset 92,894 Recent new issue.
YTW SCENARIO
Maturity Type : Limit Maturity
Maturity Date : 2044-12-23
Maturity Price : 23.11
Evaluated at bid price : 24.86
Bid-YTW : 3.55 %
BMO.PR.W FixedReset 83,585 RBC crossed 64,800 at 25.07.
YTW SCENARIO
Maturity Type : Limit Maturity
Maturity Date : 2044-12-23
Maturity Price : 23.22
Evaluated at bid price : 25.15
Bid-YTW : 3.50 %
RY.PR.H FixedReset 72,465 RBC crossed 62,000 at 25.50.
YTW SCENARIO
Maturity Type : Limit Maturity
Maturity Date : 2044-12-23
Maturity Price : 23.32
Evaluated at bid price : 25.41
Bid-YTW : 3.50 %
RY.PR.Z FixedReset 54,366 RBC crossed 50,000 at 25.55.
YTW SCENARIO
Maturity Type : Limit Maturity
Maturity Date : 2044-12-23
Maturity Price : 23.38
Evaluated at bid price : 25.55
Bid-YTW : 3.46 %
There were 37 other index-included issues trading in excess of 10,000 shares.
Wide Spread Highlights
Issue Index Quote Data and Yield Notes
ENB.PR.Y FixedReset Quote: 21.96 – 22.49
Spot Rate : 0.5300
Average : 0.3295

YTW SCENARIO
Maturity Type : Limit Maturity
Maturity Date : 2044-12-23
Maturity Price : 21.62
Evaluated at bid price : 21.96
Bid-YTW : 4.35 %

ELF.PR.H Perpetual-Premium Quote: 25.44 – 26.00
Spot Rate : 0.5600
Average : 0.3923

YTW SCENARIO
Maturity Type : Limit Maturity
Maturity Date : 2044-12-23
Maturity Price : 24.97
Evaluated at bid price : 25.44
Bid-YTW : 5.48 %

CU.PR.D Perpetual-Discount Quote: 24.28 – 24.75
Spot Rate : 0.4700
Average : 0.3026

YTW SCENARIO
Maturity Type : Limit Maturity
Maturity Date : 2044-12-23
Maturity Price : 23.88
Evaluated at bid price : 24.28
Bid-YTW : 5.07 %

GWO.PR.L Deemed-Retractible Quote: 25.80 – 26.20
Spot Rate : 0.4000
Average : 0.2399

YTW SCENARIO
Maturity Type : Call
Maturity Date : 2018-12-31
Maturity Price : 25.00
Evaluated at bid price : 25.80
Bid-YTW : 4.77 %

FTS.PR.J Perpetual-Discount Quote: 24.15 – 24.75
Spot Rate : 0.6000
Average : 0.4517

YTW SCENARIO
Maturity Type : Limit Maturity
Maturity Date : 2044-12-23
Maturity Price : 23.76
Evaluated at bid price : 24.15
Bid-YTW : 4.94 %

NEW.PR.D SplitShare Quote: 32.41 – 33.41
Spot Rate : 1.0000
Average : 0.8572

YTW SCENARIO
Maturity Type : Call
Maturity Date : 2015-06-26
Maturity Price : 32.07
Evaluated at bid price : 32.41
Bid-YTW : 2.04 %

December 22, 2014

Monday, December 22nd, 2014

Matt Levine of Bloomberg points out the obvious flaws in paying informers:

Anyway $56 million for 14 water damaged houses! That’s a cool $4 million per house. Buys a lot of slab re-pouring. DealBook has more stories of whistle-blowers getting great gobs of money out of the Bank of America settlements — some $170 million to four whistle-blowers, out of Bank of America’s vast $16.65 billion mortgage settlement from August.

It is possible to overdo the talk of incentives in banking compensation, but, I mean, that’s quite an incentive. Appraising some homes properly will get you, let’s say, fired by your crooked bosses. 3 Appraising those homes improperly will get you, let’s say, a nice bonus. But appraising them improperly and then calling the FBI will get you a whopping great $56 million.

There are more signs that US real estate continues to normalize:

There’s an undersupply of single-family houses and apartments to rent for the first time since 2001, according to an analysis by Frank Nothaft, chief economist at mortgage buyer Freddie Mac, based on available inventory and historic vacancy rates. The deficit in the third quarter was about 350,000, the most in records dating back 14 years.

The shortage is giving the upper hand to institutional investors who spent more than $25 billion since 2012 buying single-family homes to rent. While the market for apartments has been in favor of landlords for five years, owners of houses are now able to increase rents and reduce turnover to boost profits.

The U.S. rental-vacancy rate fell to 7.4 percent in the third quarter, according to Census Bureau data. The market is considered balanced, with neither landlords nor tenants having the upper hand when it comes to rents, at a vacancy rate of 8.2 percent, based on the average from 1994 through 2003, according to Freddie Mac (FMCC)’s Nothaft.

The housing surplus peaked at almost 2 million units, including 1.2 million rentals, in the third quarter of 2009, when foreclosures were soaring and years of speculative construction led to a glut of empty houses.

Geoffrey R. Dunbar writes a Working Paper for the BoC titled Demographics and the Demand for Currency:

I use data from the Bank of Canada’s Bank Note Distribution System and exploit a natural experiment offered by the timing of Easter in the Gregorian calendar to analyze the effects of demographic change for currency demand. I find that the main drivers of low-denomination bank note demand are merchants. Merchants and the youngest age group, aged 15-24, are also a significant source of demand for twenty-dollar bank notes and for the total dollar value of withdrawals. In contrast, increases in the demographic age groups 25-54 and 55 plus tend to lower bank note withdrawals. Finally, I find no evidence that employment status is related to bank note demand, but that there is a difference between the bank note demand of men aged 15-24 and women aged 15-24 increases in the share of women aged 15-24 lead to increases in bank note demand.

The last sentence provides great opportunity for salacious speculation! Regrettably:

Although it is interesting to conjecture reasons for the apparent difference in currency demand between young men and young women, the data available do not permit a causal investigation.

The BoC has also published a Working Paper by Sami Alpanda and Sarah Zubairy titled Addressing Household Indebtedness: Monetary, Fiscal or Macroprudential Policy?:

In this paper, we build a dynamic stochastic general-equilibrium model with housing and household debt, and compare the effectiveness of monetary policy, housing-related fiscal policy, and macroprudential regulations in reducing household indebtedness. The model features long-term fixed-rate borrowing and lending across two types of households, and differentiates between the flow and the stock of household debt. We use Bayesian methods to estimate parameters related to model dynamics, while level parameters are calibrated to match key ratios in the U.S. data. We find that monetary tightening is able to reduce the stock of real mortgage debt, but leads to an increase in the household debt-to-income ratio. Among the policy tools we consider, tightening in mortgage interest deduction and regulatory loan-to-value (LTV) are the most effective and least costly in reducing household debt, followed by increasing property taxes and monetary tightening. Although mortgage interest deduction is a broader tool than regulatory LTV, and therefore potentially more costly in terms of output loss, it is effective in reducing overall mortgage debt, since its direct reach also extends to home equity loans.

I don’t like the idea of macroprudential regulation as stated: reducing the maximum LTV is too prescriptive. I would much prefer adding a countercyclical element to the Risk Weighting of mortgages for banks in Canada – e.g., if mortgages on the balance sheet are within – say – 3% of the 10 year average, then everything is normal. But once they’re – say – 10% above the 10 year average, then the Risk Weight changes from 35% to 40%. There are also considerations of public welfare in play – when loans are easy to get, introducing a macroprudential policy that leans against high-LTV mortgages means that the marginal consumer is being told he can’t buy a house, but can buy a car. And what if the wise policy-makers are wrong?

Allison Schrager of Bloomberg reminds us of The Real Risk of Pension Plans: They Give Retirees False Security:

Retirement security is ending the year at an all-time low. The $1.1 trillion last-minute spending bill will allow trustees to cut benefits in multiemployer defined benefit pension plans. And while it affects a relatively small population, 10 million people at most, it opens the door for other employers to make similar cuts. Maybe that’s a long way off; maybe not. But the provision is a rude awakening: We may romanticize guaranteed retirement benefits and lament our 401(k) world, but pensions aren’t safe these days either.

It turns out that pension plan sponsors, and the politicians who oversee them, are just as fallible as workaday employees. We all prefer to spend more today and deal with the future when it comes. Pension plans have done this for years by promising generous benefits without a clear plan to pay for them. When pressed, they may simply raise their performance expectations or choose more risky investments in search of higher returns. Neither is a legitimate solution. In theory, regulators should keep pension plan sponsors in check. In practice, the rules regulators must enforce tend to indulge, or even encourage, risky behavior.

It was a nice day for US Equities:

The Standard & Poor’s 500 Index (SPX) increased 0.4 percent to 2,078.54 at 4 p.m. in New York, above its previous record close of 2,075.37 reached Dec. 5. The Dow Jones Industrial Average climbed 154.64 points, or 0.9 percent, to 17,959.44, also a closing record. The Russell 200 Index added 0.5 percent to the highest since July, while the Nasdaq Composite Index (CCMP) finished 10 points below a more than 14-year high.

The S&P 500 and Dow (INDU) climbed back to record levels after a slide in oil prices and a worsening of the financial crisis in Russia rippled through financial markets earlier this month, wiping more than $1 trillion from U.S. equity values in less than two weeks. The S&P 500 lost 5 percent in seven trading days through Dec. 16.

Today’s gains in the S&P 500 completed the fifth recovery this year from a decline of 4 percent or more, just 17 days after it started. In comparable drops beginning in January, April, July and September, the S&P 500 needed about a month to erase losses, data compiled by Bloomberg show.

This is the 50th time this year the S&P 500 has closed at an all-time high, while the Dow has done it 35 times. The S&P 500 reached records on 45 occasions in 2013, as the index recovered from the financial crisis to top its previous high from October 2007 for the first time

Canadian equities, not so much:

Canadian stocks declined, after posting the best week in five years, as commodity producers tumbled with the price of crude and metals.

The Standard & Poor’s/TSX Composite Index (SPTSX) fell 35.88 points, or 0.3 percent, to 14,432.38 at 4 p.m. in Toronto. Trading in the benchmark gauge’s stocks was 16 percent below the 30-day average. The index has lost 2.1 percent in December, paring its gains for the year to 6 percent.

Veresen Inc., proud issuer of VSN.PR.A and VSN.PR.C, has announced:

the formation of a new entity, Veresen Midstream Limited Partnership (“Veresen Midstream”), which will be owned equally by Veresen and affiliates of Kohlberg Kravis Roberts & Co. L.P. (“KKR”), a global investment firm. Veresen Midstream has entered into definitive agreements to acquire certain natural gas gathering and compression assets supporting Montney development in the Dawson area of northeastern British Columbia from Encana Corporation (“Encana”) and the Cutbank Ridge Partnership (“CRP”). CRP is a partnership between Encana and Cutbank Dawson Gas Resources Ltd., a subsidiary of Mitsubishi Corporation. Veresen Midstream has also agreed to undertake up to $5 billion of new midstream expansion for Encana and CRP in the Montney region under a 30-year fee-for-service arrangement. Veresen Midstream will be Veresen’s primary growth vehicle for its Canadian natural gas and natural gas liquids (“NGL”) midstream business.

Key Highlights

  • Establishes Veresen Midstream as a leading player in the core of the Montney, one of North America’s most prolific and competitive resource plays.
  • Requires no up-front funding from Veresen; Veresen Midstream will be funded initially through committed non-recourse debt and a cash equity contribution from KKR, while Veresen will fund its equity investment by contributing its Hythe/Steeprock assets.
  • Provides Veresen Midstream with a large multi-year capital program to construct contracted midstream infrastructure under favourable economic terms, and a powerful platform to pursue additional third-party growth opportunities.
  • Establishes a long-term, fee-for-service natural gas gathering, compression and processing agreement with Encana and CRP.
  • Cash flow neutral to Veresen in 2015; accretive as Veresen Midstream’s new capital projects are placed in-service.

DBRS comments:

DBRS expects that this agreement will have no material impact on the credit risk profile of Veresen. Based on its preliminary review, DBRS views the agreement as neutral for the business risk profile of the Company. The business risk profile of Veresen Midstream is supported by the Hythe/Steeprock firm’s long-term take-or-pay contract with Encana and the Dawson assets (current and future expansion) which are under long-term contract with CRP. Veresen would also modestly benefit from a more diversified portfolio of assets situated in the rich gas Montney basin, which is one of the most prolific gas plays actively targeted by major producers; however, this benefit could be offset by the significant financing requirements at Veresen Midstream, as DBRS notes that cash distributions will be available to Veresen after debt servicing at Veresen Midstream.

… and as for DBRS itself:

DBRS Ltd., the world’s fourth-largest credit rating company, has agreed to be acquired by the Carlyle Group (CG) and Warburg Pincus for about $500 million, according to people familiar with the sale.

The headquarters of closely held DBRS, which has offices in New York, Chicago and London, will stay in Toronto, and Walter Schroeder, the firm’s founder, will remain an investor, the companies said in a statement today.

“While our Canadian franchise and culture will continue to be at the core of DBRS’s operations, the breadth and depth of both Warburg Pincus and Carlyle’s international presence will be invaluable to DBRS,” Schroeder said in the statement.

Carlyle and Warburg were attracted to DBRS primarily because of its strong position in Canada and niche products like commercial mortgage-backed securities, which will provide steady cash flow as it looks to expand elsewhere in the U.S. and Europe, according to a person familiar with the matter.

It was a mixed day for the Canadian preferred share market, with PerpetualDiscounts down 28bp, FixedResets off 8bp and DeemedRetractibles gaining 7bp. There is yet another lengthy list of performance highlights, with Brookfield issues prominent among the losers. Volume was average.

For as long as the FixedReset market is so violently unsettled, I’ll keep publishing updates of the more interesting and meaningful series of FixedResets’ Implied Volatilities. This doesn’t include Enbridge because although Enbridge has a large number of issues outstanding, all of which are quite liquid, the range of Issue Reset Spreads is too small for decent conclusions. The low is 212bp (ENB.PR.H; second-lowest is ENB.PR.D at 237bp) and the high is a mere 268 for ENB.PF.G.

Remember that all rich /cheap assessments are:

  • based on Implied Volatility Theory only
  • are relative only to other FixedResets from the same issuer
  • assume constant GOC-5 yield
  • assume constant Implied Volatility
  • assume constant spread

Here’s TRP:

impVol_TRP_141222
Click for Big

So according to this, TRP.PR.A, bid at 20.07, is $1.50 cheap, but it has already reset (at +192). TRP.PR.D, bid at 25.10 and resetting at +238bp on 2019-4-30 is $0.09 rich and TRP.PR.E, bid at 25.20 and resetting at +235bp on 2019-10-30, is $0.79 rich.

This particular calculation is fascinating because it is apparent that – disregarding the TRP.PR.A outlier – the slope of the line used to calculate implied volatility is negative. I can’t remember seeing one of those since the Credit Crunch!

impVol_MFC_141222
Click for Big

Here, as has often been the case lately, it is apparent that

  • MFC.PR.F, resetting at 141bp on 2016-06-19 is in another world and distorting results again. It’s the only deep-discount issue, bid at 20.53 – everything else is above or near par
  • the slope determined by the higher-spread issues is unreasonably high if these are to be considered perpetual issues and unreasonably low if they are to be considered NVCC non-compliant issues
impVol_BAM_141222
Click for Big

There continues to be extraordinary cheapness in the lowest-spread issue, BAM.PR.X, resetting at +180bp on 2017-6-30, which is bid at 20.07 and appears to be $0.86 cheap, while BAM.PR.R, resetting at +230bp 2016-6-30 is bid at 24.86 and appears to be $1.43 rich.

impVol_FTS_141222
Click for Big

This is just weird because the middle is expensive and the ends are cheap but anyway … FTS.PR.H, with a spread of +145bp, and bid at 18.70, looks $1.07 cheap and resets 2015-6-1. FTS.PR.K, with a spread of +205bp, and bid at 24.91, looks $1.01 expensive and resets 2019-3-1

pairsFR_141222
Click for Big

The average break-even rate has declined from 1.80%-2.00% at the time recent conversion decisions were made to a current range of (mostly) 1.55%-1.70%. This decline means that the estimated profit on TRP.PR.A conversion has declined from $0.48 to a mere $0.21 (at the lower end of the range, 1.55%).

HIMIPref™ Preferred Indices
These values reflect the December 2008 revision of the HIMIPref™ Indices

Values are provisional and are finalized monthly
Index Mean
Current
Yield
(at bid)
Median
YTW
Median
Average
Trading
Value
Median
Mod Dur
(YTW)
Issues Day’s Perf. Index Value
Ratchet 0.00 % 0.00 % 0 0.00 0 -0.8443 % 2,458.7
FixedFloater 0.00 % 0.00 % 0 0.00 0 -0.8443 % 3,892.6
Floater 3.08 % 3.19 % 66,900 19.27 4 -0.8443 % 2,613.8
OpRet 4.41 % -2.77 % 26,167 0.08 2 0.0000 % 2,748.8
SplitShare 4.29 % 4.09 % 38,865 3.69 5 0.4859 % 3,192.0
Interest-Bearing 0.00 % 0.00 % 0 0.00 0 0.0000 % 2,513.5
Perpetual-Premium 5.45 % -0.26 % 74,524 0.08 20 0.0582 % 2,476.6
Perpetual-Discount 5.22 % 5.10 % 110,488 15.29 15 -0.2774 % 2,640.2
FixedReset 4.26 % 3.60 % 249,810 16.48 77 -0.0786 % 2,517.8
Deemed-Retractible 4.98 % 1.46 % 97,419 0.18 40 0.0745 % 2,612.0
FloatingReset 2.57 % 2.13 % 64,337 3.50 5 0.0394 % 2,536.4
Performance Highlights
Issue Index Change Notes
BAM.PF.D Perpetual-Discount -3.31 % YTW SCENARIO
Maturity Type : Limit Maturity
Maturity Date : 2044-12-22
Maturity Price : 21.01
Evaluated at bid price : 21.01
Bid-YTW : 5.86 %
BAM.PR.M Perpetual-Discount -1.72 % YTW SCENARIO
Maturity Type : Limit Maturity
Maturity Date : 2044-12-22
Maturity Price : 21.16
Evaluated at bid price : 21.16
Bid-YTW : 5.64 %
BAM.PR.T FixedReset -1.64 % YTW SCENARIO
Maturity Type : Limit Maturity
Maturity Date : 2044-12-22
Maturity Price : 23.08
Evaluated at bid price : 23.96
Bid-YTW : 3.88 %
TRP.PR.A FixedReset -1.62 % YTW SCENARIO
Maturity Type : Limit Maturity
Maturity Date : 2044-12-22
Maturity Price : 20.07
Evaluated at bid price : 20.07
Bid-YTW : 4.12 %
BAM.PF.C Perpetual-Discount -1.54 % YTW SCENARIO
Maturity Type : Limit Maturity
Maturity Date : 2044-12-22
Maturity Price : 21.13
Evaluated at bid price : 21.13
Bid-YTW : 5.77 %
BAM.PR.B Floater -1.51 % YTW SCENARIO
Maturity Type : Limit Maturity
Maturity Date : 2044-12-22
Maturity Price : 16.30
Evaluated at bid price : 16.30
Bid-YTW : 3.22 %
ENB.PR.B FixedReset -1.38 % YTW SCENARIO
Maturity Type : Limit Maturity
Maturity Date : 2044-12-22
Maturity Price : 21.95
Evaluated at bid price : 22.20
Bid-YTW : 4.30 %
BAM.PR.R FixedReset -1.35 % YTW SCENARIO
Maturity Type : Limit Maturity
Maturity Date : 2044-12-22
Maturity Price : 23.67
Evaluated at bid price : 24.86
Bid-YTW : 3.74 %
POW.PR.G Perpetual-Premium -1.16 % YTW SCENARIO
Maturity Type : Call
Maturity Date : 2021-04-15
Maturity Price : 25.00
Evaluated at bid price : 25.95
Bid-YTW : 4.86 %
ENB.PR.P FixedReset -1.15 % YTW SCENARIO
Maturity Type : Limit Maturity
Maturity Date : 2044-12-22
Maturity Price : 21.91
Evaluated at bid price : 22.34
Bid-YTW : 4.37 %
GWO.PR.N FixedReset -1.00 % YTW SCENARIO
Maturity Type : Hard Maturity
Maturity Date : 2025-01-31
Maturity Price : 25.00
Evaluated at bid price : 19.75
Bid-YTW : 5.52 %
HSE.PR.A FixedReset 1.07 % YTW SCENARIO
Maturity Type : Limit Maturity
Maturity Date : 2044-12-22
Maturity Price : 19.87
Evaluated at bid price : 19.87
Bid-YTW : 4.02 %
FTS.PR.J Perpetual-Discount 1.62 % YTW SCENARIO
Maturity Type : Limit Maturity
Maturity Date : 2044-12-22
Maturity Price : 24.00
Evaluated at bid price : 24.40
Bid-YTW : 4.89 %
CGI.PR.D SplitShare 1.75 % YTW SCENARIO
Maturity Type : Soft Maturity
Maturity Date : 2023-06-14
Maturity Price : 25.00
Evaluated at bid price : 25.60
Bid-YTW : 3.45 %
SLF.PR.G FixedReset 1.93 % YTW SCENARIO
Maturity Type : Hard Maturity
Maturity Date : 2025-01-31
Maturity Price : 25.00
Evaluated at bid price : 21.15
Bid-YTW : 4.79 %
Volume Highlights
Issue Index Shares
Traded
Notes
TD.PF.C FixedReset 115,130 Recent new issue.
YTW SCENARIO
Maturity Type : Limit Maturity
Maturity Date : 2044-12-22
Maturity Price : 23.11
Evaluated at bid price : 24.88
Bid-YTW : 3.56 %
CM.PR.P FixedReset 80,195 Recent new issue.
YTW SCENARIO
Maturity Type : Limit Maturity
Maturity Date : 2044-12-22
Maturity Price : 23.08
Evaluated at bid price : 24.79
Bid-YTW : 3.57 %
IAG.PR.E Deemed-Retractible 49,640 Called for redemption effective 2014-12-31.
YTW SCENARIO
Maturity Type : Call
Maturity Date : 2015-12-31
Maturity Price : 25.75
Evaluated at bid price : 25.98
Bid-YTW : 4.81 %
MFC.PR.N FixedReset 40,200 Recent new issue.
YTW SCENARIO
Maturity Type : Hard Maturity
Maturity Date : 2025-01-31
Maturity Price : 25.00
Evaluated at bid price : 24.92
Bid-YTW : 3.82 %
SLF.PR.G FixedReset 38,668 Desjardins crossed 13,000 at 20.93.
YTW SCENARIO
Maturity Type : Hard Maturity
Maturity Date : 2025-01-31
Maturity Price : 25.00
Evaluated at bid price : 21.15
Bid-YTW : 4.79 %
TRP.PR.B FixedReset 31,904 YTW SCENARIO
Maturity Type : Limit Maturity
Maturity Date : 2044-12-22
Maturity Price : 17.16
Evaluated at bid price : 17.16
Bid-YTW : 3.91 %
There were 32 other index-included issues trading in excess of 10,000 shares.
Wide Spread Highlights
Issue Index Quote Data and Yield Notes
BAM.PF.D Perpetual-Discount Quote: 21.01 – 21.64
Spot Rate : 0.6300
Average : 0.3861

YTW SCENARIO
Maturity Type : Limit Maturity
Maturity Date : 2044-12-22
Maturity Price : 21.01
Evaluated at bid price : 21.01
Bid-YTW : 5.86 %

BAM.PR.K Floater Quote: 16.42 – 17.14
Spot Rate : 0.7200
Average : 0.5232

YTW SCENARIO
Maturity Type : Limit Maturity
Maturity Date : 2044-12-22
Maturity Price : 16.42
Evaluated at bid price : 16.42
Bid-YTW : 3.19 %

SLF.PR.A Deemed-Retractible Quote: 24.26 – 24.78
Spot Rate : 0.5200
Average : 0.3869

YTW SCENARIO
Maturity Type : Hard Maturity
Maturity Date : 2025-01-31
Maturity Price : 25.00
Evaluated at bid price : 24.26
Bid-YTW : 5.14 %

PVS.PR.B SplitShare Quote: 25.31 – 25.74
Spot Rate : 0.4300
Average : 0.3039

YTW SCENARIO
Maturity Type : Hard Maturity
Maturity Date : 2019-01-10
Maturity Price : 25.00
Evaluated at bid price : 25.31
Bid-YTW : 4.09 %

BAM.PR.M Perpetual-Discount Quote: 21.16 – 21.50
Spot Rate : 0.3400
Average : 0.2162

YTW SCENARIO
Maturity Type : Limit Maturity
Maturity Date : 2044-12-22
Maturity Price : 21.16
Evaluated at bid price : 21.16
Bid-YTW : 5.64 %

HSE.PR.C FixedReset Quote: 25.04 – 25.34
Spot Rate : 0.3000
Average : 0.1805

YTW SCENARIO
Maturity Type : Limit Maturity
Maturity Date : 2044-12-22
Maturity Price : 23.17
Evaluated at bid price : 25.04
Bid-YTW : 4.40 %

December 19, 2014

Saturday, December 20th, 2014

Canadian inflation was tamer than expected:

Canada’s inflation rate slowed more than economists forecast in November, returning to the central bank’s target on a drop in gasoline prices.

The consumer price index rose 2.0 percent from a year ago following the October pace of 2.4 percent, Statistics Canada said today from Ottawa. The core rate, which excludes eight volatile products including fruit, vegetables and gasoline, slowed to 2.1 percent following the October pace of 2.3 percent, which was the fastest in almost three years.

Economists forecast the total rate would rise 2.2 percent and core by 2.4 percent, according to median responses in separate Bloomberg News surveys.

Bank of Canada Governor Stephen Poloz has said inflation will slow to a 1.4 percent pace in the second quarter of next year, ending a period of faster-than-expected gains linked to temporary factors such as a weaker currency and price increases for products such as meat. Policy makers have kept their benchmark overnight lending rate at 1 percent for more than four years and economists surveyed by Bloomberg predict Poloz won’t tighten for about another year.

… which didn’t do the dollar much good:

Canada’s dollar approached a five-year low after a report showed inflation slowed more than forecast in November, adding to speculation slumping crude-oil prices will damp economic growth and keep interest rates low for longer.

The currency fell for a fourth week as crude, the nation’s biggest export, traded at almost the lowest since 2009. Canadian two-year government bonds’ yield advantage over U.S. peers shrank to the least since 2010 as traders priced in a rate increase by the Federal Reserve in the first half of 2015 and began to push chances for Bank of Canada rate action into 2016.

The loonie, as the Canadian dollar is known for the image of the aquatic bird on the C$1 coin, weakened 0.2 percent to C$1.1600 per U.S. dollar at 5 p.m. Toronto time. It touched C$1.1674 on Dec. 15, the weakest level since July 2009. One loonie purchases 86.21 U.S. cents.

Canada’s two-year debt yielded 37 basis points, or 0.37 percentage point, more than comparable-maturity Treasuries, compared with 63 basis points in October. The Canadian yields have been little changed during the period, while U.S. yields rose as investors sold Treasuries. Two-year securities are more sensitive to expectations for changes in central-bank policy than longer-maturity debt, which tends to reflect expectations for inflation.

Canadian retail sales were little changed in October at C$42.8 billion ($36.9 billion), Statistics Canada said in another report. A Bloomberg survey of economists forecast a 0.3 percent decrease.

Ontario, Canada’s most populous province, had its credit rating downgraded to AA- from AA by Fitch Ratings. The company cited the difficult actions needed to meet the province’s goal for a balanced budget by 2017-18.

… but equities seemed pretty happy:

Canadian stocks rose for a fourth day, capping their best week in five years, as energy producers led gains in a rally ignited by the Federal Reserve’s pledge to be patient on boosting borrowing costs.

Energy stocks in the Standard & Poor’s/TSX Composite Index (SPTSX) rose 2.9 percent for a 13 percent gain this week, the most in five years. Trican Well Service Ltd. and TransGlobe Energy Corp. soared more than 8.8 percent. BlackBerry Ltd. dropped 1.2 percent after reporting third-quarter revenue short of analysts’ estimates.

The S&P/TSX index climbed 121.51 points, or 0.9 percent, to 14,468.26 at 4 p.m. in Toronto. The gauge surged 5.6 percent in the past four days as oil prices stabilized and Fed Chair Janet Yellen said the U.S. central bank will probably hold rates near zero at least through the first quarter.

MetLife has been designated a systemically important financial institution – and doesn’t like it:

The Financial Stability Oversight Council voted to designate New York-based MetLife a SIFI, the insurer said today in a statement. The ruling subjects MetLife to stricter Federal Reserve oversight that could include tougher capital, leverage and liquidity requirements. The company can appeal in U.S. district court within 30 days.

“We continue to believe that MetLife is not systemically important,” the insurer said in the statement. “The company will carefully review the designation rationale as it considers its next steps.”

The company has said that it wouldn’t pose a risk to the broader financial system even if it were to fail, and Kandarian has called the insurance industry a source of stability. MetLife, based in New York, didn’t take a bailout during the 2008 financial crisis.

MetLife said today that FSOC should focus on activities that pose systemic risks, rather than on individual companies.

“FSOC has already embraced this activities-based approach for the asset-management industry but has rejected it for the life-insurance industry,” MetLife said in its statement.

U.S. lawmakers voted last week to give the Fed more flexibility in how it sets rules after insurers said they shouldn’t be subject to standards set for banks. Kandarian, in a Dec. 10 statement, praised Congress for passing the legislation, which he said would give the central bank the “opportunity to write rules that will preserve competition.”

Simon Kennedy of Bloomberg draws our attention to an interesting parallel to 1956:

The U.K., with France, followed Israel into Egypt in 1956 after President Gamal Abdel Nasser nationalized the global commercial lifeline and kicked out the consortium that had been running the canal.

Britain was exposed when sterling came under speculative attack. Investors targeted its $2.80 peg to the dollar, forcing the Bank of England to run down its reserves to defend it.

For the U.K., “Suez was also a financial crisis,” according to a 2001 study by IMF historian James M. Boughton.

As they struggled to maintain the $2 billion minimum viewed as necessary to stave off devaluation, British officials began looking for assistance. Knowing the U.S. was unlikely to help directly, they turned to the then decade-old IMF.

No dice. U.S. Treasury Secretary George M. Humphrey told the U.K. he would only back it at the IMF when it was “conforming to, rather than defying, the United Nations.”

On the verge of having to reveal its reserves had breached $2 billion, the British government buckled and announced a troop withdrawal from Egypt. That freed up $1.3 billion of international loans. Sterling was saved.

As noted very briefly above, Fitch downgraded Ontari-ari-ari-owe:

RATING DOWNGRADE: Difficult actions will be necessary to achieve the province’s deficit elimination goal of fiscal 2018 and budget options are likely to prove more limited given the extent of actions taken to date and use of one-time actions to achieve targets, in Fitch’s opinion. While the province is considering other fiscal options for fiscal 2016 should economic conditions restrain future revenue growth, the downgrade to ‘AA-‘ reflects Fitch’s concern that risks remain to achieving its goals and both debt burden and the accumulated deficit will remain significantly elevated, reflected in a rating level more consistent with an ‘AA-‘ rating.

SIGNIFICANT FINANCIAL IMBALANCE: The province had an accumulated deficit equal to 152% of operating revenues in fiscal 2014 (25.4% of gross domestic product [GDP]) due to, slow revenue growth, and increasing expenditures, and sizable capital borrowing. Annual deficits through the forecast period of fiscal 2018 will contribute to growth in the accumulated deficit.

LARGE AND GROWING DEBT BURDEN: The province has a high debt burden (net direct debt to GDP) with net debt to GDP at 38.4% for fiscal 2014, although debt service expense is a manageable 8% of annual expenditures. Fitch expects debt levels to increase through fiscal 2016, and then begin to decrease, given the province’s expectation of an annual deficit through that fiscal year and continued growth in GDP. Pensions are well funded.

RATING SENSITIVITIES

The rating is sensitive to the province’s commitment and success in achieving deficit elimination targets and restoring fiscal balance. Failure to enact budgets that follow a path toward articulated deficit elimination targets would result in negative rating pressure. Reaching deficit elimination targets ahead of forecast, sizable growth in GDP, and steady progress on lowering debt burden and the accumulated deficit would be positive credit factors.

It was a good day for the Canadian preferred share market, with PerpetualDiscounts winning 37bp, FixedResets up 26bp and DeemedRetractibles gaining 13bp. Volatility was high (although low by recent standards!) and dominated by FixedResets – particularly the low-spread and credit-uncertain Enbridge issues which have been hit hard recently. Volume was average.

For as long as the FixedReset market is so violently unsettled, I’ll keep publishing updates of the more interesting and meaningful series of FixedResets’ Implied Volatilities. This doesn’t include Enbridge because although Enbridge has a large number of issues outstanding, all of which are quite liquid, the range of Issue Reset Spreads is too small for decent conclusions. The low is 212bp (ENB.PR.H; second-lowest is ENB.PR.D at 237bp) and the high is a mere 268 for ENB.PF.G.

Remember that all rich /cheap assessments are:

  • based on Implied Volatility Theory only
  • are relative only to other FixedResets from the same issuer
  • assume constant GOC-5 yield
  • assume constant Implied Volatility
  • assume constant spread

Here’s TRP:

impVol_TRP_141219
Click for Big

So according to this, TRP.PR.A, bid at 20.40, is $1.24 cheap, but it has already reset (at +192). TRP.PR.D, bid at 25.11 and resetting at +238bp on 2019-4-30 is $0.44 rich and TRP.PR.E, bid at 25.40 and resetting at +235bp on 2019-10-30, is $0.93 rich.

This particular calculation is fascinating because it is apparent that – disregarding the TRP.PR.A outlier – the slope of the line used to calculate implied volatility is negative. I can’t remember seeing one of those since the Credit Crunch!

impVol_MFC_141219
Click for Big

Here, as has often been the case lately, it is apparent that

  • MFC.PR.F, resetting at 141bp on 2016-06-19 is in another world and distorting results again. It’s the only deep-discount issue, bid at 20.65 – everything else is above or near par.
  • the slope determined by the higher-spread issues is unreasonably high if these are to be considered perpetual issues and unreasonably low if they are to be considered NVCC non-compliant issues
impVol_BAM_141219
Click for Big

There continues to be extraordinary cheapness in the lowest-spread issue, BAM.PR.X, resetting at +180bp on 2017-6-30, which is bid at 20.26 and appears to be $0.95 cheap, while BAM.PR.R, resetting at +230bp 2016-6-30 is bid at 25.20 and appears to be $1.65 rich.

impVol_FTS_141219
Click for Big

This is just weird because the middle is expensive and the ends are cheap but anyway … FTS.PR.H, with a spread of +145bp, and bid at 18.60, looks $1.08 cheap and resets 2015-6-1. FTS.PR.K, with a spread of +205bp, and bid at 24.81, looks $1.02 expensive and resets 2019-3-1

pairs_FR_141219
Click for Big

The average break-even rate has declined from 1.80%-2.00% at the time recent conversion decisions were made to a current range of 1.50%-1.60%. This decline means that the estimated profit on TRP.PR.A conversion has declined from $0.48 to a mere $0.16 (at the lower end of the range).

HIMIPref™ Preferred Indices
These values reflect the December 2008 revision of the HIMIPref™ Indices

Values are provisional and are finalized monthly
Index Mean
Current
Yield
(at bid)
Median
YTW
Median
Average
Trading
Value
Median
Mod Dur
(YTW)
Issues Day’s Perf. Index Value
Ratchet 0.00 % 0.00 % 0 0.00 0 1.1782 % 2,479.6
FixedFloater 0.00 % 0.00 % 0 0.00 0 1.1782 % 3,925.8
Floater 3.06 % 3.16 % 65,591 19.34 4 1.1782 % 2,636.0
OpRet 4.41 % -2.78 % 26,566 0.08 2 0.0000 % 2,748.8
SplitShare 4.31 % 4.04 % 39,459 3.70 5 -0.1804 % 3,176.6
Interest-Bearing 0.00 % 0.00 % 0 0.00 0 0.0000 % 2,513.5
Perpetual-Premium 5.44 % -3.14 % 75,182 0.08 20 -0.0196 % 2,475.1
Perpetual-Discount 5.20 % 5.11 % 110,801 15.26 15 0.3683 % 2,647.5
FixedReset 4.26 % 3.58 % 250,616 16.57 77 0.2554 % 2,519.8
Deemed-Retractible 4.98 % 1.11 % 99,552 0.19 40 0.1252 % 2,610.0
FloatingReset 2.56 % 2.11 % 63,285 3.51 5 -0.1417 % 2,535.4
Performance Highlights
Issue Index Change Notes
ENB.PF.G FixedReset 1.18 % YTW SCENARIO
Maturity Type : Limit Maturity
Maturity Date : 2044-12-19
Maturity Price : 22.74
Evaluated at bid price : 23.99
Bid-YTW : 4.23 %
GWO.PR.H Deemed-Retractible 1.25 % YTW SCENARIO
Maturity Type : Hard Maturity
Maturity Date : 2025-01-31
Maturity Price : 25.00
Evaluated at bid price : 24.28
Bid-YTW : 5.23 %
TRP.PR.E FixedReset 1.36 % YTW SCENARIO
Maturity Type : Limit Maturity
Maturity Date : 2044-12-19
Maturity Price : 23.30
Evaluated at bid price : 25.40
Bid-YTW : 3.63 %
ENB.PF.E FixedReset 1.41 % YTW SCENARIO
Maturity Type : Limit Maturity
Maturity Date : 2044-12-19
Maturity Price : 22.63
Evaluated at bid price : 23.72
Bid-YTW : 4.27 %
PWF.PR.T FixedReset 1.49 % YTW SCENARIO
Maturity Type : Call
Maturity Date : 2019-01-31
Maturity Price : 25.00
Evaluated at bid price : 25.83
Bid-YTW : 3.49 %
ENB.PR.Y FixedReset 1.52 % YTW SCENARIO
Maturity Type : Limit Maturity
Maturity Date : 2044-12-19
Maturity Price : 21.71
Evaluated at bid price : 22.08
Bid-YTW : 4.27 %
GWO.PR.N FixedReset 1.53 % YTW SCENARIO
Maturity Type : Hard Maturity
Maturity Date : 2025-01-31
Maturity Price : 25.00
Evaluated at bid price : 19.95
Bid-YTW : 5.33 %
FTS.PR.H FixedReset 1.58 % YTW SCENARIO
Maturity Type : Limit Maturity
Maturity Date : 2044-12-19
Maturity Price : 18.60
Evaluated at bid price : 18.60
Bid-YTW : 3.77 %
PWF.PR.A Floater 5.56 % Reasonably sort-of real. This reverses yesterday‘s loss, which was reasonably sort of real, but on trivial volume. Volume today was actually respectable, 5,776 shares, with the low for the day being 18.41 at the opening, with all subsequent trades near or above 19.00 – with a high of 19.98 for 500 shares late in the day.
YTW SCENARIO
Maturity Type : Limit Maturity
Maturity Date : 2044-12-19
Maturity Price : 19.00
Evaluated at bid price : 19.00
Bid-YTW : 2.78 %
Volume Highlights
Issue Index Shares
Traded
Notes
TD.PF.C FixedReset 140,825 Recent new issue.
YTW SCENARIO
Maturity Type : Limit Maturity
Maturity Date : 2044-12-19
Maturity Price : 23.07
Evaluated at bid price : 24.76
Bid-YTW : 3.53 %
ENB.PR.Y FixedReset 127,774 Scotia crossed 100,000 at 21.98.
YTW SCENARIO
Maturity Type : Limit Maturity
Maturity Date : 2044-12-19
Maturity Price : 21.71
Evaluated at bid price : 22.08
Bid-YTW : 4.27 %
ENB.PR.T FixedReset 113,374 Scotia crossed 100,000 at 22.40.
YTW SCENARIO
Maturity Type : Limit Maturity
Maturity Date : 2044-12-19
Maturity Price : 21.97
Evaluated at bid price : 22.45
Bid-YTW : 4.29 %
SLF.PR.A Deemed-Retractible 76,340 Desjardins crossed 74,800 at 24.40.
YTW SCENARIO
Maturity Type : Hard Maturity
Maturity Date : 2025-01-31
Maturity Price : 25.00
Evaluated at bid price : 24.20
Bid-YTW : 5.17 %
HSE.PR.A FixedReset 74,639 RBC crossed 46,200 at 19.55.
YTW SCENARIO
Maturity Type : Limit Maturity
Maturity Date : 2044-12-19
Maturity Price : 19.66
Evaluated at bid price : 19.66
Bid-YTW : 3.99 %
BMO.PR.S FixedReset 63,578 RBC crossed 50,000 at 25.53.
YTW SCENARIO
Maturity Type : Limit Maturity
Maturity Date : 2044-12-19
Maturity Price : 23.36
Evaluated at bid price : 25.50
Bid-YTW : 3.51 %
There were 34 other index-included issues trading in excess of 10,000 shares.
Wide Spread Highlights
Issue Index Quote Data and Yield Notes
CGI.PR.D SplitShare Quote: 25.16 – 26.08
Spot Rate : 0.9200
Average : 0.7739

YTW SCENARIO
Maturity Type : Soft Maturity
Maturity Date : 2023-06-14
Maturity Price : 25.00
Evaluated at bid price : 25.16
Bid-YTW : 3.69 %

IAG.PR.A Deemed-Retractible Quote: 23.41 – 23.99
Spot Rate : 0.5800
Average : 0.4533

YTW SCENARIO
Maturity Type : Hard Maturity
Maturity Date : 2025-01-31
Maturity Price : 25.00
Evaluated at bid price : 23.41
Bid-YTW : 5.44 %

RY.PR.L FixedReset Quote: 26.02 – 26.34
Spot Rate : 0.3200
Average : 0.2162

YTW SCENARIO
Maturity Type : Call
Maturity Date : 2019-02-24
Maturity Price : 25.00
Evaluated at bid price : 26.02
Bid-YTW : 3.30 %

FTS.PR.G FixedReset Quote: 24.86 – 25.19
Spot Rate : 0.3300
Average : 0.2354

YTW SCENARIO
Maturity Type : Limit Maturity
Maturity Date : 2044-12-19
Maturity Price : 23.23
Evaluated at bid price : 24.86
Bid-YTW : 3.44 %

BAM.PR.K Floater Quote: 16.55 – 16.95
Spot Rate : 0.4000
Average : 0.3074

YTW SCENARIO
Maturity Type : Limit Maturity
Maturity Date : 2044-12-19
Maturity Price : 16.55
Evaluated at bid price : 16.55
Bid-YTW : 3.17 %

NEW.PR.D SplitShare Quote: 32.17 – 33.09
Spot Rate : 0.9200
Average : 0.8327

YTW SCENARIO
Maturity Type : Call
Maturity Date : 2015-06-26
Maturity Price : 32.07
Evaluated at bid price : 32.17
Bid-YTW : 3.46 %