Archive for May, 2015

Low Spread FixedResets: April, 2015

Sunday, May 3rd, 2015

As noted in MAPF Portfolio Composition: April 2015, the fund now has a large allocation to FixedResets, mostly of relatively low spread.

Many of these were largely purchased with proceeds of sales of DeemedRetractibles from the same issuer; it is interesting to look at the price trend of some of the Straight/FixedReset pairs. We’ll start with GWO.PR.N / GWO.PR.I; the fund sold the latter to buy the former at a takeout of about $1.00 in mid-June, 2014; relative prices over the past year are plotted as:

GWOPRN_GWOPRI_bidDiff_150430
Click for Big

Given that the April month-end take-out was $5.69, this is clearly a trade that has not worked out very well.

In July, 2014, I reported sales of SLF.PR.D to purchase SLF.PR.G at a take-out of about $0.15:

SLFPRG_SLFPRD_bidDiff_150430
Click for Big

There were similar trades in August, 2014 (from SLF.PR.C) at a take-out of $0.35. The April month-end take-out (bid price SLF.PR.D less bid price SLF.PR.G) was $6.25, so that hasn’t worked very well either.

November saw the third insurer-based sector swap, as the fund sold MFC.PR.C to buy the FixedReset MFC.PR.F at a post-dividend-adjusted take-out of about $0.85 … given a February month-end take-out of about $5.29, that’s another regrettable trade, although another piece executed in December at a take-out of $1.57 has less badly.

MFCPRF_MFCPRC_bidDiff_150430
Click for Big

This trend is not restricted to the insurance sector, which I expect will become subject to NVCC rules in the relatively near future and are thus subject to the same redemption assumptions I make for DeemedRetractibles. Other pairs of interest are BAM.PR.X / BAM.PR.N:

BAMPRX_BAMPRN_bidDiff_150430
Click for Big

… and FTS.PR.H / FTS.PR.J:

FTSPRH_FTSPRJ_bidDiff_150430
Click for Big

… and PWF.PR.P / PWF.PR.S:

PWFPRP_PWFPRS_bidDiff_150430
Click for Big

I will agree that the fund’s trades highlighted in this post may be decried as cases of monumental bad timing, but I should point out that in May, 2014, the fund was 63.9% Straight / 9.5% FixedReset while in April 2015 the fund was 10% Straight / 85% FixedReset, FloatingReset and FixedFloater (The latter figures include allocations from those usually grouped as ‘Scraps’). Given that the indices are roughly 30% Straight / 60% FixedReset & FloatingReset, it is apparent that the fund was extremely overweighted in Straights / underweighted in FixedResets in May 2014 but this situation has now reversed. HIMIPref™ analytics have been heavily favouring low-spread issues and the fund’s holdings are overwhelmingly of this type.

Summarizing the charts above in tabular form, we see:

FixedReset Straight Take-out
December 2013
Take-out
MAPF Trade
Take-out
December 2014
Take-out March 2015 Take-out
April 2015
GWO.PR.N
3.65%+130
GWO.PR.I
4.5%
($0.04) $1.00 $2.95 $5.74 $5.69
SLF.PR.G
4.35%+141
SLF.PR.D
4.45%
($1.29) $0.25 $2.16 $6.16 $6.25
MFC.PR.F
4.20%+141
MFC.PR.C
4.50%
($1.29) $0.86 $1.20 $5.46 $5.35
BAM.PR.X
4.60%+180
BAM.PR.N
4.75%
($2.06)   $0.17 $4.76 $4.18
FTS.PR.H
4.25%+145
FTS.PR.J
4.75%
$0.60   $5.68 $8.86 $8.07
PWF.PR.P
4.40%+160
PWF.PR.S
4.80%
($0.67)   $3.00 $6.43 $6.50
The ‘Take-Out’ is the bid price of the Straight less the bid price of the FixedReset; approximate execution prices are used for the “MAPF Trade” column. Bracketted figures in the ‘Take-Out’ columns indicate a ‘Pay-Up’

There was not much change from March month-end to April month-end, although the charts show some great excitement in mid-March, with spreads widening dramatically. The following chart shows the normalized total return of the HIMIPref™ FixedReset index through the month:

FR_TRIV_150501
Click for Big

So why is all this happening? One should take care in explaining market movements, but it is my belief that in the latter half of 2013 we were dealing with the ‘taper tantrum’ – the market’s fears that Fed tapering and subsequent tapering would lead to massive spikes in yields; this led to a great preference for FixedResets over Straights. Now, with the economic news getting less inflationary with every news story and Europe and Japan desperately trying to reflate their sluggish economies, the market seems to think that these rate increases are still a long way off … leading to a great preference for Straights over FixedResets.

In addition, the graphs show a sharp spike in early December, during which the low-spread FixedResets were very badly hurt; I believe this to be due to a combination of tax-loss selling and a panicky response to the 29% reduction in the TRP.PR.A dividend.

And in January it just got worse with Canada yields plummeting after the Bank of Canada rate cut with speculation rife about future cuts although this slowly died away.

And in late March / early April it got worse again, with one commenter attributing at least some of the blame to the John Heinzl piece in which I pointed out the expected reduction in dividend payouts! Insofar as I am willing to guess what motivates ‘the market’, I will guess that the rally in the latter half of April is due to a feeling that the previously scheduled European deflation has been cancelled, which in turn encouraged an increase in Treasury yields which fed through to the Canadian market.

There was some good discussion about the declining phase in the comments to the January 29 market action report. I take the view that we’ve seen this show before: during the Credit Crunch, Floaters got hit extremely badly (to the point at which their fifteen year total return was negative) because (as far as I can make out) their dividend rate was dropping (as it was linked to Prime) while the yields on other perpetual preferred instruments were skyrocketing (due to credit concerns). Thus, at least some investors insisted on getting long term corporate yields from rates based (indirectly and with a lag, in the case of FixedResets) on short-term government policy rates. And it’s happening again!

Here’s the April performance for FixedResets that had a YTW Scenario of ‘To Perptuity’ at mid-month.:

FR_1MoPerf_150430
Click for Big

The end-of-month rally has been rather disorderly; correlations between Issue Reset Spread and monthly performance for April are basically zero.

MAPF Portfolio Composition: April 2015

Sunday, May 3rd, 2015

Turnover continued to be above average in April, at about 24%.

There is extreme segmentation in the marketplace, with OSFI’s NVCC rule changes in February 2011 having had the effect of splitting the formerly relatively homogeneous Straight Perpetual class of preferreds into three parts:

  • Unaffected Straight Perpetuals
  • DeemedRetractibles explicitly subject to the rules (banks)
  • DeemedRetractibles considered by me, but not (yet!) by the market, to be likely to be explicitly subject to the rules in the future (insurers and insurance holding companies)

This segmentation, and the extreme valuation differences between the segments, has cut down markedly on the opportunities for trading. Another trend that hasn’t helped was the migration of PerpetualDiscounts into PerpetualPremiums (due to price increases) in early 2013 – many of the PerpetualPremiums had negative Yields-to-Worst and those that don’t aren’t particularly thrilling; speaking very generally, PerpetualPremiums are to be avoided, not traded! While market weakness since the peak of the PerpetualDiscount subindex in May, 2013, has mitigated the situation somewhat, the population of PerpetualDiscounts is still exceeded by that of PerpetualPremiums – most of which are trading at a negative Yield-to-Worst.

To make this more clear, it used to be that there were 70-odd Straight Perpetuals and I was more or less indifferent as to which ones I owned (subject, of course, to issuer concentration concerns and other risk management factors). Thus, if any one of these 70 were to go down in price by – say – $0.25, I would quite often have something in inventory that I’d be willing to swap for it. The segmentation means that I am no longer indifferent; in addition to checking the valuation of a potential buy to other Straights, I also have to check its peer group. This cuts down on the potential for trading.

There is no real hope that this situation will be corrected in the near-term. OSFI has indicated that the long-promised “Draft Definition of Capital” for insurers will not be issued “for public consultation in late 2012 or early 2013”, as they fear that it might encourage speculation in the marketplace. It is not clear why OSFI is so afraid of informed speculation, since the constant speculation in the marketplace is currently less informed than it would be with a little bit of regulatory clarity.

As a result of this delay, I have extended the Deemed Maturity date for insurers and insurance holding companies by three years (to 2025-1-31), in the expectation that when OSFI finally does provide clarity, they will allow the same degree of lead-in time for these companies as they did for banks. This had a major effect on the durations of preferred shares subject to the change but, fortunately, not much on their calculated yields as most of these issues were either trading near par when the change was made or were trading at sufficient premium that a par call was expected on economic grounds. However, with the declines in the market over the past nine months, the expected capital gain on redemption of the insurance-issued DeemedRetractibles has become an important component of the calculated yield.

Due to further footdragging by OSFI, I will be extending the DeemedMaturity date for insurance issues by another two years in the near future.

Sectoral distribution of the MAPF portfolio on April 30 was as follows:

MAPF Sectoral Analysis 2015-4-30
HIMI Indices Sector Weighting YTW ModDur
Ratchet 0% N/A N/A
FixFloat 0% N/A N/A
Floater 0% N/A N/A
OpRet 0% N/A N/A
SplitShare 3.5% (-5.0) 4.93% 5.51
Interest Rearing 0% N/A N/A
PerpetualPremium 0% N/A N/A
PerpetualDiscount 1.0% (0) 5.29% 14.94
Fixed-Reset 68.3% (+18.9) 5.09% 10.55
Deemed-Retractible 10.0% (-11.4) 5.28% 7.76
FloatingReset 7.1% (0) 3.42% 18.69
Scraps (Various) 10.1% (-2.7) 5.86% 14.28
Cash 0% (+0.1) 0.00% 0.00
Total 100% 5.06% 11.05
Totals and changes will not add precisely due to rounding. Bracketted figures represent change from February month-end. Cash is included in totals with duration and yield both equal to zero.
DeemedRetractibles are comprised of all Straight Perpetuals (both PerpetualDiscount and PerpetualPremium) issued by BMO, BNS, CM, ELF, GWO, HSB, IAG, MFC, NA, RY, SLF and TD, which are not exchangable into common at the option of the company. These issues are analyzed as if their prospectuses included a requirement to redeem at par on or prior to 2022-1-31 (banks) or 2025-1-3 (insurers and insurance holding companies), in addition to the call schedule explicitly defined. See OSFI Does Not Grandfather Extant Tier 1 Capital, CM.PR.D, CM.PR.E, CM.PR.G: NVCC Status Confirmed and the January, February, March and June, 2011, editions of PrefLetter for the rationale behind this analysis. (all recent editions have a short summary of the argument included in the “DeemedRetractible” section)

Note that the estimate for the time this will become effective for insurers and insurance holding companies was extended by three years in April 2013, due to the delays in OSFI’s providing clarity on the issue.

The “total” reflects the un-leveraged total portfolio (i.e., cash is included in the portfolio calculations and is deemed to have a duration and yield of 0.00.). MAPF will often have relatively large cash balances, both credit and debit, to facilitate trading. Figures presented in the table have been rounded to the indicated precision.

The big shift during the month was from DeemedRetractibles into FixedResets; there were a number of trades; the following table excludes trades taken as a result of portfolio cash flows. So please make careful note that this is not a complete list; that many of the prices are averages of trades performed on different days; that some of the issues were both bought and sold during the month and that, basically, anybody trying to reconstruct the MAPF portfolio with any precision with the help of this table is going to get extremely frustrated. This table has been prepared to give the ‘flavour’ of the month’s trading; you will have to wait for detail to be published with the semi-annual financials in July if you’re extremely interested. Have I made enough disclaimers yet?

Major Position Changes
Issue Portfolio Weight Average Price Sector DBRS Rating
Net Purchases
HSE.PR.A 1% 16.66 FixedReset Pfd-2(low)
PWF.PR.P 2% 17.70 FixedReset Pfd-1(low)
BNS.PR.Z 6% 23.35 FixedReset Pfd-1(low)
BMO.PR.Q 3% 22.60 FixedReset Pfd-2(high)
BAM.PR.X 1% 18.50 FixedReset Pfd-2(low)
AIM.PR.A 1% 19.60 FixedReset (Scraps) Pfd-3(low)
INE.PR.A 1% 15.80 FixedReset (Scraps) P-3(low)
(S&P)
Net Sales
SLF.PR.C 2% 23.55 DeemedRetractible Pfd-2(high)
IAG.PR.A 6% 24.66 DeemedRetractible Pfd-2(high)
CGI.PR.D 2% 25.25 SplitShare Pfd-1(high)
GWO.PR.I 2% 24.20 DeemedRetractible Pfd-1(low)
AX.PR.E 1% 17.75 Scraps (FixedReset) Pfd-3(low)
DF.PR.A 1% 10.20 Scraps (SplitShare) Pfd-3(low)
FTN.PR.A 1% 10.11 Scraps (SplitShare) Pfd-4(high)
PVS.PR.D 3% 24.60 SplitShare Pfd-2(low)
BNS.PR.Y 1% 22.40 FixedReset Pfd-2(high)

Credit distribution is:

MAPF Credit Analysis 2015-4-30
DBRS Rating Weighting
Pfd-1 0 (0)
Pfd-1(low) 18.9% (-2.1)
Pfd-2(high) 35.5% (+2.3)
Pfd-2 0%
Pfd-2(low) 35.5% (+0.5)
Pfd-3(high) 1.8% (+0.5)
Pfd-3 4.4% (0)
Pfd-3(low) 3.3% (-0.7)
Pfd-4(high) 0% (-0.7)
Pfd-4 0%
Pfd-4(low) 0% (0)
Pfd-5(high) 0% (0)
Pfd-5 0.5% (0)
Cash 0% (+0.1)
Totals will not add precisely due to rounding. Bracketted figures represent change from March month-end.
The fund holds a position in AZP.PR.C, which is rated P-5 by S&P and is unrated by DBRS
A position held in NPI.PR.A is not rated by DBRS, but has been included as “Pfd-3(high)” in the above table on the basis of its S&P rating of P-3(high).
A position held in INE.PR.A is not rated by DBRS, but has been included as “Pfd-3” in the above table on the basis of its S&P rating of P-3.

The credit quality changes are largely explained by the table of issues with major weighting changes, above.

Liquidity Distribution is:

MAPF Liquidity Analysis 2015-4-30
Average Daily Trading Weighting
<$50,000 2.6% (-7.6)
$50,000 – $100,000 2.2% (-0.8)
$100,000 – $200,000 32.5% (-6.4)
$200,000 – $300,000 41.7% (+7.3)
>$300,000 20.9% (+7.3)
Cash 0% (+0.1)
Totals will not add precisely due to rounding. Bracketted figures represent change from March month-end.

MAPF is, of course, Malachite Aggressive Preferred Fund, a “unit trust” managed by Hymas Investment Management Inc. Further information and links to performance, audited financials and subscription information are available the fund’s web page. The fund may be purchased either directly from Hymas Investment Management or through a brokerage account at Odlum Brown Limited. A “unit trust” is like a regular mutual fund, but is sold by offering memorandum rather than prospectus. This is cheaper, but means subscription is restricted to “accredited investors” (as defined by the Ontario Securities Commission) or those who subscribe for $150,000+ (this exemption is about to expire). Fund past performances are not a guarantee of future performance. You can lose money investing in MAPF or any other fund.

A similar portfolio composition analysis has been performed on the Claymore Preferred Share ETF (symbol CPD) (and other funds) as of August 31, 2012, and published in the October (mainly methodology), November (most funds), and December (ZPR) 2012, PrefLetter. While direct comparisons are difficult due to the introduction of the DeemedRetractible class of preferred share (see above) it is fair to say:

  • MAPF credit quality is better
  • MAPF liquidity is a bit lower
  • MAPF Yield is higher
  • Weightings
    • MAPF is less exposed to Straight Perpetuals (including DeemedRetractibles)
    • MAPF is less exposed to Operating Retractibles
    • MAPF is more exposed to SplitShares
    • MAPF is less exposed to FixFloat / Floater / Ratchet
    • MAPF is overweighted in FixedResets

TLM.PR.A To Be Acquired At $25.00 May 8

Saturday, May 2nd, 2015

Talisman Energy Inc. has announced:

that the completion of the acquisition of Talisman by Repsol S.A. is scheduled to occur on May 8, 2015. Regulatory approvals required under the arrangement agreement with Repsol have been obtained. The completion of the transaction remains subject to the satisfaction of customary closing deliverables.

The deal was announced in December and approved by shareholders in February.

TLM.PR.A is a FixedReset, 4.20%+277, that commenced trading 2011-12-13 after being announced 2011-12-5.

Update, 2015-5-9: Done:

Talisman Energy Inc. (TSX:TLM) (NYSE:TLM) announces that the acquisition of Talisman by Repsol S.A. by way of an arrangement under the Canada Business Corporations Act has been completed.

Under the arrangement, a wholly-owned subsidiary of Repsol has acquired all of the outstanding common shares of Talisman at a price of US $8.00 per share and all of the outstanding preferred shares of Talisman at a price of CDN $25.1093 (representing CDN $25.00 plus accrued and unpaid dividends) per share.

With the completion of the arrangement, the common shares will be delisted from the Toronto Stock Exchange and the New York Stock Exchange, and the preferred shares will be delisted from the Toronto Stock Exchange.

May 1, 2015

Saturday, May 2nd, 2015

The CME’s Department of Selective Enforcement has decided to make a sudden fuss about spoofing and two guys have been scapegoated:

CME Group Inc. said it suspended two traders for placing manipulative trades similar to the ones that catapulted Navinder Singh Sarao into headlines around the world last week.

Heet Khara and Nasim Salim engaged in a practice called “layering,” in which orders are placed with no intention of following through on them, according to CME, the owner of the futures exchange where the two gold and silver traders did business. Khara and Salim are barred from trading on CME markets for 60 days.

However, the trivial nature of the transgression is illustrated by the fact that they only face a 60 day trading ban. Have a nice holiday guys … unless, of course, you hire somebody else to push the buttons with the assistance of your advice. The ZeroHedge blog considers the affair to be scapegoating and window-dressing with a hint of racism.

Anti-Spoofing regulations are unenforceable and spoofing does no direct harm to the interests of fundamental traders (indirect harm, through a thinning of the markets, is possible but I have not seen evidence of this). Anti-spoofing regulations should be repealed; I suspect that consequent private sector development of counter-spoofing tactics will be far more effective than any amount of regulation could ever possibly be.

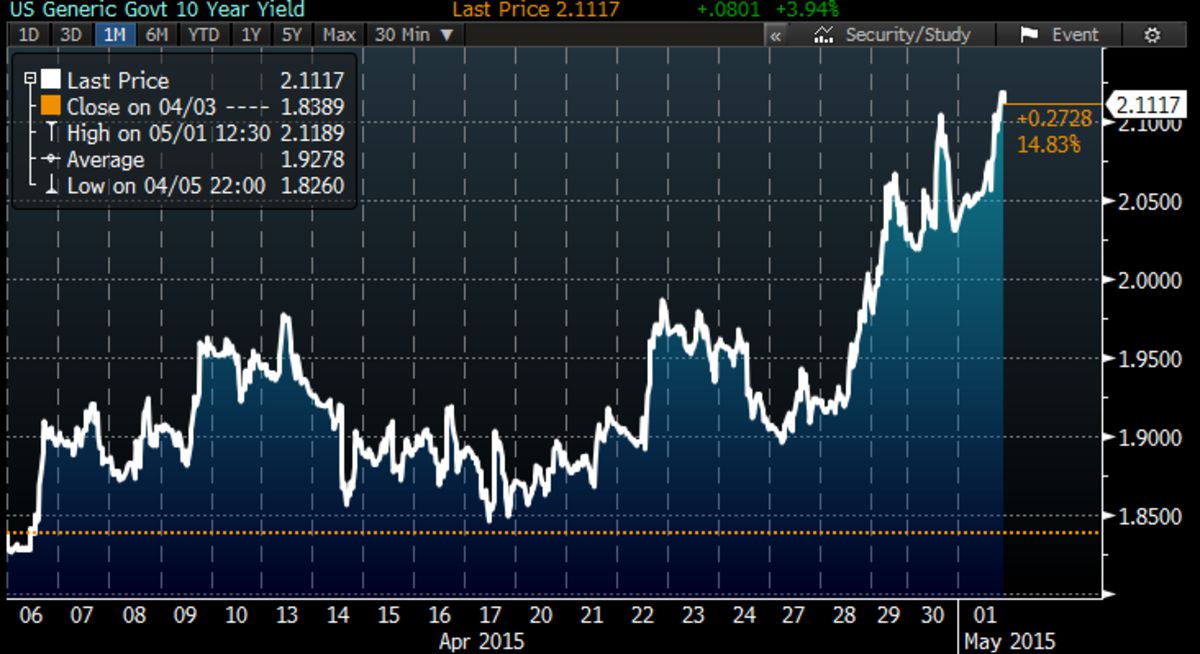
Holy smokaramaville, but it’s been a week and half for the fixed income markets! Bloomberg notes that it’s been the worst week in almost two months (put that way, it sounds pretty routine, doesn’t it?):

The worst week for U.S. 10-year notes in almost two months got even bleaker as a rout in European bonds continued to diminish investor appetite for relatively higher U.S. yields. The notes also extended an April decline after a report showed U.S. consumer confidence rose last month.

Treasury 10-year yields rose eight basis points, or 0.08 percentage point, to 2.11 percent as of 5 p.m. New York time. It touched 2.12 percent, the highest since March 13, based on Bloomberg Bond Trader data. The benchmark 2 percent note due in February 2025 fell 23/32, or $7.19 per $1,000 face amount, to 99.

Ten-year yields climbed 20 basis points this week, the most since the week ending March 6, and are up from 1.92 percent at the start of April.

U.S. debt extended losses after the University of Michigan said Friday that its final consumer-confidence index for April increased to 95.9 from 93 in March. The median projection in a Bloomberg survey of economists was for 96.

That followed a series of weak first-quarter economic readings that the Fed this week blamed on “transitory” factors including brutal winter weather in much of the U.S. Fed Chair Janet Yellen and her colleagues reiterated in a statement on April 29 after a two-day meeting that they believe growth will pick up to a “moderate pace”.

Euro-area debt started selling off early in the week and reached a peak on April 29, when 55 billion euros ($62 billion) was wiped off the value of the region’s government bonds on the day.

The extra yield that investors get for holding Treasury 10-year notes instead of similar-maturity German bunds narrowed to 167 basis points on Thursday, the least on a closing basis since April 3.

… and the chart:

1200x-1
Click for Big

This is despite the moderating influence of hedge fund activity:

They don’t think it will last.

Hedge-fund managers and other large speculators who saw the start or this week’s bond rout nevertheless moved in the opposite direction, trimming bearish bets on 10-year notes to the lowest level in 10 weeks.

Net shorts on the securities totaled 98,565 contracts as of April 28, down from 153,366 the week before, according to Commodity Futures Trading Commission data.

It would be most interesting to learn whether hedge-fund activity is generally counterflow. I suspect it is, given that reversion is what quants do best, but I am not aware of any research on this.

And all this affected Canada. According to the BoC, five-year Canadas were trading at 0.71% last Friday, and according to Perimeter they ended this week at 1.04%. That’s a hell of a move for a five year sovereign – although not quite so fast as the descent in January when the overnight rate got cut.

What’s driving it, I think, is that as discussed yesterday, the previously announced European deflation has been cancelled. So markets which were expecting low rates forever are now expecting high rates forever … and this has certainly had an effect in the preferred share market, as previous panic over continued reductions in FixedReset dividends on reset have, at the very least, been moderated.

But we’ll see what next week brings. The market does what it wants to do when it wants to do it. For what it’s worth, I believe that the current situation of 5-year governments trading below inflation to be unsustainable, a very useful word for financial analysis since it doesn’t mean anything. I will opine that I believe the paradox will be resolved by an increase in sovereign yields (rather than a decline in inflation), but I would not dream of predicting just exactly when this might occur.

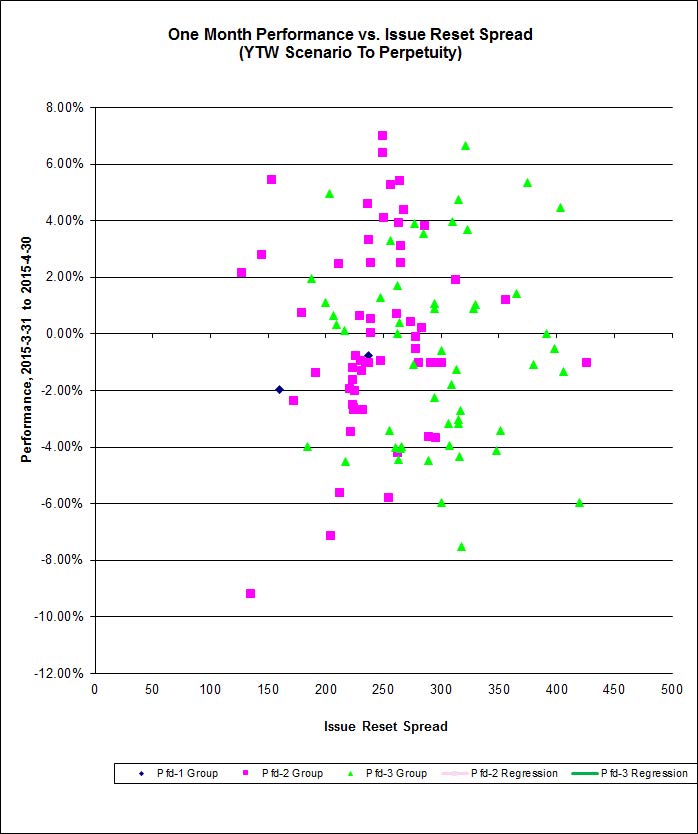
Still, the violent change in sentiment made it a wild month for FixedResets!

FR_TRIV_150501
Click for Big

Look at all the fun you had in April and it didn’t cost you anything!

It was an unevenly strong day for the Canadian preferred share market, with PerpetualDiscounts up 30bp, FixedResets winning 64bp and DeemedRetractibles gaining 3bp. The Performance Highlights table is, as one might expect, dominated by winning FixedResets. Volume was below average.

For as long as the FixedReset market is so violently unsettled, I’ll keep publishing updates of the more interesting and meaningful series of FixedResets’ Implied Volatilities. This doesn’t include Enbridge because although Enbridge has a large number of issues outstanding, all of which are quite liquid, the range of Issue Reset Spreads is too small for decent conclusions. The low is 212bp (ENB.PR.H; second-lowest is ENB.PR.D at 237bp) and the high is a mere 268 for ENB.PF.G.

Remember that all rich /cheap assessments are:
» based on Implied Volatility Theory only
» are relative only to other FixedResets from the same issuer
» assume constant GOC-5 yield
» assume constant Implied Volatility
» assume constant spread
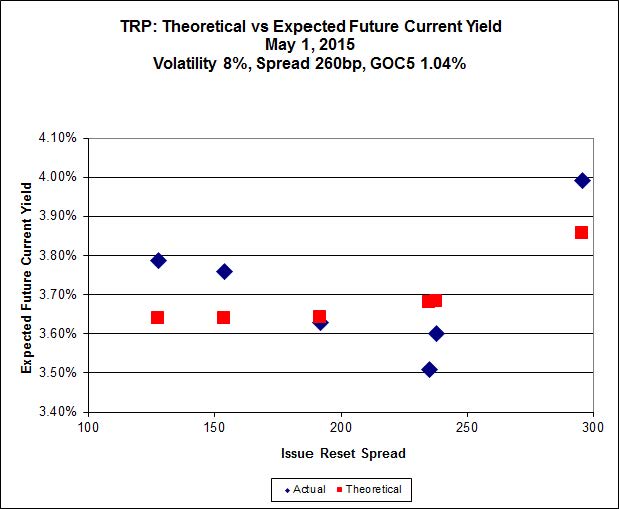
Here’s TRP:

impVol_TRP_150501
Click for Big

TRP.PR.E, which resets 2019-10-30 at +235, is bid at 24.15 to be $1.11 rich, while TRP.PR.G, resetting 2020-11-30 at +296, is $0.88 cheap at its bid price of 25.05.

impVol_MFC_150501
Click for Big

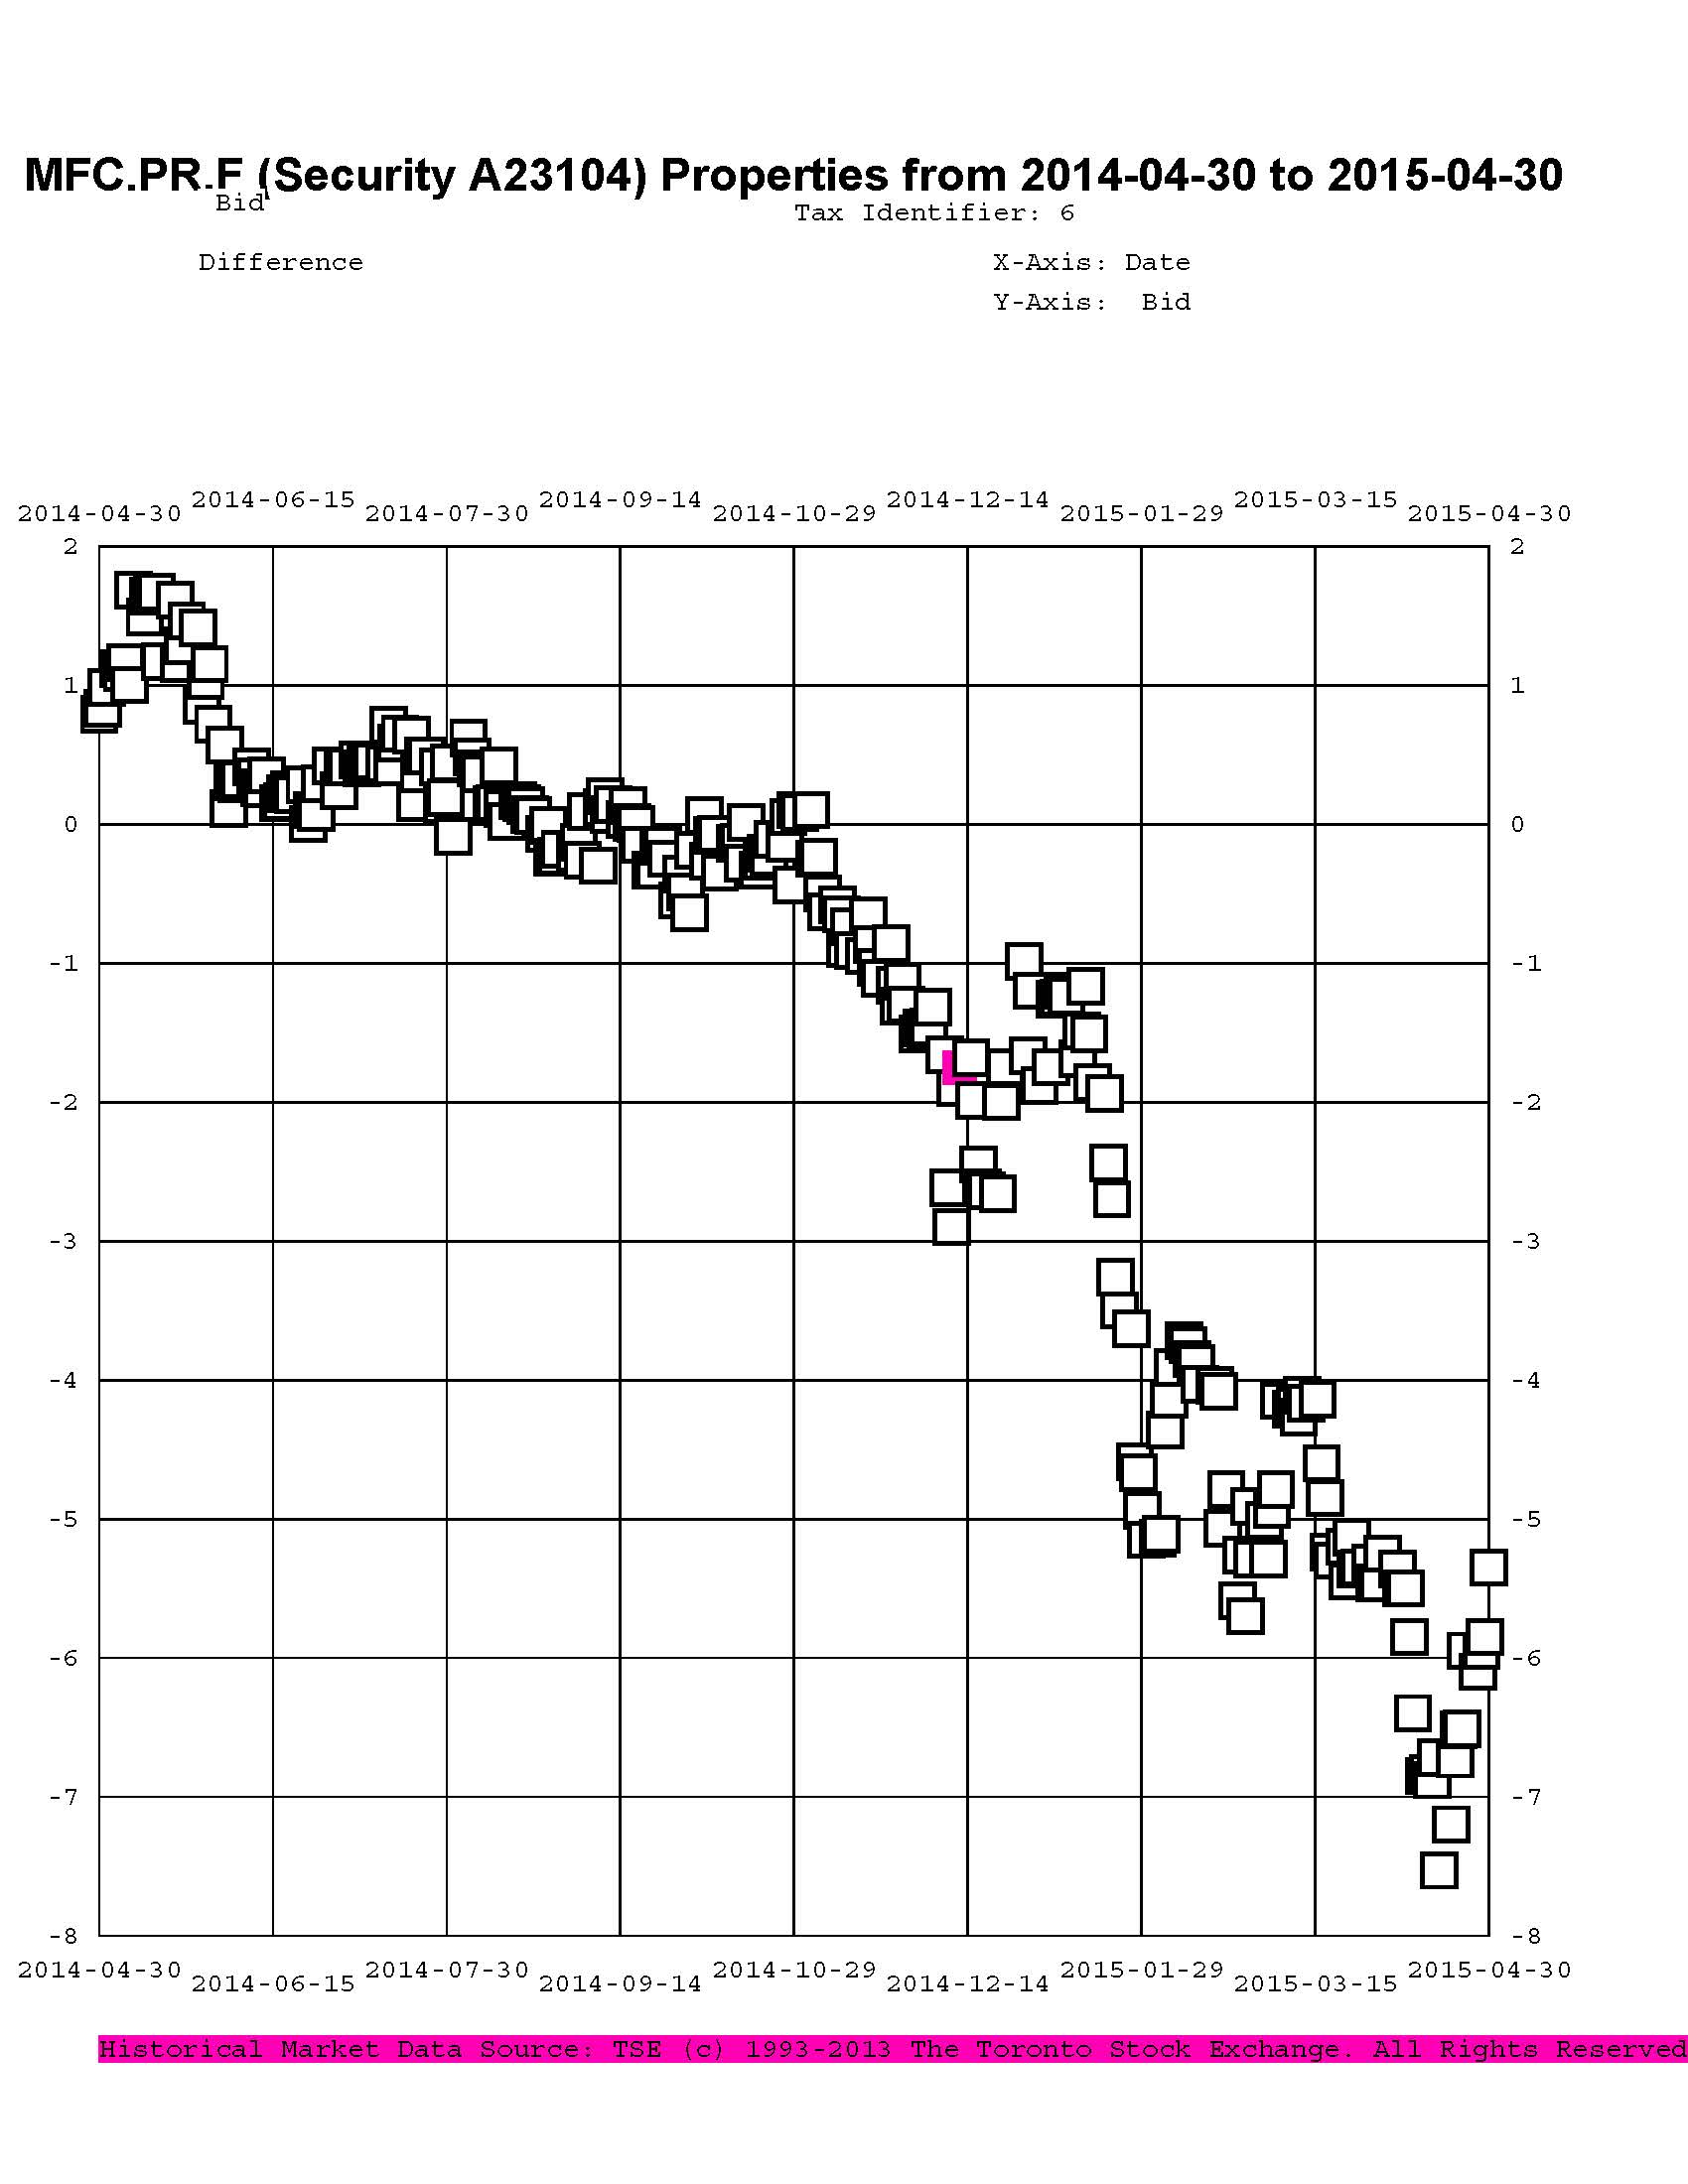
Another excellent fit, but the numbers are perplexing. Implied Volatility for MFC continues to be a conundrum. It is still too high if we consider that NVCC rules will never apply to these issues; it is still too low if we consider them to be NVCC non-compliant issues (and therefore with Deemed Maturities in the call schedule).

Most expensive is MFC.PR.L, resetting at +216 on 2019-6-19, bid at 23.30 to be $0.40 rich, while MFC.PR.H, resetting at +313bp on 2017-3-19, is bid at 25.41 to be $0.53 cheap.

impVol_BAM_150501
Click for Big

The cheapest issue relative to its peers is BAM.PF.B, resetting at +263bp on 2019-3-31, bid at 22.45 to be $0.61 cheap. BAM.PR.X, resetting at +180bp 2017-6-30 is bid at 18.75 and appears to be $0.82 rich.
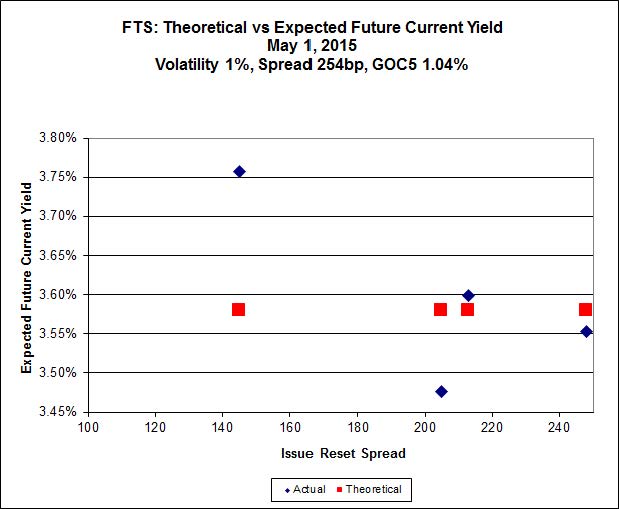
impVol_FTS_150501
Click for Big

FTS.PR.H, with a spread of +145bp, and bid at 16.57, looks $0.82 cheap and resets 2015-6-1. FTS.PR.K, with a spread of +205bp and resetting 2019-3-1, is bid at 22.22 and is $0.64 rich.

pairs_FR_150501
Click for Big

Investment-grade pairs now predict an average over the next five years of about 0.25%, but TRP.PR.A / TRP.PR.F is an outlier at -0.33%. The DC.PR.B / DC.PR.D pair retains its customary outlier status, with a breakeven rate of -1.27%. The new data point for BRF.PR.A / BRF.PR.B cannot be considered reliable.

pairs_FF_150501
Click for Big

Shall we just say that this exhibits a high level of confidence in the continued rapacity of Canadian banks?

HIMIPref™ Preferred Indices
These values reflect the December 2008 revision of the HIMIPref™ Indices

Values are provisional and are finalized monthly
Index Mean
Current
Yield
(at bid)
Median
YTW
Median
Average
Trading
Value
Median
Mod Dur
(YTW)
Issues Day’s Perf. Index Value
Ratchet 0.00 % 0.00 % 0 0.00 0 0.9600 % 2,296.3
FixedFloater 0.00 % 0.00 % 0 0.00 0 0.9600 % 4,015.1
Floater 3.16 % 3.25 % 54,172 19.09 4 0.9600 % 2,441.2
OpRet 4.42 % -4.62 % 37,871 0.09 2 -0.0197 % 2,765.3
SplitShare 4.57 % 4.76 % 68,324 3.37 3 -0.2663 % 3,223.3
Interest-Bearing 0.00 % 0.00 % 0 0.00 0 -0.0197 % 2,528.6
Perpetual-Premium 5.45 % -0.79 % 68,911 0.08 18 0.0676 % 2,520.1
Perpetual-Discount 5.03 % 4.99 % 115,903 15.41 15 0.3046 % 2,785.9
FixedReset 4.40 % 3.73 % 276,479 16.74 86 0.6384 % 2,409.2
Deemed-Retractible 4.93 % 2.99 % 112,826 0.24 36 0.0343 % 2,648.1
FloatingReset 2.59 % 2.96 % 71,981 6.21 7 -0.1222 % 2,320.2
Performance Highlights
Issue Index Change Notes
BAM.PF.B FixedReset -1.32 % YTW SCENARIO
Maturity Type : Limit Maturity
Maturity Date : 2045-05-01
Maturity Price : 22.00
Evaluated at bid price : 22.45
Bid-YTW : 4.07 %
FTS.PR.K FixedReset 1.00 % YTW SCENARIO
Maturity Type : Limit Maturity
Maturity Date : 2045-05-01
Maturity Price : 21.85
Evaluated at bid price : 22.22
Bid-YTW : 3.54 %
ENB.PR.Y FixedReset 1.00 % YTW SCENARIO
Maturity Type : Limit Maturity
Maturity Date : 2045-05-01
Maturity Price : 20.14
Evaluated at bid price : 20.14
Bid-YTW : 4.32 %
RY.PR.L FixedReset 1.01 % YTW SCENARIO
Maturity Type : Call
Maturity Date : 2019-02-24
Maturity Price : 25.00
Evaluated at bid price : 25.90
Bid-YTW : 3.19 %
TRP.PR.D FixedReset 1.06 % YTW SCENARIO
Maturity Type : Limit Maturity
Maturity Date : 2045-05-01
Maturity Price : 22.74
Evaluated at bid price : 23.75
Bid-YTW : 3.51 %
ENB.PF.A FixedReset 1.19 % YTW SCENARIO
Maturity Type : Limit Maturity
Maturity Date : 2045-05-01
Maturity Price : 21.75
Evaluated at bid price : 22.14
Bid-YTW : 4.27 %
MFC.PR.J FixedReset 1.20 % YTW SCENARIO
Maturity Type : Hard Maturity
Maturity Date : 2025-01-31
Maturity Price : 25.00
Evaluated at bid price : 24.52
Bid-YTW : 3.97 %
NA.PR.W FixedReset 1.26 % YTW SCENARIO
Maturity Type : Limit Maturity
Maturity Date : 2045-05-01
Maturity Price : 22.83
Evaluated at bid price : 24.10
Bid-YTW : 3.33 %
MFC.PR.N FixedReset 1.28 % YTW SCENARIO
Maturity Type : Hard Maturity
Maturity Date : 2025-01-31
Maturity Price : 25.00
Evaluated at bid price : 23.70
Bid-YTW : 4.24 %
IAG.PR.G FixedReset 1.29 % YTW SCENARIO
Maturity Type : Hard Maturity
Maturity Date : 2025-01-31
Maturity Price : 25.00
Evaluated at bid price : 25.20
Bid-YTW : 3.82 %
BAM.PR.B Floater 1.31 % YTW SCENARIO
Maturity Type : Limit Maturity
Maturity Date : 2045-05-01
Maturity Price : 15.44
Evaluated at bid price : 15.44
Bid-YTW : 3.25 %
BNS.PR.R FixedReset 1.31 % YTW SCENARIO
Maturity Type : Hard Maturity
Maturity Date : 2022-01-31
Maturity Price : 25.00
Evaluated at bid price : 25.47
Bid-YTW : 3.04 %
ENB.PF.G FixedReset 1.35 % YTW SCENARIO
Maturity Type : Limit Maturity
Maturity Date : 2045-05-01
Maturity Price : 22.02
Evaluated at bid price : 22.60
Bid-YTW : 4.22 %
PWF.PR.P FixedReset 1.37 % YTW SCENARIO
Maturity Type : Limit Maturity
Maturity Date : 2045-05-01
Maturity Price : 18.50
Evaluated at bid price : 18.50
Bid-YTW : 3.47 %
BNS.PR.Z FixedReset 1.39 % YTW SCENARIO
Maturity Type : Hard Maturity
Maturity Date : 2022-01-31
Maturity Price : 25.00
Evaluated at bid price : 23.30
Bid-YTW : 3.55 %
TD.PF.C FixedReset 1.48 % YTW SCENARIO
Maturity Type : Limit Maturity
Maturity Date : 2045-05-01
Maturity Price : 22.82
Evaluated at bid price : 24.06
Bid-YTW : 3.31 %
FTS.PR.F Perpetual-Discount 1.51 % YTW SCENARIO
Maturity Type : Limit Maturity
Maturity Date : 2045-05-01
Maturity Price : 24.57
Evaluated at bid price : 24.80
Bid-YTW : 5.01 %
ENB.PR.N FixedReset 1.61 % YTW SCENARIO
Maturity Type : Limit Maturity
Maturity Date : 2045-05-01
Maturity Price : 21.45
Evaluated at bid price : 21.45
Bid-YTW : 4.28 %
BAM.PR.K Floater 1.68 % YTW SCENARIO
Maturity Type : Limit Maturity
Maturity Date : 2045-05-01
Maturity Price : 15.16
Evaluated at bid price : 15.16
Bid-YTW : 3.31 %
ENB.PR.H FixedReset 1.68 % YTW SCENARIO
Maturity Type : Limit Maturity
Maturity Date : 2045-05-01
Maturity Price : 18.76
Evaluated at bid price : 18.76
Bid-YTW : 4.30 %
BAM.PR.X FixedReset 1.79 % YTW SCENARIO
Maturity Type : Limit Maturity
Maturity Date : 2045-05-01
Maturity Price : 18.75
Evaluated at bid price : 18.75
Bid-YTW : 3.89 %
BAM.PF.E FixedReset 1.80 % YTW SCENARIO
Maturity Type : Limit Maturity
Maturity Date : 2045-05-01
Maturity Price : 22.35
Evaluated at bid price : 23.13
Bid-YTW : 3.94 %
BAM.PR.R FixedReset 1.88 % YTW SCENARIO
Maturity Type : Limit Maturity
Maturity Date : 2045-05-01
Maturity Price : 20.55
Evaluated at bid price : 20.55
Bid-YTW : 4.06 %
MFC.PR.M FixedReset 2.13 % YTW SCENARIO
Maturity Type : Hard Maturity
Maturity Date : 2025-01-31
Maturity Price : 25.00
Evaluated at bid price : 24.00
Bid-YTW : 4.15 %
BAM.PR.T FixedReset 2.21 % YTW SCENARIO
Maturity Type : Limit Maturity
Maturity Date : 2045-05-01
Maturity Price : 20.80
Evaluated at bid price : 20.80
Bid-YTW : 4.03 %
ENB.PR.D FixedReset 2.36 % YTW SCENARIO
Maturity Type : Limit Maturity
Maturity Date : 2045-05-01
Maturity Price : 20.35
Evaluated at bid price : 20.35
Bid-YTW : 4.20 %
CIU.PR.C FixedReset 2.37 % YTW SCENARIO
Maturity Type : Limit Maturity
Maturity Date : 2045-05-01
Maturity Price : 16.43
Evaluated at bid price : 16.43
Bid-YTW : 3.59 %
HSE.PR.A FixedReset 2.76 % YTW SCENARIO
Maturity Type : Limit Maturity
Maturity Date : 2045-05-01
Maturity Price : 16.75
Evaluated at bid price : 16.75
Bid-YTW : 4.05 %
MFC.PR.L FixedReset 3.56 % YTW SCENARIO
Maturity Type : Hard Maturity
Maturity Date : 2025-01-31
Maturity Price : 25.00
Evaluated at bid price : 23.30
Bid-YTW : 4.37 %
ENB.PR.B FixedReset 3.91 % YTW SCENARIO
Maturity Type : Limit Maturity
Maturity Date : 2045-05-01
Maturity Price : 20.20
Evaluated at bid price : 20.20
Bid-YTW : 4.22 %
SLF.PR.G FixedReset 3.98 % YTW SCENARIO
Maturity Type : Hard Maturity
Maturity Date : 2025-01-31
Maturity Price : 25.00
Evaluated at bid price : 17.75
Bid-YTW : 6.39 %
Volume Highlights
Issue Index Shares
Traded
Notes
SLF.PR.G FixedReset 94,480 RBC bought two blocks from Nesbitt: 16,700 at 17.00 and 22,600 at 17.20.
YTW SCENARIO
Maturity Type : Hard Maturity
Maturity Date : 2025-01-31
Maturity Price : 25.00
Evaluated at bid price : 17.75
Bid-YTW : 6.39 %
ENB.PR.B FixedReset 80,049 RBC crossed 19,300 at 19.45.
YTW SCENARIO
Maturity Type : Limit Maturity
Maturity Date : 2045-05-01
Maturity Price : 20.20
Evaluated at bid price : 20.20
Bid-YTW : 4.22 %
BMO.PR.J Deemed-Retractible 78,100 Called for redemption.
YTW SCENARIO
Maturity Type : Call
Maturity Date : 2015-05-31
Maturity Price : 25.25
Evaluated at bid price : 25.22
Bid-YTW : 2.35 %
TD.PF.C FixedReset 59,208 Desjardins crossed 38,200 at 24.04.
YTW SCENARIO
Maturity Type : Limit Maturity
Maturity Date : 2045-05-01
Maturity Price : 22.82
Evaluated at bid price : 24.06
Bid-YTW : 3.31 %
RY.PR.C Deemed-Retractible 41,600 Nesbitt bought four blocks of 10,000 each from anonymous, all at 25.16.
YTW SCENARIO
Maturity Type : Call
Maturity Date : 2015-11-24
Maturity Price : 25.00
Evaluated at bid price : 25.12
Bid-YTW : 3.22 %
CM.PR.Q FixedReset 31,700 Nesbitt crossed 25,000 at 25.00.
YTW SCENARIO
Maturity Type : Limit Maturity
Maturity Date : 2045-05-01
Maturity Price : 23.09
Evaluated at bid price : 24.85
Bid-YTW : 3.59 %
There were 23 other index-included issues trading in excess of 10,000 shares.
Wide Spread Highlights
Issue Index Quote Data and Yield Notes
CIU.PR.C FixedReset Quote: 16.43 – 17.25
Spot Rate : 0.8200
Average : 0.6700

YTW SCENARIO
Maturity Type : Limit Maturity
Maturity Date : 2045-05-01
Maturity Price : 16.43
Evaluated at bid price : 16.43
Bid-YTW : 3.59 %

CU.PR.D Perpetual-Discount Quote: 24.86 – 25.25
Spot Rate : 0.3900
Average : 0.2449

YTW SCENARIO
Maturity Type : Limit Maturity
Maturity Date : 2045-05-01
Maturity Price : 24.40
Evaluated at bid price : 24.86
Bid-YTW : 4.98 %

ENB.PR.P FixedReset Quote: 20.73 – 21.09
Spot Rate : 0.3600
Average : 0.2225

YTW SCENARIO
Maturity Type : Limit Maturity
Maturity Date : 2045-05-01
Maturity Price : 20.73
Evaluated at bid price : 20.73
Bid-YTW : 4.29 %

ENB.PR.T FixedReset Quote: 20.61 – 20.94
Spot Rate : 0.3300
Average : 0.2032

YTW SCENARIO
Maturity Type : Limit Maturity
Maturity Date : 2045-05-01
Maturity Price : 20.61
Evaluated at bid price : 20.61
Bid-YTW : 4.33 %

ENB.PF.E FixedReset Quote: 22.15 – 22.43
Spot Rate : 0.2800
Average : 0.1814

YTW SCENARIO
Maturity Type : Limit Maturity
Maturity Date : 2045-05-01
Maturity Price : 21.74
Evaluated at bid price : 22.15
Bid-YTW : 4.29 %

GWO.PR.H Deemed-Retractible Quote: 24.63 – 24.90
Spot Rate : 0.2700
Average : 0.1749

YTW SCENARIO
Maturity Type : Hard Maturity
Maturity Date : 2025-01-31
Maturity Price : 25.00
Evaluated at bid price : 24.63
Bid-YTW : 5.13 %

BRF.PR.B Listed – No Action Despite 45% Conversion

Saturday, May 2nd, 2015

Not much to report here! BRF.PR.B, a FloatingReset +262 that has resulted from a partial conversion of BRF.PR.A but there were no trades and a $5.00 spread on the quote.

However, TMXMoney reports that there are 4,518,289 shares outstanding compared to 5,481,711 for BRF.PR.A, implying a 45% conversion rate, in line with the recent 42% rate for BNS.PR.Y / BNS.PR.D and 43% rate for AIM.PR.A / AIM.PR.G despite my exhortation to continue to hold the FixedReset half of the pair.

For what it’s worth, the bid on BRF.PR.B looks reasonable relative to the bid on BRF.PR.A, resulting in an implied averge 3-month bill rate of 0.06% which, while certainly subject to criticism, is not utterly ridiculous compared to other FixedReset / FloatingReset Strong Pairs:

pairs_FR_150501
Click for Big

Vital statistics (again, with the caveat that the quote has a ridiculous spread and is unsupported by any trading activity) are:

BRF.PR.B FloatingReset YTW SCENARIO
Maturity Type : Limit Maturity
Maturity Date : 2045-05-01
Maturity Price : 20.00
Evaluated at bid price : 20.00
Bid-YTW : 4.08 %

FFH: S&P Revises Outlook To Stable From Negative

Friday, May 1st, 2015

S&P revised the outlook on Fairfax Financial Holdings Inc. to Negative in February following the Brit acquisition, citing:

the significant potential decline in the group’s capital adequacy following the completion of the Brit PLC acquisition.

Today they gave the company’s capital plans their seal of approval:

  • •Fairfax Financial Holdings Ltd. will likely maintain very strong capital adequacy per our capital model.
  • •We are revising our outlook on Fairfax to stable from negative and affirming our ratings on Fairfax and its core insurance affiliates.
  • •The stable outlook reflects our view that the pending acquisition of Brit PLC will not have a significant adverse impact on the group’s capital adequacy.

Standard & Poor’s Ratings Services said today that it revised its outlook on Fairfax Financial Holdings Ltd. to stable from negative. At the same time, we affirmed our ‘BBB-‘ long-term counterparty credit rating on Fairfax and our ‘A-‘ long-term counterparty credit and financial strength ratings on its core insurance affiliates.

Our analysis of Fairfax’s acquisition and consolidation of Brit PLC and the associated capital-raising initiatives indicates that Fairfax’s capital adequacy is likely to remain at the ‘AA’ level. Although the company will have less of a cushion than it had as of year-end 2014, its capitalization remains consistent with our expectations.

The stable outlook is based on our view that the pending acquisition of Brit PLC will not have a significant adverse impact on the group’s capital adequacy after taking into account recent capital-raising initiatives and our expectations for organic capital growth during the next two years.

One of the methods Fairfax used to stabilize its capital levels was raising about $750-million in equities and preferreds. In addition – and perhaps more to the point – a 30% stake in Brit was conditionally sold to OMERS in mid-April:

Fairfax Financial Holdings Ltd. is bringing the Ontario Municipal Employees Retirement System in on its acquisitions of a specialty insurance company.

The two Toronto-based groups have entered into a memorandum of understanding where OMERS would take would take as much as a 30 per cent stake in Brit PLC, a specialty insurer that underwrites unique policies to protect against risks such as war and terrorism, satellite launch failures and the cancellations of sporting events. Brit is one of the largest insurers in the Lloyd’s of London marketplace, which connects global clients with insurance for complex and unusual risks.

Right now, OMERS has no investment in Brit shares. The new deal won’t clear until after Fairfax’s offer for Brit becomes unconditional in all respects, receives regulatory approvals and other conditions.

The agreement between Fairfax and OMERS also hinges on other requirements, such as those related to Brit’s dividend, exit provisions and other governance arrangements.

Fairfax has a number of preferred share issues outstanding: FFH.PR.C, FFH.PR.D, FFH.PR.E, FFH.PR.F, FFH.PR.G, FFH.PR.I, FFH.PR.K and FFH.PR.M.