I don’t, as a rule, like pseudo-analytical notes such as this post. Historical plots implicitly assume that the anything not intrinisic to the plot is constant; and in plotting historical yields there’s an entire economy being ignored which is most emphatically not constant.
But some people like them; I got curious; and Assiduous Readers (after yesterday‘s collapse) will want something cheerful to look at.
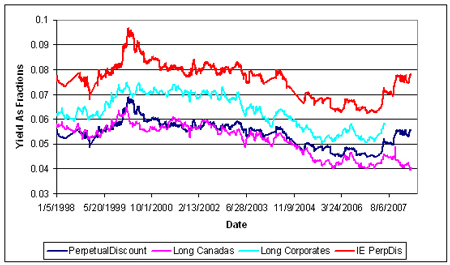
So … without further ado, here’s a plot of yields, going back 10 years. PerpetualDiscount yields are from the HIMIPref™ Index; other yields are courtesy of the Bank of Canada. The graphs get cut off at the end of March, 2008, because that’s the data I have convenient for the HIMIPref™ indices; Long Corporates get cut off in mid-2007, because that’s when the Bank stopped getting bond data with permission to redistribute freely.

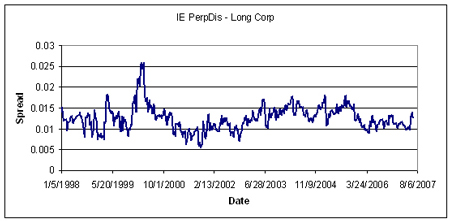
… and the Perpetual Discount Interest Equivalent Spread against Long Corporates (using a constant equivalency of 1.4x, which is fishy in the extreme):

So folks … we’re bloodied but unbowed! Spreads are (roughly) near a ten year high … recall my note of yesterday that PerpetualDiscounts now have an average yield of 6.00%; interest-equivalent (at 1.4x) of 8.40%; vs. Long Corporates of just under 6.2%.
6% +
RY, SLF , Pow, Pwf ….
Do not hesitate , do not be afraid , do not analyse to much , BUY !!
[…] out the spreads and update the graphs yourselves, ya bums! What am I, your […]
[…] post being referred to is Party Like It’s 1999!, in which I made the point that the interest-equivalent PerpetualDiscount spread was pretty close […]
[…] Party Like It’s 1999! for further discussion of the PerpetualDiscount Interest-Equivalent / Long Corporate […]
[…] a lot lately about how horrible June has been for preferred shareholders – see, for example, Party Like it’s 1999!, New Trough for Preferreds? and Market Timing?. And I will be posting more! Without wishing to rub […]
[…] the bright side, that 250bp represents a 10-year high and the previous high was very short-lived. We shall […]
[…] Another good strong day for PerpetualDiscounts, but volume was light. Have all the sportin’ gents placed their bets? Despite the gains, the index has not yet recovered to where it was July 11 … we’re still trying to recover from the awful, awful July 14, as Louis XVI used to say. The PerpetualDiscount weighted-mean-average pre-tax yield-to-worst is now 6.46%, or 9.04% pre-tax interest-equivalent at the standard 1.4x equivalency factor. Long Corporates now yield 6.20%, so the PTIE spread now stands at 284bp, still way through the old, recently smashed, record of 250bp. […]
[…] Well, a week-odd in to August and things are looking a little better! PerpetualDiscounts are up every day month-to-date, totalling 1.38%. They have had only one down-day (July 28) since the trough on July 16 and are now up 6.62% since trough-date. Average dividend yield is now 6.23%, equivalent to 8.72% interest for taxable holders with a 1.4x equivalency factor; long corporates now yield about 6.15% so the PTIE spread is 257bp … still above the previous ten-year high of 250bp. […]