April’s job-creation score was better, March was worse, and the U.S. jobless rate crept closer to the Federal Reserve’s moving target for full employment.
The 223,000 increase in payrolls last month followed a revised 85,000 gain in March that was the smallest since June 2012, figures from the Labor Department showed Friday in Washington. The jobless rate fell to 5.4 percent, the lowest since May 2008, from 5.5 percent.
…
Wage growth remained limited, with average hourly earnings rising 0.1 percent in April after a revised 0.2 percent March gain that was weaker than initially reported. The median forecast in a Bloomberg survey projected a 0.2 percent increase for last month.Compared with a year earlier, hourly pay was up 2.2 percent last month, holding within the narrow range tracked over the past four years.
…
The report also included positive news on the size of the labor force. The participation rate, which indicates the share of working-age people who are employed or looking for work, increased to 62.8 percent from 62.7 percent in March, which matched the lowest since 1978. The gain was paced by 45-to-64 year-old Americans.
…
The Fed now defines full employment as between 5 percent and 5.2 percent, according to projections released after their March 17-18 meeting. The range was lowered from 5.2 percent to 5.5 percent after the jobless rate reached the top of the scale in February.
In Canada, not so much:
The Target effect is denting Canada’s jobs numbers.
Employers shed a total of 19,700 jobs last month, according to Statistics Canada, the most since August, as retailers eliminated thousands of sales, cashiers and clerks positions.
The numbers show the impact of a raft of store closings amid upheaval in the sector, including Target Canada, Best Buy, Mexx, Smart Set, Indigo Books and Sony. The sector may be in flux, but it remains the largest source of employment in the country.
…
The retail sector posted a loss of 20,500 workers, Statscan said Friday, leaving employment levels flat from a year earlier. Monthly jobs numbers can be volatile, but separate payrolls data show the retail sector has contracted for four months in a row.In January, Target said it was pulling out of Canada, an abrupt move that spelled job losses for 17,600 of its workers over the ensuing months and put pressure on hundreds of firms that served the chain, forcing some of them to lay off staff, too.
Across Canada, the jobless rate stayed at 6.8 per cent as fewer people looked for work.
Monthly numbers can swing up and down, but smoothed-out averages show employment has grown by just 2,600 jobs on average per month in the past half-year. Year-over-year employment growth has been stuck below 1 per cent for the past 13 months.
Other sectors shed workers as well last month, in construction and information services. Natural resources were little changed in the month, but are down 6.6 per cent from a year earlier, reflecting the oil price slide.
On the other hand, it’s my understanding that in Toronto, house flippers have basically been priced out of the market by eager-to-buy veterans of too many bidding wars. In the States, not so much:
Real estate buyers seeking money to renovate and flip U.S. houses are getting help from some of the world’s biggest investment firms.
Colony Capital Inc., Blackstone Group LP and Cerberus Capital Management are among the companies that have started making bridge loans to investors who buy homes to sell them quickly for a profit. Borrowing costs — traditionally the highest in residential lending — are tumbling as the firms compete for customers.
The foray represents a deepening bet on the housing market by Wall Street-backed companies, many of which have built rental-home empires during the past three years and started specialty-lending businesses to finance smaller investors. Big firms with deep pockets and access to cheap capital may have an edge over local private lenders that have dominated flipper financing.
…
Home flippers are benefiting from rising prices, limited new construction and a shortage of inventory on the market. While quick resales have decreased from the start of the housing market’s rebound, when investors snapped up discounted distressed homes, profits are getting bigger.The average gross profit for completed flips in the first quarter was $72,450, up from $61,684 a year earlier and the highest in records dating to 2011, according to a report Thursday from RealtyTrac, a real estate data firm. Markets with the highest average gross return on investment included Baltimore, central Florida and Detroit.
‘Who will watch the watchers?’ query the wise men in Congress. Watcher watchers!
Senate Banking Committee Chairman Richard Shelby is putting the finishing touches on a bill that could give Congress more power over the New York Fed and create a commission with authority to propose sweeping reforms of the entire Fed system.
Other senators want to curb the Fed’s ability to bail out banks during a financial meltdown and increase transparency of its regulation.
“Shelby wants to do something with the Fed,” said Ed Mills, a financial-policy analyst at FBR & Co. in Arlington, Virginia, and a former adviser to Democrats in the House and Senate. “It seems as if they’re going to have something in here that is additional oversight of the Fed or rebalancing some of the power internally at the Fed, whether staff resources or more transparency.”
There’s really only one structural problem with the Fed: it has responsibility for both bank supervision and monetary policy. While there are good arguments to be made in favour of combining the mandates, as has been discussed previously on PrefBlog (see, for example, September 10, 2008 and Willem Buiter’s Prescription), I continue to think that puts just too much power in the hands of one institution.
As far as ‘Fed bailouts of Wall Street Banks’ are concerned – well, for the most part that’s a canard. The explicit bail-outs were done by the Treasury with the authority of congress. The Fed simply lent to solvent banks against adequate collateral … which is what Central Banks are supposed to do during a liquidity crisis. They can, however, be criticized for not ensuring that these loans were not made at penalty rates:
The Fed didn’t tell anyone which banks were in trouble so deep they required a combined $1.2 trillion on Dec. 5, 2008, their single neediest day. Bankers didn’t mention that they took tens of billions of dollars in emergency loans at the same time they were assuring investors their firms were healthy. And no one calculated until now that banks reaped an estimated $13 billion of income by taking advantage of the Fed’s below-market rates, Bloomberg Markets magazine reports in its January issue.
Brookfield Investments Corporation, proud issuer of BRN.PR.A (which is not tracked by HIMIPref™) has been confirmed at Pfd-2(low) by DBRS:
DBRS Limited (DBRS) has today confirmed the rating of Pfd-2 (low) with a Stable trend for the Senior Preferred Shares of Brookfield Investments Corporation (Brookfield Investments or the Company). The rating continues to be based on the strength of Brookfield Investments’ owner (Brookfield Asset Management Inc. or BAM; rated A (low), Stable trend by DBRS), as well as the Company’s relatively stable portfolio of real estate and asset management investments, with strong asset and dividend coverage. The rating remains limited by Brookfield Investments’ exposure to the volatility of overall capital markets, concentration of investments in the real estate sector, lack of investment restrictions and the relative illiquidity of unlisted investments.
It was another strong-mixed day for the Canadian preferred share market, with PerpetualDiscounts gaining 19bp, FixedResets up 33bp and DeemedRetractibles off 2bp. The strength in FixedResets came at the end of the day:
Click for Big
A Performance Highlights table of unsurprising size was unsurprisingly dominated by winning FixedResets, but there were a few losers in the mix. Volume was quite high.
For as long as the FixedReset market is so violently unsettled, I’ll keep publishing updates of the more interesting and meaningful series of FixedResets’ Implied Volatilities. This doesn’t include Enbridge because although Enbridge has a large number of issues outstanding, all of which are quite liquid, the range of Issue Reset Spreads is too small for decent conclusions. The low is 212bp (ENB.PR.H; second-lowest is ENB.PR.D at 237bp) and the high is a mere 268 for ENB.PF.G.
Remember that all rich /cheap assessments are:
» based on Implied Volatility Theory only
» are relative only to other FixedResets from the same issuer
» assume constant GOC-5 yield
» assume constant Implied Volatility
» assume constant spread
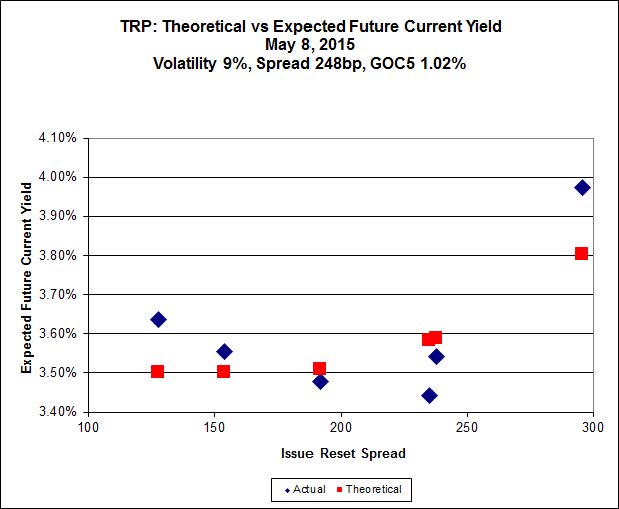
Here’s TRP:
Click for Big
TRP.PR.E, which resets 2019-10-30 at +235, is bid at 24.48 to be $0.96 rich, while TRP.PR.G, resetting 2020-11-30 at +296, is $1.12 cheap at its bid price of 25.04.
Click for Big
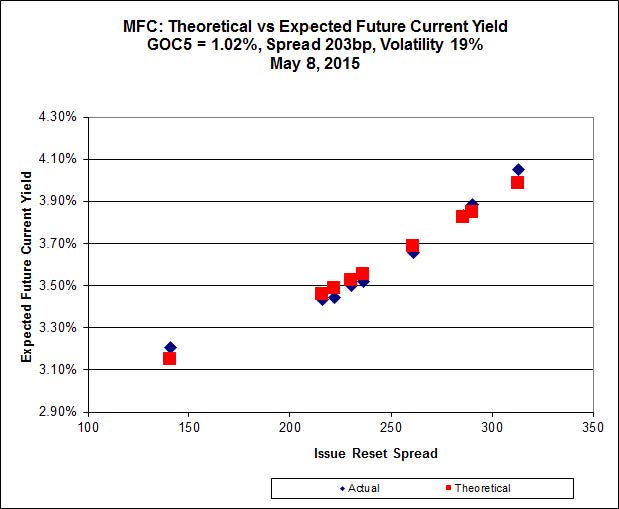
Another excellent fit, but the numbers are perplexing. Implied Volatility for MFC continues to be a conundrum. It is still too high if we consider that NVCC rules will never apply to these issues; it is still too low if we consider them to be NVCC non-compliant issues (and therefore with Deemed Maturities in the call schedule).
Most expensive is MFC.PR.K, resetting at +222 on 2018-9-19, bid at 23.52 to be $0.28 rich, while MFC.PR.H, resetting at +313bp on 2017-3-19, is bid at 25.61 to be $0.43 cheap.

Click for Big
The cheapest issue relative to its peers is BAM.PR.R, resetting at +230bp on 2016-6-30, bid at 20.52 to be $0.60 cheap. BAM.PR.X, resetting at +180bp 2017-6-30 is bid at 18.51 and appears to be $0.57 rich.

Click for Big
FTS.PR.H, with a spread of +145bp, and bid at 16.63, looks $0.76 cheap and resets 2015-6-1. FTS.PR.K, with a spread of +205bp and resetting 2019-3-1, is bid at 22.14 and is $0.52 rich.
Click for Big
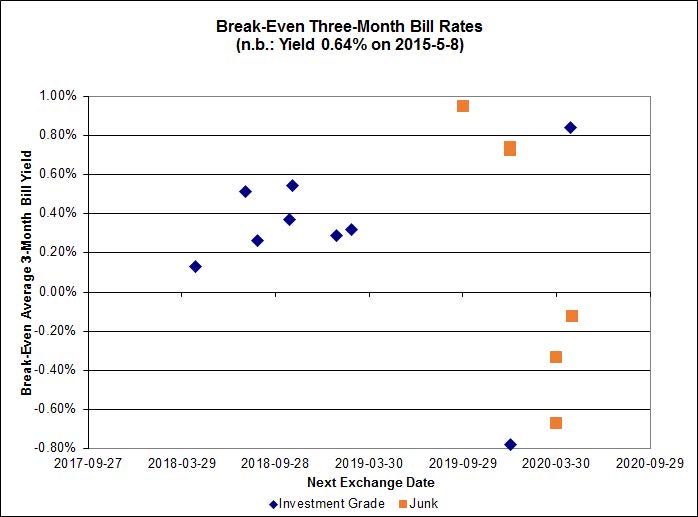
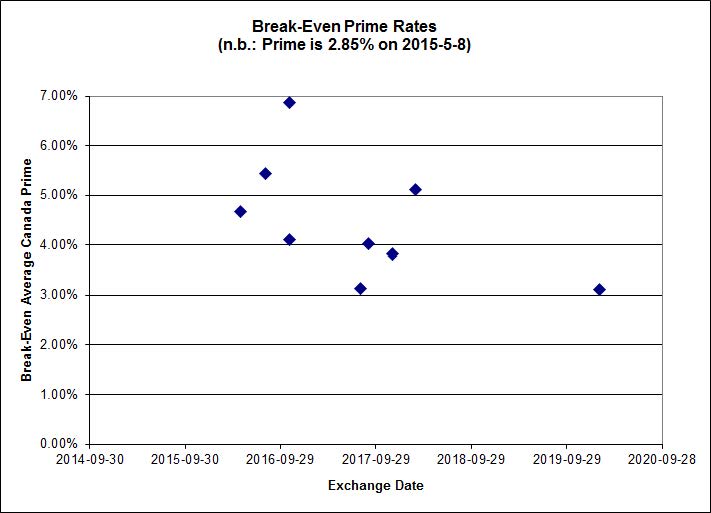
Investment-grade pairs now predict an average over the next five years of about 0.35%, but TRP.PR.A / TRP.PR.F is an outlier at -0.78% and BNS.PR.Y / BNS.PR.D is at +0.84%. On the junk side, the FFH.PR.E / FFH.PR.F pair is at -0.68% while DC.PR.B / DC.PR.D is now at 0.95%.
Click for Big
Shall we just say that this exhibits a high level of confidence in the continued rapacity of Canadian banks?
| HIMIPref™ Preferred Indices These values reflect the December 2008 revision of the HIMIPref™ Indices Values are provisional and are finalized monthly |
|||||||
| Index | Mean Current Yield (at bid) |
Median YTW |
Median Average Trading Value |
Median Mod Dur (YTW) |
Issues | Day’s Perf. | Index Value |
| Ratchet | 0.00 % | 0.00 % | 0 | 0.00 | 0 | -0.4202 % | 2,328.4 |
| FixedFloater | 0.00 % | 0.00 % | 0 | 0.00 | 0 | -0.4202 % | 4,071.1 |
| Floater | 3.12 % | 3.22 % | 55,010 | 19.15 | 4 | -0.4202 % | 2,475.2 |
| OpRet | 4.41 % | -1.93 % | 38,432 | 0.15 | 2 | -0.0196 % | 2,770.8 |
| SplitShare | 4.57 % | 4.78 % | 61,960 | 3.36 | 3 | 0.0267 % | 3,228.0 |
| Interest-Bearing | 0.00 % | 0.00 % | 0 | 0.00 | 0 | -0.0196 % | 2,533.6 |
| Perpetual-Premium | 5.45 % | 1.43 % | 67,136 | 0.08 | 18 | 0.0763 % | 2,522.3 |
| Perpetual-Discount | 5.01 % | 5.00 % | 120,224 | 15.42 | 15 | 0.1884 % | 2,805.7 |
| FixedReset | 4.38 % | 3.73 % | 274,342 | 16.32 | 86 | 0.3291 % | 2,421.2 |
| Deemed-Retractible | 4.92 % | 3.04 % | 110,198 | 0.22 | 36 | -0.0243 % | 2,648.9 |
| FloatingReset | 2.59 % | 2.93 % | 65,325 | 6.20 | 7 | -0.1033 % | 2,333.4 |
| Performance Highlights | |||
| Issue | Index | Change | Notes |
| PWF.PR.P | FixedReset | -1.77 % | YTW SCENARIO Maturity Type : Limit Maturity Maturity Date : 2045-05-08 Maturity Price : 18.87 Evaluated at bid price : 18.87 Bid-YTW : 3.57 % |
| GWO.PR.N | FixedReset | -1.66 % | YTW SCENARIO Maturity Type : Hard Maturity Maturity Date : 2025-01-31 Maturity Price : 25.00 Evaluated at bid price : 17.80 Bid-YTW : 6.50 % |
| FTS.PR.G | FixedReset | -1.32 % | YTW SCENARIO Maturity Type : Limit Maturity Maturity Date : 2045-05-08 Maturity Price : 21.39 Evaluated at bid price : 21.71 Bid-YTW : 3.79 % |
| BAM.PR.K | Floater | -1.29 % | YTW SCENARIO Maturity Type : Limit Maturity Maturity Date : 2045-05-08 Maturity Price : 15.30 Evaluated at bid price : 15.30 Bid-YTW : 3.28 % |
| MFC.PR.N | FixedReset | -1.13 % | YTW SCENARIO Maturity Type : Hard Maturity Maturity Date : 2025-01-31 Maturity Price : 25.00 Evaluated at bid price : 23.70 Bid-YTW : 4.32 % |
| BAM.PF.F | FixedReset | 1.02 % | YTW SCENARIO Maturity Type : Limit Maturity Maturity Date : 2045-05-08 Maturity Price : 23.14 Evaluated at bid price : 24.80 Bid-YTW : 3.97 % |
| HSE.PR.A | FixedReset | 1.04 % | YTW SCENARIO Maturity Type : Limit Maturity Maturity Date : 2045-05-08 Maturity Price : 17.45 Evaluated at bid price : 17.45 Bid-YTW : 4.08 % |
| NA.PR.S | FixedReset | 1.09 % | YTW SCENARIO Maturity Type : Limit Maturity Maturity Date : 2045-05-08 Maturity Price : 23.29 Evaluated at bid price : 25.12 Bid-YTW : 3.39 % |
| MFC.PR.K | FixedReset | 1.16 % | YTW SCENARIO Maturity Type : Hard Maturity Maturity Date : 2025-01-31 Maturity Price : 25.00 Evaluated at bid price : 23.52 Bid-YTW : 4.28 % |
| CU.PR.D | Perpetual-Discount | 1.16 % | YTW SCENARIO Maturity Type : Call Maturity Date : 2020-09-01 Maturity Price : 25.25 Evaluated at bid price : 25.25 Bid-YTW : 4.81 % |
| MFC.PR.L | FixedReset | 1.18 % | YTW SCENARIO Maturity Type : Hard Maturity Maturity Date : 2025-01-31 Maturity Price : 25.00 Evaluated at bid price : 23.14 Bid-YTW : 4.55 % |
| BAM.PF.G | FixedReset | 1.46 % | YTW SCENARIO Maturity Type : Limit Maturity Maturity Date : 2045-05-08 Maturity Price : 23.14 Evaluated at bid price : 24.96 Bid-YTW : 3.94 % |
| FTS.PR.M | FixedReset | 1.53 % | YTW SCENARIO Maturity Type : Limit Maturity Maturity Date : 2045-05-08 Maturity Price : 23.24 Evaluated at bid price : 25.15 Bid-YTW : 3.51 % |
| TD.PF.C | FixedReset | 1.55 % | YTW SCENARIO Maturity Type : Limit Maturity Maturity Date : 2045-05-08 Maturity Price : 22.89 Evaluated at bid price : 24.22 Bid-YTW : 3.39 % |
| BAM.PR.T | FixedReset | 1.69 % | YTW SCENARIO Maturity Type : Limit Maturity Maturity Date : 2045-05-08 Maturity Price : 21.10 Evaluated at bid price : 21.10 Bid-YTW : 4.12 % |
| BAM.PR.X | FixedReset | 1.98 % | YTW SCENARIO Maturity Type : Limit Maturity Maturity Date : 2045-05-08 Maturity Price : 18.51 Evaluated at bid price : 18.51 Bid-YTW : 4.11 % |
| BAM.PF.A | FixedReset | 2.10 % | YTW SCENARIO Maturity Type : Limit Maturity Maturity Date : 2045-05-08 Maturity Price : 23.24 Evaluated at bid price : 24.76 Bid-YTW : 3.99 % |
| TRP.PR.C | FixedReset | 2.45 % | YTW SCENARIO Maturity Type : Limit Maturity Maturity Date : 2045-05-08 Maturity Price : 18.01 Evaluated at bid price : 18.01 Bid-YTW : 3.63 % |
| CIU.PR.C | FixedReset | 2.85 % | YTW SCENARIO Maturity Type : Limit Maturity Maturity Date : 2045-05-08 Maturity Price : 16.26 Evaluated at bid price : 16.26 Bid-YTW : 3.74 % |
| Volume Highlights | |||
| Issue | Index | Shares Traded |
Notes |
| CU.PR.F | Perpetual-Discount | 125,058 | TD crossed 72,500 at 23.35; RBC crossed 52,000 at the same price. YTW SCENARIO Maturity Type : Limit Maturity Maturity Date : 2045-05-08 Maturity Price : 22.94 Evaluated at bid price : 23.25 Bid-YTW : 4.83 % |
| RY.PR.M | FixedReset | 102,306 | RBC bought blocks of 10,000 and 20,000 from TD, both at 24.84, then crossed 24,000 at the same price. YTW SCENARIO Maturity Type : Limit Maturity Maturity Date : 2045-05-08 Maturity Price : 23.05 Evaluated at bid price : 24.76 Bid-YTW : 3.57 % |
| BAM.PF.D | Perpetual-Discount | 96,307 | RBC crossed blocks of 25,000 and 60,600 at 23.45. YTW SCENARIO Maturity Type : Limit Maturity Maturity Date : 2045-05-08 Maturity Price : 23.15 Evaluated at bid price : 23.47 Bid-YTW : 5.27 % |
| FTS.PR.M | FixedReset | 86,240 | Desjardins crossed 75,000 at 25.09. YTW SCENARIO Maturity Type : Limit Maturity Maturity Date : 2045-05-08 Maturity Price : 23.24 Evaluated at bid price : 25.15 Bid-YTW : 3.51 % |
| TRP.PR.F | FloatingReset | 55,200 | RBC crossed 40,000 at 18.97. YTW SCENARIO Maturity Type : Limit Maturity Maturity Date : 2045-05-08 Maturity Price : 19.04 Evaluated at bid price : 19.04 Bid-YTW : 3.39 % |
| SLF.PR.A | Deemed-Retractible | 54,594 | Scotia crossed 40,000 at 24.75. YTW SCENARIO Maturity Type : Hard Maturity Maturity Date : 2025-01-31 Maturity Price : 25.00 Evaluated at bid price : 24.71 Bid-YTW : 4.99 % |
| There were 48 other index-included issues trading in excess of 10,000 shares. | |||
| Wide Spread Highlights | ||
| Issue | Index | Quote Data and Yield Notes |
| RY.PR.H | FixedReset | Quote: 24.17 – 24.75 Spot Rate : 0.5800 Average : 0.3928 YTW SCENARIO |
| ENB.PR.D | FixedReset | Quote: 20.00 – 20.45 Spot Rate : 0.4500 Average : 0.2761 YTW SCENARIO |
| BMO.PR.T | FixedReset | Quote: 24.05 – 24.60 Spot Rate : 0.5500 Average : 0.3993 YTW SCENARIO |
| BMO.PR.W | FixedReset | Quote: 24.01 – 24.37 Spot Rate : 0.3600 Average : 0.2258 YTW SCENARIO |
| BMO.PR.S | FixedReset | Quote: 24.46 – 24.88 Spot Rate : 0.4200 Average : 0.3022 YTW SCENARIO |
| BAM.PR.K | Floater | Quote: 15.30 – 15.67 Spot Rate : 0.3700 Average : 0.2589 YTW SCENARIO |