Performance of the HIMIPref™ Indices for July, 2009, was:
| Total Return | ||
| Index | Performance July 2009 |
Three Months to July 30, 2009 |
| Ratchet | +2.74% * | +25.62% * |
| FixFloat | +1.14% | +37.20% ** |
| Floater | +2.74% | +25.62% |
| OpRet | +1.91% | +5.28% |
| SplitShare | +4.48% | +12.48% |
| Interest | +1.91%**** | +3.98%**** |
| PerpetualPremium | +5.74%*** | +12.05%*** |
| PerpetualDiscount | +5.74% | +12.05% |
| FixedReset | +3.03% | +7.98% |
| * The last member of the RatchetRate index was transferred to Scraps at the February, 2009, rebalancing; subsequent performance figures are set equal to the Floater index | ||
| ** The last member of the FixedFloater index was transferred to Scraps at the February, 2009, rebalancing. Performance figures to 2009-5-29 are set equal to the Floater index. The FixedFloater index acquired a member on 2009-5-29. | ||
| *** The last member of the PerpetualPremium index was transferred to PerpetualDiscount at the October, 2008, rebalancing; subsequent performance figures are set equal to the PerpetualDiscount index. The PerpetualPremium index acquired four new members at the July, 2009, rebalancing. | ||
| **** The last member of the InterestBearing index was transferred to Scraps at the June, 2009, rebalancing; subsequent performance figures are set equal to the OperatingRetractible index | ||
| Passive Funds (see below for calculations) | ||
| CPD | +3.35% | +8.96% |
| DPS.UN | +4.45% | +13.62% |
| Index | ||
| BMO-CM 50 | +4.46% | +11.45% |
I believe the rather startling underperformance of CPD relative to DPS.UN is due to the former overweighting and the latter underweighting FixedReset issues which, while having (unsustainably!) strong results over the past three months, have underperformed PerpetualDiscounts. A measure of payback from the results for the period ending November, 2008 in which the relative performance of these two preferred share classes was … somewhat different!
Index performance over the trailing year is starting to look a little more normal – quite a feat when you consider that it includes the wild October-January period! Normal, that is, except for FloatingRate issues:
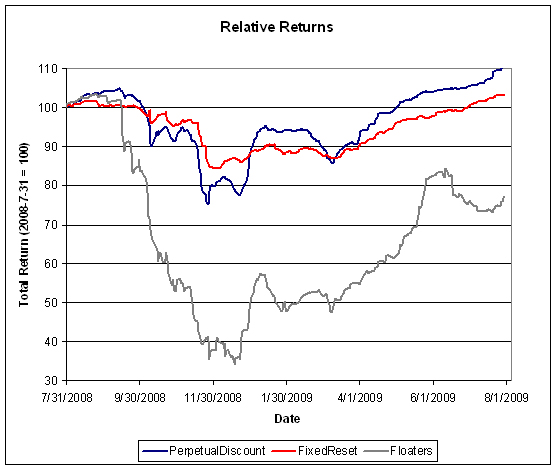
Click for big
Claymore has published NAV and distribution data (problems with the page in IE8 can be kludged by using compatibility view) for its exchange traded fund (CPD) and I have derived the following table:
| CPD Return, 1- & 3-month, to July, 2009 | ||||
| Date | NAV | Distribution | Return for Sub-Period | Monthly Return |
| April 30 | 15.27 | |||
| May 29, 2009 | 15.88 | 0.00 | +3.99% | |
| June 25 | 15.88 | 0.2100 | +1.32% | +1.38% |
| June 30, 2009 | 15.89 | +0.06% | ||
| July 31, 2009 | 16.42 | +3.35% | ||
| Quarterly Return | +8.96% | |||
CPD was hurt by its July rebalancing, a phenomenon that I have remarked on previously. Assiduous Readers will recall that the July Rebalancing added (net) ten Fixed Resets vs a deletion of (net) six PerpetualDiscounts effective “at the open July 20”. Taking this as equivalent to the close on Friday July 17, let’s take a quick peek at how that particular decision has worked out.
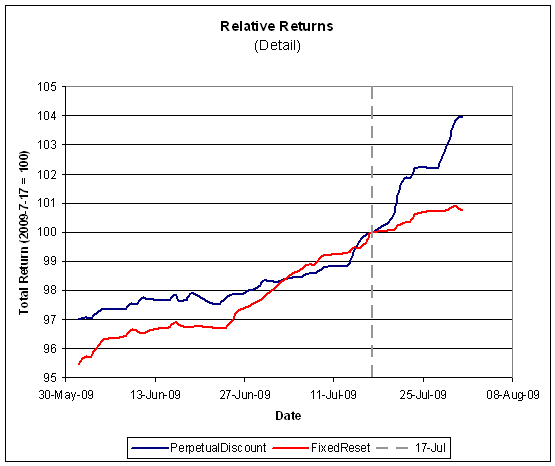
Click for big
Claymore currently holds $224,222,293 in CPD assets, a stunning increase from the $84,005,161 reported in the Dec 31/08 Annual Report. It may well be that CPD’s migration towards liquidity at all cost (as defined by the TXPR index) has an entirely valid rationale … but it sure ain’t doing returns much good! I will note that July’s index churn is nothing new considering that the portfolio has been churned on every semi-annual rebalancing since inception; so one cannot draw a straight line between the near-tripling of assets and the July rebalancing.
The DPS.UN NAV for July 29 has been published so we may calculate the approximate July returns – which is kind of a nightmare this month because it includes the June distribution. First, it is necessary to look at CPD for the period June 24-26 …
| CPD Return, June 24-26 | ||||
| Date | NAV | Distribution | Return for Sub-Period | Monthly Return |
| June 24, 2009 | 16.04 | |||
| June 25 | 15.88 | 0.21 | +0.31% | |
| June 26, 2009 | 15.87 | -0.06% | ||
| June 24-26 Return | +0.25% | |||
This figure is required in order to estimate the NAV for DPS.UN on June 26.
| DPS.UN NAV Return, July-ish 2009 | |||
| Date | NAV | Distribution | Return for period |
| Estimated June Ending Stub** | -0.375% | ||
| June 24, 2009 | 18.56 | ||
| June 26, 2009 | 18.3064*** | 0.30 | +0.25%*** |
| July 29, 2009 | 19.03 | +3.95% | |
| Estimated July Ending Stub | +0.61% * | ||
| Estimated July Return | +4.45% | ||
| ** CPD had a NAV of $16.04 on June 24, paid $0.21 June 25 with a NAV of 15.88 and a NAV of $15.89 on June 30. The return for the period was therefore +0.375%. This figure is subtracted the DPS.UN period return to arrive at an estimate for the calendar month. | |||
| * CPD had a NAV of $16.32 on July 29 and a NAV of $16.42 on July 31. The return for the period was therefore +0.61%. This figure is added to the DPS.UN period return to arrive at an estimate for the calendar month. | |||
| *** The June 26 NAV following the distribution has been estimated by assuming that DPS.UN and CPD had the same return for the period June 24-26; see table above. | |||
| The July return for DPS.UN’s NAV is therefore the product of three period returns, -0.375%, +0.25%, +3.95% and +0.61% to arrive at an estimate for the calendar month of +4.45% | |||
Now, to see the DPS.UN quarterly NAV approximate return, we refer to the calculations for May and June
| DPS.UN NAV Returns, three-month-ish to end-July-ish, 2009 | |
| May-ish | +6.35% |
| June-ish | +2.28% |
| July-ish | +4.45% |
| Three-months-ish | +13.62% |
[…] performed well as the preferred share recovery now looks pretty solid. As noted in the report of Index Performance, July 2009, both the FixedReset and PerpetualDiscount posted strong gains, particularly in the latter half of […]
[…] Now, to see the DPS.UN quarterly NAV approximate return, we refer to the calculations for June and July: […]
[…] to see the DPS.UN quarterly NAV approximate return, we refer to the calculations for July and […]