Performance of the HIMIPref™ Indices for April, 2010, was:
| Total Return | ||
| Index | Performance April 2010 |
Three Months to April 30, 2010 |
| Ratchet | -0.83% | +23.67% |
| FixFloat | +0.96% | +15.28% |
| Floater | -1.16% | +11.19% |
| OpRet | -0.32% | -0.68% |
| SplitShare | -0.22% | +0.63% |
| Interest | -0.32%**** | -0.68%**** |
| PerpetualPremium | -1.95% | -3.45% |
| PerpetualDiscount | -2.39% | -6.92% |
| FixedReset | -3.13% | -2.27% |
| **** The last member of the InterestBearing index was transferred to Scraps at the June, 2009, rebalancing; subsequent performance figures are set equal to the OperatingRetractible index | ||
| Passive Funds (see below for calculations) | ||
| CPD | -2.13% | -2.90% |
| DPS.UN | -2.47% | -2.63% |
| Index | ||
| BMO-CM 50 | % | % |
| TXPR Total Return | -2.17% | -2.82% |
The pre-tax interest equivalent spread of PerpetualDiscounts over Long Corporates (which I also refer to as the Seniority Spread) ended the month at +320bp, a sharp increase from +285bp at March month-end and +235bp recorded at February month-end. The decline in the PerpetualDiscount index was entirely due to an increase in the spread over corporates, since yields on long corporates actually declined from 5.8% to 5.7% in April.
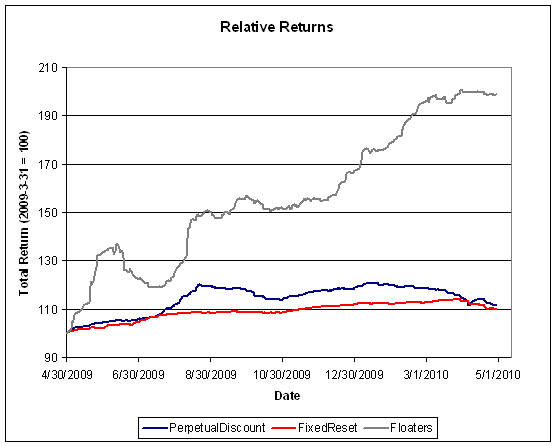
The relative returns on Floaters over the past year continues to impress, although returns moderated in April. Given the prices and yields, I suspect that we have now entered an era of normalcy for Floaters:
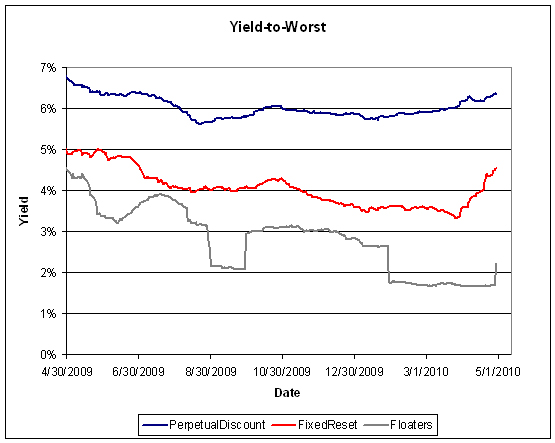
The relatively low duration of FixedResets means that the relatively restrained total return loss during the month masked a violent increase in yield:
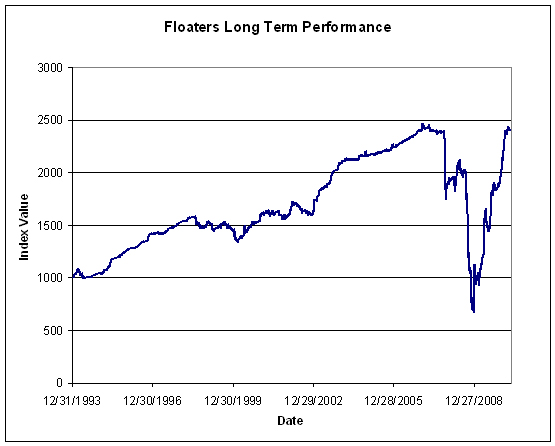
Floaters have had a wild ride:
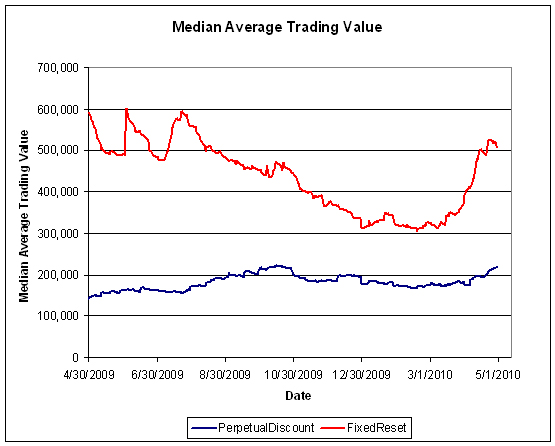
FixedReset volume picked up during the month. Volume may be under-reported due to the influence of Alternative Trading Systems (as discussed in the November PrefLetter), but I am biding my time before incorporating ATS volumes into the calculations, to see if the effect is transient or not.
Who knows? Maybed we’ll get even more FixedReset volume in May, once investors receive their brokerage statements and learn that prices can also go down!
Compositions of the passive funds were discussed in the September edition of PrefLetter.
Claymore has published NAV and distribution data (problems with the page in IE8 can be kludged by using compatibility view) for its exchange traded fund (CPD) and I have derived the following table:
| CPD Return, 1- & 3-month, to April 30, 2010 | ||||
| Date | NAV | Distribution | Return for Sub-Period | Monthly Return |
| January 29 | 16.80 | |||
| February 26, 2010 | 16.83 | +0.18% | ||
| March 26 | 16.64 | 0.21 | +0.12% | -0.96% |
| March 31, 2010 | 16.46 | 0.00 | -1.08% | |
| April 30, 2010 | 16.11 | -2.13% | ||
| Quarterly Return | -2.90% | |||
Claymore currently holds $428,556,482 (advisor & common combined) in CPD assets, down about $7-million from the $435,437,774 reported last month and up about $62-million from the $373,729,364 reported at year-end. The monthly decline in AUM of about 1.58% is smaller than the total return loss of 2.13%, implying that the ETF continues to attract assets.
The DPS.UN NAV for April 28 has been published so we may calculate the approximate March returns. On March 29, it went ex-Dividend for $0.30 according to the TMX.
| DPS.UN NAV Return, April-ish 2010 | ||||
| Date | NAV | Distribution | Return for sub-period | Return for period |
| March 31, 2010 | 19.93 | |||
| April 28, 2010 | 19.45 | -2.41% | ||
| Estimated April Ending Stub | -0.06% * | |||
| Estimated April Return | -2.47% *** | |||
| *CPD had a NAVPU of 16.12 on April 28 and 16.11 on April 30, hence the total return for the period for CPD was -0.06%. The return for DPS.UN in this period is presumed to be equal. | ||||
| *** The estimated April return for DPS.UN’s NAV is therefore the product of two period returns, -2.41% and -0.06% to arrive at an estimate for the calendar month of -2.47% | ||||
Now, to see the DPS.UN quarterly NAV approximate return, we refer to the calculations for February and March:
| DPS.UN NAV Returns, three-month-ish to end-April-ish, 2010 | |
| February-ish | -1.61% |
| March-ish | +1.47% |
| April-ish | -2.47% |
| Three-months-ish | -2.63% |


[…] fund experienced a negative return in April – as did nearly all sectors of the preferred share market – but outperformed both DPS.UN and CPD due to its heavy weighting in […]
FixedReset volume picked up during the month. Volume may be under-reported due to the influence of Alternative Trading Systems (as discussed in the November PrefLetter), but I am biding my time before incorporating ATS volumes into the calculations, to see if the effect is transient or not.
Hi James,
It is my impression, for the 15 prefs I follow, that during the last months of heavy volume the amount trades on the ATS has DROPPED substantially.
the amount trades on the ATS has DROPPED substantially.
That’s interesting … I look forward to reviewing the matter systemically in the fall.
[…] Now, to see the DPS.UN quarterly NAV approximate return, we refer to the calculations for March and April: […]
[…] to see the DPS.UN quarterly NAV approximate return, we refer to the calculations for April and […]