Performance of the HIMIPref™ Indices for March, 2010, was:
| Total Return | ||
| Index | Performance March 2010 |
Three Months to March 31, 2010 |
| Ratchet | +8.85%* | +32.94%* |
| FixFloat | +7.56% | +17.20% |
| Floater | +3.04% | +19.91% |
| OpRet | +0.09% | -0.99% |
| SplitShare | +0.13% | +1.88% |
| Interest | +0.09%**** | -0.99%**** |
| PerpetualPremium | -1.96% | -1.70% |
| PerpetualDiscount | -3.33% | -3.51% |
| FixedReset | +0.57% | +0.89% |
| * The last member of the RatchetRate index was transferred to Scraps at the February, 2009, rebalancing; subsequent performance figures are set equal to the Floater index
Independent measurement was resumed when an issue qualified for inclusion (transferred from Scraps) at the |
||
| **** The last member of the InterestBearing index was transferred to Scraps at the June, 2009, rebalancing; subsequent performance figures are set equal to the OperatingRetractible index | ||
| Passive Funds (see below for calculations) | ||
| CPD | -0.96% | -1.31% |
| DPS.UN | +1.74% | +1.22% |
| Index | ||
| BMO-CM 50 | -0.66% | +0.33% |
| TXPR Total Return | -0.86% | -0.95% |
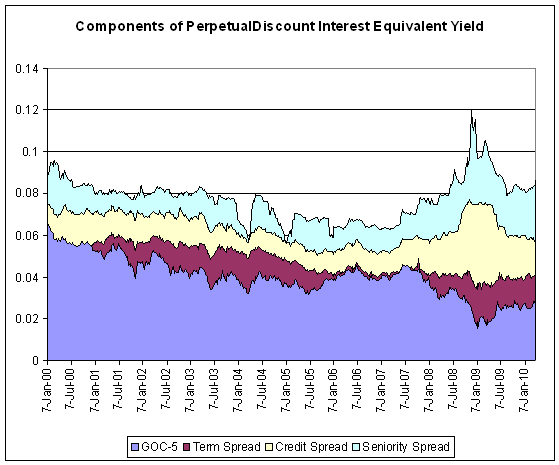
The pre-tax interest equivalent spread of PerpetualDiscounts over Long Corporates (which I also refer to as the Seniority Spread) ended the month at +285bp, a sharp increase from the +235bp recorded at February month-end. The decline in the PerpetualDiscount index was entirely due to an increase in the spread over corporates, since yields on long corporates actually declined from 5.9% to 5.8%.
Click for big
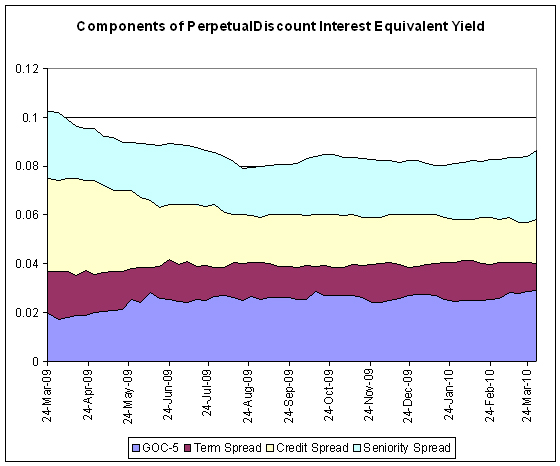
The Seniority Spread is now the largest component of PerpetualDiscount Interest-Equivalent yields:
Click for big
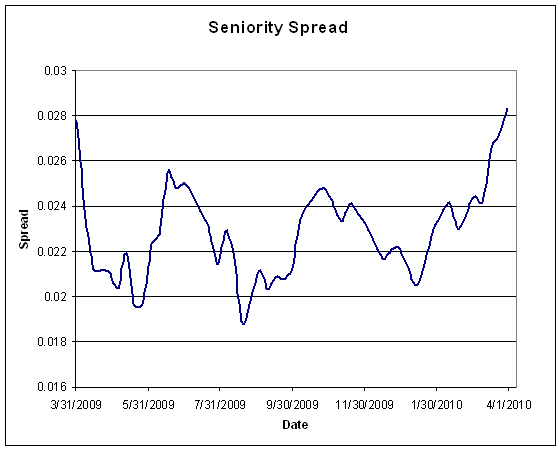
The seniority spread is at a one-year high:
Click for big
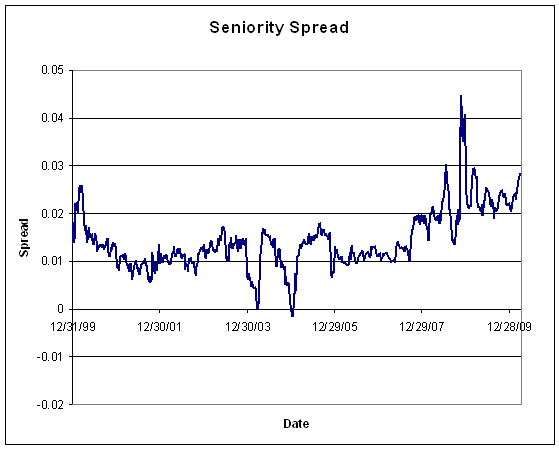
And the Seniority Spread is well above long-term levels:
Click for big
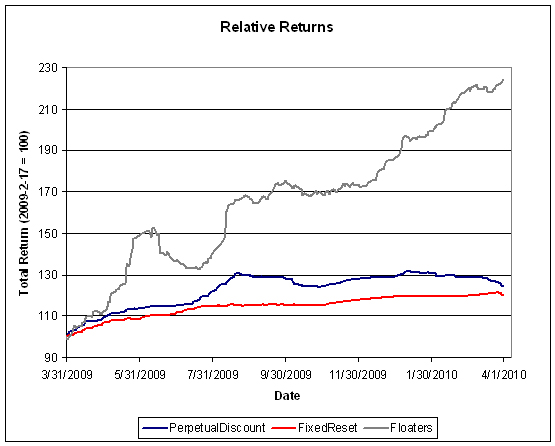
The relative returns on Floaters over the past year continues to impress:
Click for big
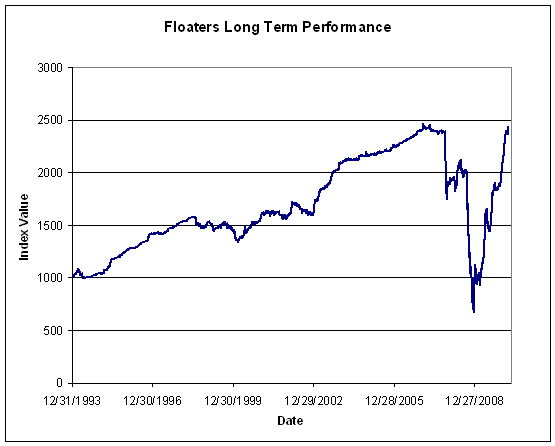
But one must remember how they got there:
Click for big
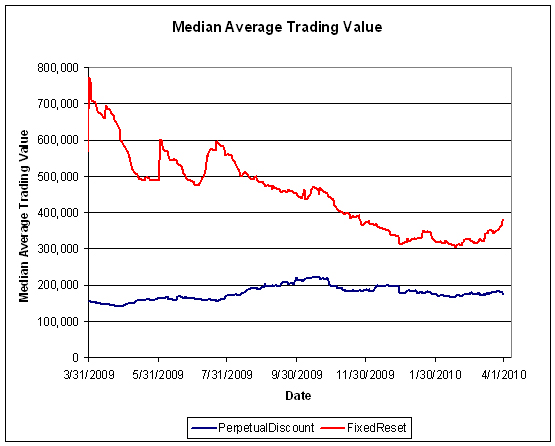
FixedReset volume picked up during the month. Volume may be under-reported due to the influence of Alternative Trading Systems (as discussed in the November PrefLetter), but I am biding my time before incorporating ATS volumes into the calculations, to see if the effect is transient or not.
Click for big
As discussed in February, the impressive returns of the past year cannot continue indefinately. The long term return on a fixed income instrument is its yield – 6.2% for a PerpetualDiscount, and about 3.6% to the call date for a FixedReset, as of April 1. The FixedReset index set a new low yield in March, highlighted by RY.PR.R’s brief flirtation with sub-3% levels.
Compositions of the passive funds were discussed in the September edition of PrefLetter.
Claymore has published NAV and distribution data (problems with the page in IE8 can be kludged by using compatibility view) for its exchange traded fund (CPD) and I have derived the following table:
| CPD Return, 1- & 3-month, to March 31, 2010 | ||||
| Date | NAV | Distribution | Return for Sub-Period | Monthly Return |
| December 31, 2009 | 16.89 | |||
| January 29 | 16.80 | -0.53% | ||
| February 26, 2010 | 16.83 | +0.18% | ||
| March 26 | 16.64 | 0.21 | +0.12% | -0.96% |
| March 31, 2009 | 16.46 | 0.00 | -1.08% | |
| Quarterly Return | -1.31% | |||
Claymore currently holds $435,437,774 (advisor & common combined) in CPD assets, up about $15-million from the $420,750,223 reported last month and up about $62-million from the $373,729,364 reported at year-end.
The DPS.UN NAV for March 31 has been published so we may calculate the approximate March returns. On March 29, it went ex-Dividend for $0.30 according to the TMX.
| DPS.UN NAV Return, March-ish 2010 | ||||
| Date | NAV | Distribution | Return for sub-period | Return for period |
| February 24, 2010 | 19.91 | |||
| March 29, 2010 | 20.09 ** | 0.30 | +2.41% | +1.59% |
| March 31, 2010 | 19.93 | -0.80% | ||
| Estimated February Ending Stub | -0.12% * | |||
| Estimated March Return | +1.47% *** | |||
| *CPD had a NAVPU of 16.81 on February 24 and 16.83 on February 26, hence the total return for the period for CPD was +0.12%. The return for DPS.UN in this period is presumed to be equal. | ||||
| ** The March 31 NAVPU was $19.93. CPD had a NAV of 16.46 on March 31 and 16.59 on March 29. Thus, a NAVPU of 20.09 for DPS on March 29 has been estimated | ||||
| *** The estimated February return for DPS.UN’s NAV is therefore the product of three period returns, +2.41%, -0.80% and -0.12% to arrive at an estimate for the calendar month of +1.47% | ||||
Now, to see the DPS.UN quarterly NAV approximate return, we refer to the calculations for January and February:
| DPS.UN NAV Returns, three-month-ish to end-March-ish, 2010 | |
| January-ish | +1.39% |
| February-ish | -1.61% |
| March-ish | +1.47% |
| Three-months-ish | +1.22% |
I’ve never heard about a seniority spread. Very interesting. How do you calculate it? Is there a post that already discusses this? What forces would make it fall to 0 as it did in 2003 and 04?
I’ve never heard about a seniority spread.
I invented it and, to the best of my knowledge, am the only analyst who pays attention to it.
How do you calculate it?
Interest-Equivalent yield on PerpetualDiscounts less the index yield on long corporates.
For greater accuracy, you calculate it by issuer; that is, a single issuer’s interest-equivalent average PD yield, less the average yield on its (senior) long bonds.
Interest-equivalent PD yield is calculated by multiplying the PD yield by 1.4
What forces would make it fall to 0 as it did in 2003 and 04?
Essentially, lack of data! At those times, there were no perpetual discounts in the market, not one; so I have to use PerpetualPremiums.
The Seniority Spread was discussed in some detail in the October 2009 edition of PrefLetter.
You’ve sold me… Going to have to buy that letter.
[…] in March, weighed down by its lack of holdings in the Floating Rate sector, in which performance continues to astonish, and by its overweighting in PerpetualDiscounts, which […]
[…] Now, to see the DPS.UN quarterly NAV approximate return, we refer to the calculations for February and March: […]