The Canadian economic news is not encouraging:
Statistics Canada reported Tuesday that real gross domestic product (i.e. adjusted for inflation) shrank by 0.1 per cent in April from March. The economy was hit hard by a 3.4-per-cent drop in oil and gas extraction, as the Alberta oil sands, battered in recent months by sharply lower oil prices, was hit by maintenance shutdowns and other production delays. Manufacturing, retail sales and construction also took a step backward in the month.
The April decline was something of a shock to economists and market watchers, who had anticipated a turnaround from March’s 0.2-per-cent decline, and from a dismal first-quarter in which the economy contracted at an annualized rate of 0.6 per cent – its weakest quarter since the Great Recession. The oil price shock, harsh weather and U.S. port strikes weighed down activity in the quarter, but those factors appeared to have eased with the arrival of spring.
The Canadian dollar slumped about four-tenths of a penny against its U.S. counterpart on the news, to about 80.5 cents (U.S.).
Meanwhile, the US is going all-out to increase productivity:
Retailers and manufacturers blasted President Barack Obama’s plan to make more Americans eligible for overtime pay, saying the move would stunt workers’ careers and cost companies billions.
The National Retail Federation says Obama’s proposed rule change to greatly increase how many salaried employees can claim overtime would force companies to use more part-time and entry-level workers. Businesses also may offer fewer promotions and convert salaried employees to hourly to avoid raising their pay, the NRF said.
…
Obama’s plan would make workers who earn a salary of as much as $970 a week, or about $50,000 a year, eligible to claim overtime under the Fair Labor Standards Act. The current threshold is $455 a week, or about $24,000 a year, which is below the poverty line for a family of four. This change would benefit 4.68 million people, the White House said Tuesday on its website.An analysis by the Economic Policy Institute showed large increases in the percentage of workers that would be eligible for overtime if the threshold were raised to a level similar to Obama’s proposal. Among retail supervisors, about 56 percent would be covered, up from 8 percent. The group calculated comparable jumps for restaurant managers, insurance clerks and customer-service representatives.
This is another step in the process of improving North American productivity, in conjunction with minimum wage changes. A few businesses will, no doubt, go under. Good. If your business operating model can be summed up as ‘Sweat Your Labour’, then the faster you go bankrupt the better it will be for those of us who prefer a more skilful approach.
Speaking of productivity I was thrilled to learn of a bricklaying robot:
As robots get smarter, cheaper and more versatile, they’re taking on a growing number of challenges – and bricklaying can now be added to the list. Engineers in Perth, Australia, have created a fully working house-building machine that can create the brick framework of a property in just two days, working about 20 times faster than a human bricklayer.
Named Hadrian (after Hadrian’s Wall in the UK), the robot has a top laying speed of 1,000 bricks per hour, which works out as the equivalent of about 150 homes a year. Of course there’s no need for the machine to sleep, eat or take tea breaks either, giving it another advantage over manual laborers.
At the heart of Hadrian is a 28 m (92 ft) articulated telescopic boom. Though mounted on an excavator in the photo below, the finished version will sit on a truck, allowing it easier movement from place to place. The robot brick-layer uses information fed from a 3D CAD representation of the home for brick placement, with mortar or adhesive delivered under pressure to the head of the boom.
Impressive! And according to the company video, it builds proper double-brick houses instead of this frame crap we adore in Canada. It’s too bad the engineering for this initiative was done in Australia, but not in Canada … but I suppose in Canada we’re plenty productive enough already, eh?
And Jody Shenn of Bloomberg made an excellent point at the end of her story about lending to shadow-banks:
U.S. banks’ loans to nondepository financial companies, or shadow banks, have jumped more than 230 percent over the past three years, according to the semiannual risk perspective report released by the Office of the Comptroller of the Currency on Tuesday. They were the fifth-largest category of commercial-loan holdings at banks at the end of last year, up from the 11th spot at the end of 2011.
…
It’s not just banks that are offering nonbanks a helping hand.Another report released Tuesday, from the overseer of Fannie Mae and Freddie Mac, shows that those companies may also be playing a role, as they increase the fees they charge lenders to guarantee mortgages.
Over the past two years, the mortgage giants have been charging small lenders less (on a risk-adjusted basis) to guarantee loans than they charge large ones, in a switch from the past, according to the report. And many of those small lenders are nonbanks.
In other words, if you push risk down in one place, it can pop up in another place that may not be so far removed from the first.
I thought that was an interesting nugget regarding the elimination of incentives for volume. It’s true!
December 2012
FHFA directs Enterprises to implement an additional 10 basis point average increase, raise 30-year fees by more than 15-year fees to better align returns across both products, and make changes intended to increase fees by more for larger lenders in order to remove fee concessions for volume of deliveries.
I can’t seem to find anything regarding the rationale for this peculiar action.
The Canadian preferred share market ended a horrible month on a positive note, with PerpetualDiscounts winning 22bp, FixedResets gaining 11bp and DeemedRetractibles up 18bp. The Performance Highlights table is its usual lengthy self. Volume was low.
For as long as the FixedReset market is so violently unsettled, I’ll keep publishing updates of the more interesting and meaningful series of FixedResets’ Implied Volatilities. This doesn’t include Enbridge because although Enbridge has a large number of issues outstanding, all of which are quite liquid, the range of Issue Reset Spreads is too small for decent conclusions. The low is 212bp (ENB.PR.H; second-lowest is ENB.PR.D at 237bp) and the high is a mere 268 for ENB.PF.G.
Remember that all rich /cheap assessments are:
» based on Implied Volatility Theory only
» are relative only to other FixedResets from the same issuer
» assume constant GOC-5 yield
» assume constant Implied Volatility
» assume constant spread
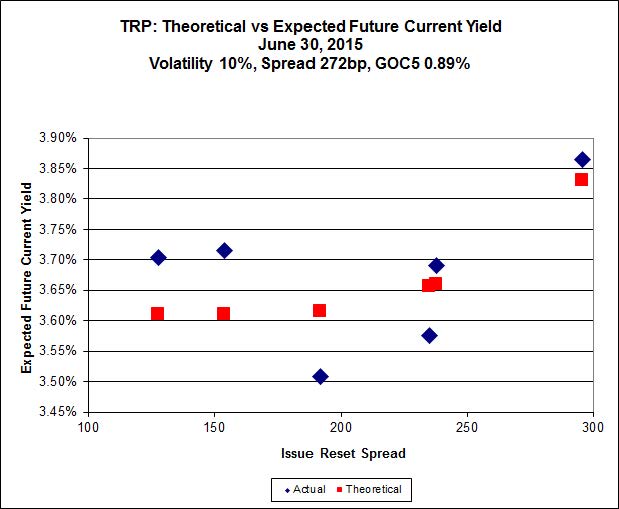
Here’s TRP:
Click for Big
TRP.PR.A, which resets 2019-12-31 at +192, is bid at 20.02 to be $0.58 rich, while TRP.PR.C, resetting 2016-1-30 at +154, is $0.48 cheap at its bid price of 16.35.
Click for Big
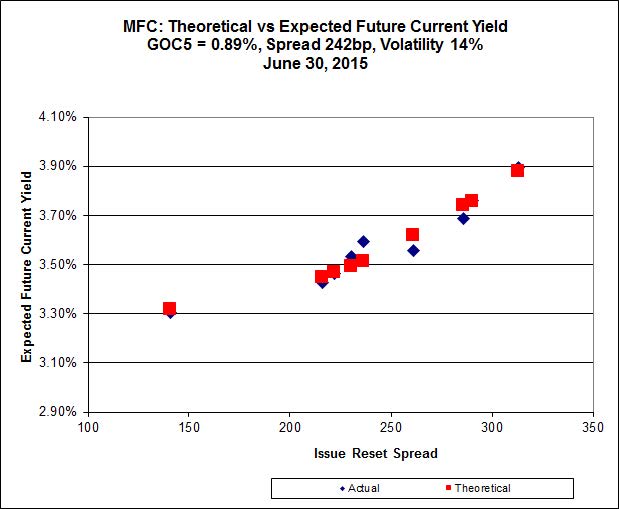
Another excellent fit, but the numbers are perplexing. Implied Volatility for MFC continues to be a conundrum. It is still too high if we consider that NVCC rules will never apply to these issues; it is still too low if we consider them to be NVCC non-compliant issues (and therefore with Deemed Maturities in the call schedule). The lowest spread issue, MFC.PR.F, is again noticeably off the line defined by the higher-spread issues.
Most expensive is MFC.PR.J, resetting at +261bp on 2018-3-19, bid at 24.61 to be $0.44 rich, while MFC.PR.M, resetting at +236bp on 2019-12-19, is bid at 22.60 to be $0.53 cheap.
Click for Big
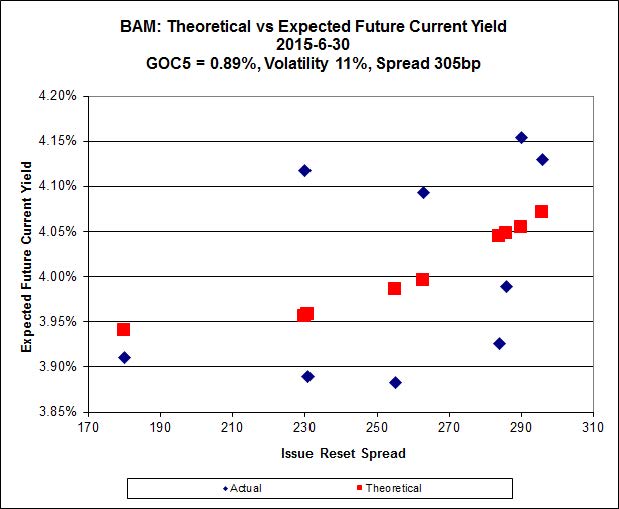
The cheapest issue relative to its peers is BAM.PR.R, resetting at +230bp on 2016-6-30, bid at 19.37 to be $0.79 cheap. BAM.PF.G, resetting at +284bp 2020-6-30 is bid at 23.75 and appears to be $0.69 rich.
Click for Big
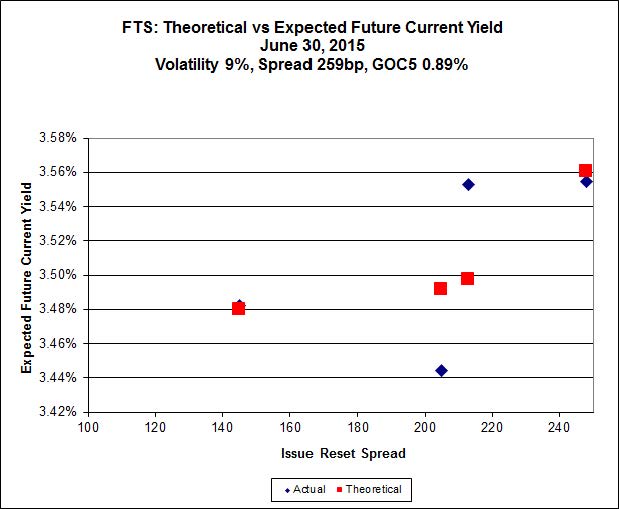
FTS.PR.G, with a spread of +213bp, and bid at 21.25, looks $0.34 cheap and resets 2018-9-1. FTS.PR.K, with a spread of +205bp and resetting 2019-3-1, is bid at 21.34 and is $0.29 rich.
That’s the first time since I started publishing these charts regularly that FTS.PR.H has not been the cheapest issue; it is therefore interesting to see just how good Implied Volatility Theory has been as a predictor of returns since January 23, a date for which the Fortis issues were examined in detail in the post Effect of Varying GOC-5 Rate On Implied Volatility Rich/Cheap Analysis.
| FTS FixedResets: Characteristics | |||
| Ticker | Current Dividend |
Issue Reset Spread |
Next Exchange Date |
| FTS.PR.G | 0.9708 | +213 | 2018-9-1 |
| FTS.PR.H | 1.0625 | +145 | 2015-6-1 |
| FTS.PR.K | 1.00 | +205 | 2019-3-1 |
| FTS.PR.M | 1.025 | +248 | 2019-12-1 |
| FTS.PR.H has since reset at 2.50% | |||
| FTS FixedResets: Comparison of 2015-1-23 and 2015-6-30 Actual Prices |
|||||
| Ticker | Bid Price 2015-1-23 |
Rich / (Cheap) 2015-1-23 |
Bid Price 2015-6-30 |
Rich / (Cheap) 2015-6-30 |
Total Return 2015-1-23 to 2015-6-30 |
| FTS.PR.G | 24.70 | 0.13 | 21.25 | (0.34) | -12.26% |
| FTS.PR.H | 18.28 | (0.88) | 16.80 | (0.01) | -5.12% |
| FTS.PR.K | 25.15 | 1.12 | 21.34 | 0.29 | -12.99% |
| FTS.PR.M | 25.58 | (0.70) | 23.70 | 0.04 | -5.71% |
| FTS FixedResets: Comparison of 2015-1-23 and 2015-6-30 Fair Value Prices |
|||
| Ticker | Fair Value 2015-1-23 |
Fair Value 2015-6-30 |
"Fair" Return 2015-1-23 to 2015-6-30 |
| FTS.PR.G | 24.57 | 21.59 | -10.22% |
| FTS.PR.H | 19.16 | 16.81 | -9.42% |
| FTS.PR.K | 24.03 | 21.05 | -10.46% |
| FTS.PR.M | 26.28 | 23.66 | -8.10% |
| Total return calculated with reinvestment of dividends on the ex-date at actual prices, not "fair" prices | |||
Well … I’d say Implied Volatility worked pretty well!
Click for Big
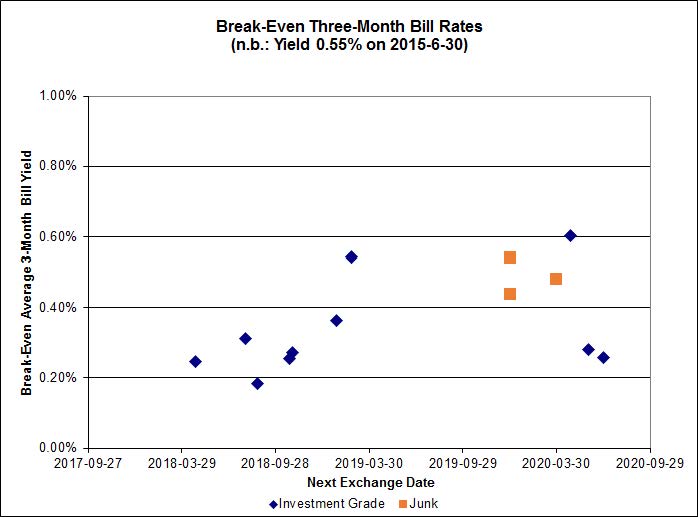
Investment-grade pairs predict an average three-month bill yield over the next five-odd years of about 0.36%, including the outlier TRP.PR.A / TRP.PR.F at -0.09 and the new SLF.PR.G / SLF.PR.J pair at +1.08%. On the junk side there are three outliers: FFH.PR.E / FFH.PR.F at -0.64%; BRF.PR.A / BRF.PR.B at -0.88%; and DC.PR.B / DC.PR.D at -0.24%.
Click for Big
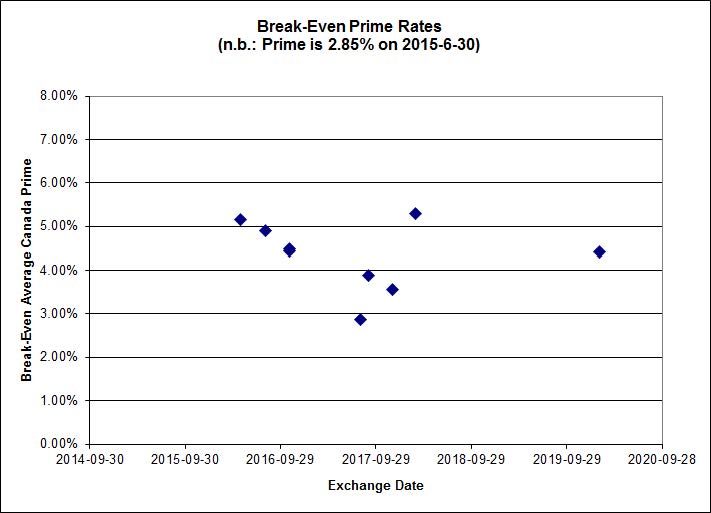
Shall we just say that this exhibits a high level of confidence in the continued rapacity of Canadian banks?
| HIMIPref™ Preferred Indices These values reflect the December 2008 revision of the HIMIPref™ Indices Values are provisional and are finalized monthly |
|||||||
| Index | Mean Current Yield (at bid) |
Median YTW |
Median Average Trading Value |
Median Mod Dur (YTW) |
Issues | Day’s Perf. | Index Value |
| Ratchet | 0.00 % | 0.00 % | 0 | 0.00 | 0 | 2.3327 % | 2,247.9 |
| FixedFloater | 0.00 % | 0.00 % | 0 | 0.00 | 0 | 2.3327 % | 3,930.4 |
| Floater | 3.45 % | 3.47 % | 60,674 | 18.57 | 3 | 2.3327 % | 2,389.7 |
| OpRet | 4.79 % | -4.82 % | 22,401 | 0.08 | 1 | 0.0392 % | 2,774.8 |
| SplitShare | 4.59 % | 4.80 % | 68,624 | 3.25 | 3 | 0.2281 % | 3,251.9 |
| Interest-Bearing | 0.00 % | 0.00 % | 0 | 0.00 | 0 | 0.0392 % | 2,537.3 |
| Perpetual-Premium | 5.50 % | 5.10 % | 64,414 | 4.21 | 19 | -0.0668 % | 2,512.9 |
| Perpetual-Discount | 5.28 % | 5.20 % | 118,505 | 15.07 | 15 | 0.2233 % | 2,665.2 |
| FixedReset | 4.51 % | 3.77 % | 228,423 | 16.34 | 88 | 0.1074 % | 2,329.1 |
| Deemed-Retractible | 5.01 % | 4.69 % | 110,914 | 0.64 | 34 | 0.1759 % | 2,620.1 |
| FloatingReset | 2.96 % | 3.23 % | 41,834 | 6.01 | 11 | -0.1035 % | 2,329.2 |
| Performance Highlights | |||
| Issue | Index | Change | Notes |
| FTS.PR.I | FloatingReset | -3.03 % | YTW SCENARIO Maturity Type : Limit Maturity Maturity Date : 2045-06-30 Maturity Price : 16.00 Evaluated at bid price : 16.00 Bid-YTW : 3.71 % |
| TRP.PR.A | FixedReset | -2.29 % | YTW SCENARIO Maturity Type : Limit Maturity Maturity Date : 2045-06-30 Maturity Price : 20.02 Evaluated at bid price : 20.02 Bid-YTW : 3.68 % |
| GWO.PR.N | FixedReset | -1.63 % | YTW SCENARIO Maturity Type : Hard Maturity Maturity Date : 2025-01-31 Maturity Price : 25.00 Evaluated at bid price : 16.85 Bid-YTW : 7.08 % |
| ENB.PR.J | FixedReset | -1.31 % | YTW SCENARIO Maturity Type : Limit Maturity Maturity Date : 2045-06-30 Maturity Price : 19.54 Evaluated at bid price : 19.54 Bid-YTW : 4.74 % |
| BAM.PF.E | FixedReset | -1.29 % | YTW SCENARIO Maturity Type : Limit Maturity Maturity Date : 2045-06-30 Maturity Price : 21.75 Evaluated at bid price : 22.15 Bid-YTW : 4.17 % |
| MFC.PR.L | FixedReset | -1.16 % | YTW SCENARIO Maturity Type : Hard Maturity Maturity Date : 2025-01-31 Maturity Price : 25.00 Evaluated at bid price : 22.25 Bid-YTW : 4.94 % |
| TRP.PR.G | FixedReset | -1.15 % | YTW SCENARIO Maturity Type : Limit Maturity Maturity Date : 2045-06-30 Maturity Price : 23.11 Evaluated at bid price : 24.91 Bid-YTW : 3.77 % |
| PWF.PR.P | FixedReset | -1.10 % | YTW SCENARIO Maturity Type : Limit Maturity Maturity Date : 2045-06-30 Maturity Price : 18.00 Evaluated at bid price : 18.00 Bid-YTW : 3.65 % |
| FTS.PR.G | FixedReset | -1.02 % | YTW SCENARIO Maturity Type : Limit Maturity Maturity Date : 2045-06-30 Maturity Price : 21.25 Evaluated at bid price : 21.25 Bid-YTW : 3.77 % |
| ENB.PF.A | FixedReset | 1.00 % | YTW SCENARIO Maturity Type : Limit Maturity Maturity Date : 2045-06-30 Maturity Price : 20.20 Evaluated at bid price : 20.20 Bid-YTW : 4.71 % |
| MFC.PR.C | Deemed-Retractible | 1.03 % | YTW SCENARIO Maturity Type : Hard Maturity Maturity Date : 2025-01-31 Maturity Price : 25.00 Evaluated at bid price : 22.50 Bid-YTW : 5.93 % |
| ENB.PR.T | FixedReset | 1.09 % | YTW SCENARIO Maturity Type : Limit Maturity Maturity Date : 2045-06-30 Maturity Price : 18.50 Evaluated at bid price : 18.50 Bid-YTW : 4.83 % |
| BAM.PR.N | Perpetual-Discount | 1.12 % | YTW SCENARIO Maturity Type : Limit Maturity Maturity Date : 2045-06-30 Maturity Price : 20.77 Evaluated at bid price : 20.77 Bid-YTW : 5.76 % |
| ENB.PR.D | FixedReset | 1.14 % | YTW SCENARIO Maturity Type : Limit Maturity Maturity Date : 2045-06-30 Maturity Price : 17.70 Evaluated at bid price : 17.70 Bid-YTW : 4.84 % |
| ELF.PR.F | Perpetual-Premium | 1.15 % | YTW SCENARIO Maturity Type : Limit Maturity Maturity Date : 2045-06-30 Maturity Price : 24.23 Evaluated at bid price : 24.53 Bid-YTW : 5.40 % |
| VNR.PR.A | FixedReset | 1.27 % | YTW SCENARIO Maturity Type : Limit Maturity Maturity Date : 2045-06-30 Maturity Price : 23.09 Evaluated at bid price : 24.00 Bid-YTW : 3.96 % |
| BMO.PR.T | FixedReset | 1.29 % | YTW SCENARIO Maturity Type : Limit Maturity Maturity Date : 2045-06-30 Maturity Price : 22.18 Evaluated at bid price : 22.75 Bid-YTW : 3.62 % |
| BAM.PR.M | Perpetual-Discount | 1.41 % | YTW SCENARIO Maturity Type : Limit Maturity Maturity Date : 2045-06-30 Maturity Price : 20.90 Evaluated at bid price : 20.90 Bid-YTW : 5.72 % |
| BAM.PR.C | Floater | 1.41 % | YTW SCENARIO Maturity Type : Limit Maturity Maturity Date : 2045-06-30 Maturity Price : 14.35 Evaluated at bid price : 14.35 Bid-YTW : 3.47 % |
| BAM.PF.B | FixedReset | 1.42 % | YTW SCENARIO Maturity Type : Limit Maturity Maturity Date : 2045-06-30 Maturity Price : 21.50 Evaluated at bid price : 21.50 Bid-YTW : 4.30 % |
| TRP.PR.C | FixedReset | 1.55 % | YTW SCENARIO Maturity Type : Limit Maturity Maturity Date : 2045-06-30 Maturity Price : 16.35 Evaluated at bid price : 16.35 Bid-YTW : 3.80 % |
| BAM.PR.T | FixedReset | 1.83 % | YTW SCENARIO Maturity Type : Limit Maturity Maturity Date : 2045-06-30 Maturity Price : 20.57 Evaluated at bid price : 20.57 Bid-YTW : 4.09 % |
| TD.PF.C | FixedReset | 1.98 % | YTW SCENARIO Maturity Type : Limit Maturity Maturity Date : 2045-06-30 Maturity Price : 22.09 Evaluated at bid price : 22.65 Bid-YTW : 3.64 % |
| RY.PR.Z | FixedReset | 2.16 % | YTW SCENARIO Maturity Type : Limit Maturity Maturity Date : 2045-06-30 Maturity Price : 22.44 Evaluated at bid price : 23.15 Bid-YTW : 3.53 % |
| BAM.PR.B | Floater | 2.35 % | YTW SCENARIO Maturity Type : Limit Maturity Maturity Date : 2045-06-30 Maturity Price : 14.79 Evaluated at bid price : 14.79 Bid-YTW : 3.37 % |
| BAM.PR.K | Floater | 3.25 % | YTW SCENARIO Maturity Type : Limit Maturity Maturity Date : 2045-06-30 Maturity Price : 14.29 Evaluated at bid price : 14.29 Bid-YTW : 3.49 % |
| Volume Highlights | |||
| Issue | Index | Shares Traded |
Notes |
| RY.PR.K | FloatingReset | 59,000 | Nesbitt crossed 25,000 at 24.41. YTW SCENARIO Maturity Type : Hard Maturity Maturity Date : 2022-01-31 Maturity Price : 25.00 Evaluated at bid price : 24.40 Bid-YTW : 3.23 % |
| ENB.PR.F | FixedReset | 56,853 | Scotia crossed blocks of 35,000 and 12,000, both at 18.20. YTW SCENARIO Maturity Type : Limit Maturity Maturity Date : 2045-06-30 Maturity Price : 18.25 Evaluated at bid price : 18.25 Bid-YTW : 4.87 % |
| TD.PF.C | FixedReset | 45,300 | Scotia crossed 25,000 at 22.70. YTW SCENARIO Maturity Type : Limit Maturity Maturity Date : 2045-06-30 Maturity Price : 22.09 Evaluated at bid price : 22.65 Bid-YTW : 3.64 % |
| TRP.PR.A | FixedReset | 39,530 | TD crossed 37,000 at 20.55. YTW SCENARIO Maturity Type : Limit Maturity Maturity Date : 2045-06-30 Maturity Price : 20.02 Evaluated at bid price : 20.02 Bid-YTW : 3.68 % |
| RY.PR.L | FixedReset | 37,200 | TD crossed blocks of 10,000 and 15,200, both at 25.92. YTW SCENARIO Maturity Type : Call Maturity Date : 2019-02-24 Maturity Price : 25.00 Evaluated at bid price : 25.89 Bid-YTW : 3.36 % |
| BMO.PR.T | FixedReset | 28,106 | Desjardins crossed 18,300 at 22.85. YTW SCENARIO Maturity Type : Limit Maturity Maturity Date : 2045-06-30 Maturity Price : 22.18 Evaluated at bid price : 22.75 Bid-YTW : 3.62 % |
| There were 22 other index-included issues trading in excess of 10,000 shares. | |||
| Wide Spread Highlights | ||
| Issue | Index | Quote Data and Yield Notes |
| FTS.PR.I | FloatingReset | Quote: 16.00 – 16.98 Spot Rate : 0.9800 Average : 0.6831 YTW SCENARIO |
| HSE.PR.E | FixedReset | Quote: 24.05 – 24.80 Spot Rate : 0.7500 Average : 0.5393 YTW SCENARIO |
| CM.PR.O | FixedReset | Quote: 22.95 – 23.45 Spot Rate : 0.5000 Average : 0.3706 YTW SCENARIO |
| MFC.PR.M | FixedReset | Quote: 22.60 – 23.15 Spot Rate : 0.5500 Average : 0.4271 YTW SCENARIO |
| TRP.PR.A | FixedReset | Quote: 20.02 – 20.49 Spot Rate : 0.4700 Average : 0.3500 YTW SCENARIO |
| FTS.PR.J | Perpetual-Discount | Quote: 23.20 – 23.75 Spot Rate : 0.5500 Average : 0.4327 YTW SCENARIO |