The Boston Fed published a paper by Eva Liebmann and Joe Peek titled Global Standards for Liquidity Regulation:
Liquidity risk has received increased attention recently, especially in light of the 2007 – 2009 financial crisis, when banks’ extensive reliance on short-term funding, maturity mismatches between assets and liabilities, and insufficient liquidity buffers made them quite susceptible to liquidity risk. To mitigate such risk, the Basel Committee on Banking Supervision (BCBS) introduced an improved global capital framework and new global liquidity standards for banks in December 2010 in the form of the new Basel Accord (Basel III). This brief offers insights from the crisis experience, identifies the problems that the new liquidity regulation aims to address, and summarizes underlying differences between the United States and Europe that may affect the ability to design and implement consistent global standards.
Regrettably, there is only a brief nod to the role of the central banks:
In addition, the U.S. Federal Reserve (like some other central banks) replaced funding normally provided in these money markets by using a mix of traditional and less traditional policy tools, including emergency liquidity facilities. Carlson et al. (2015) argue in this context that liquidity regulations combined with other regulatory tools are important complements to the LOLR tool and are particularly valuable in mitigating moral hazard. While the existence of the LOLR is important during a systemic shock such as the 2007–2009 financial crisis, it is as important to have in place at individual financial institutions liquidity buffers that can be run down in response to an idiosyncratic shock.
The referenced “Carlson et al.” paper is by Mark Carlson, Burcu Duygan-Bump, and William Nelson, titled Why Do We Need Both Liquidity Regulations and a Lender of Last Resort? A Perspective from Federal Reserve Lending during the 2007–09 U.S. Financial Crisis:
During the 2007–09 financial crisis, there were severe reductions in the liquidity of financial markets, runs on the shadow banking system, and destabilizing defaults and near-defaults of major financial institutions. In response, the Federal Reserve, in its role as lender of last resort (LOLR), injected extraordinary amounts of liquidity. In the aftermath, lawmakers and regulators have taken steps to reduce the likelihood that such lending would be required in the future, including the introduction of liquidity regulations. These changes were motivated in part by the argument that central bank lending entails extremely high costs and should be made unnecessary by liquidity regulations. By contrast, some have argued that the loss of liquidity was the result of market failures, and that central banks can solve such failures by lending, making liquidity regulations unnecessary. In this paper, we argue that LOLR lending and liquidity regulations are complementary tools. Liquidity shortfalls can arise for two very different reasons: First, sound institutions can face runs or a deterioration in the liquidity of markets they depend on for funding. Second, solvency concerns can cause creditors to pull away from troubled institutions. Using examples from the recent crisis, we argue that central bank lending is the best response in the former situation, while orderly resolution (by the institution as it gets through the problem on its own or via a controlled failure) is the best response in the second situation. We also contend that liquidity regulations are a necessary tool in both situations: They help ensure that the authorities will have time to assess the nature of the shortfall and arrange the appropriate response, and they provide an incentive for banks to internalize the externalities associated with any liquidity risks.
These authors acknowledge the politicized nature of the regulatory change:
The scale of Federal Reserve intervention in financial markets during the crisis generated considerable controversy, and U.S. lawmakers and regulators subsequently took various steps to reduce the chances of a future financial crisis and to reduce the likelihood that lending by the Federal Reserve would be required in the future even if there were a financial crisis. For example, as part of the Basel III liquidity and capital rules, liquidity regulations were implemented that require banks to maintain more liquid balance sheets. Additionally, to prevent Federal Reserve loans from being used to support failing institutions, the authority of the Federal Reserve to provide emergency liquidity to individual nonbank institutions was eliminated.
Part of the motivation for these regulatory and legal changes was the view that central bank lending was itself a bad thing—that the loans were bailouts of financial institutions that protected them from the consequences of their risky behavior. Within the economic literature, moral hazard is seen as the principle cost associated with central bank lending as it encourages institutions to take on more risk than they would otherwise.3 Some have also criticized this lending on the grounds that it pushed central bank policy into fiscal policy and threatened the independence of the Federal Reserve.4 These concerns have led to proposals by some to eliminate even the remaining emergency authority of the Federal Reserve to lend in “unusual and exigent circumstances.”5
The view that LOLR loans are “bailouts of financial institutions” is indeed common: it is held, for example, by Canadian Centre for Policy Alternatives senior economist David Macdonald:
“At some point during the crisis, three of Canada’s banks — CIBC, BMO, and Scotiabank — were completely under water, with government support exceeding the market value of the company,” Macdonald said.
“Without government supports to fall back on, Canadian banks would have been in serious trouble.”
…
One of the most well-known ways in which policymakers helped the banks during the crisis is through a $69-billion CMHC program whereby the housing agency took mortgages off the balance sheets of big Canadian banks. In contrast with other support facilities, all of the funds granted by the CMHC were through selling assets (in this case mortgages) to the housing agency. They were not funds that had to be paid back.
…
“The federal government claims it was offering the banks ‘liquidity support,’ but it looks an awful lot like a bailout to me,” says Macdonald.
…
“It would have been cheaper to buy every single share in these companies,” Macdonald said.
However, neither I nor any thinking person should be swayed by the screaming of slogan chanters with insufficient economic expertise to differentiate between insolvency and illiquidity. The fact that the Fed paper takes such pig-ignorant ravings into account for public policy purposes detracts from the credibility of the paper.
Getting back to the Fed paper, Assiduous Readers will recall that I subscribe to the classical view:
The literature on the LOLR similarly provides a long range of these alternative views, which are well summarized in Freixas et al. (1999) and Bordo (1990). The classical position, often attributed to Bagehot (1873) and Thornton (1802), is that the LOLR should provide funding freely to illiquid but solvent institutions against high-quality collateral and at a penalty rate to allay a panic. However, the literature is full of papers pointing to the difficulties of distinguishing between liquidity and solvency problems, especially during a crisis, as well as the potential problems with how to define and impose a penalty rate (see, for instance, Goodhart, 1999).
These issues lead, on the one extreme, to the view that the Federal Reserve should only provide liquidity to the market as a whole via open market operations, but not to individual banks, since liquidity would then be allocated to individual, creditworthy banks via the interbank market (see Goodfriend and King, 1988; Bordo, 1990; and Schwartz, 1992 and 1995). On the other extreme is the view that the LOLR will have to assist illiquid and insolvent institutions at times, and that lending should not be at a penalty rate because the elevated rate could worsen the problems of a bank receiving support (see Goodhart, 1985 and 1987; Goodhart and Schoenmaker, 1995). The literature also has a long discussion of the moral hazard consequences as a cost that offsets the benefit of central bank lending as noted in Freixas et al. (1999), though there is also a range of perspectives that point out that the collapse of liquidity is a market failure and the central bank provision of liquidity is a public good. For instance, Holmstrom and Tirole (1998) note that public insurance against aggregate risks should allow firms to undertake more profitable activities with higher social return. Others note that there is no moral hazard as long as central banks provide the liquidity against properly priced collateral (for example, Buiter, 2007) or that moral hazard can be managed by various policies, such as constructive ambiguity (for example, Freixas, 1999) and regulations (for example, Cao and Illing, 2011).
Our paper’s main contribution to the literature is to reconcile these different perspectives by thinking of central bank lending as encompassing two very different types of liquidity demands and using that as a guide to think about the right mix of LOLR and regulatory tools. Moreover, our discussion on the Federal Reserve’s experience during the crisis also illustrates some of the key real-time issues faced by a LOLR that arise during a crisis and the associated limitations of a
LOLR as a policy tool.
I’ll keep reading and keep thinking … but currently I lean towards the view that the liquidity regulations largely exist as a politicized response to criticism from the ignorant and those who cynically manipulate the ignorant to serve their other political interests.
So I’ll take solace in the growing recognition that circuit-breakers do not work as intended. Sadly, the response to ‘rules not working’ appears to be ‘more rules’:
When stocks were halted on Aug. 24, the result caused mayhem for many large ETFs because they became unmoored from their underlying share prices. The result was exaggerated swings in ETF prices, in excess of 40 per cent in some cases.
…
This week, securities officials said they were considering changes to the measures meant to control extreme volatility. “Everything is on the table,” said Steve Crutchfield, head of exchange-traded products at the New York Stock Exchange. In Canada, the Investment Industry Regulatory Organization of Canada recently produced new guidance on stock price thresholds to reduce unexplained volatility. The new guidance is designed to prevent orders from being executed at prices more than 10 per cent different from market prices on ETFs and actively traded stocks.
Meanwhile, the US jobs number was entertainingly ambiguous:
Data today showed U.S. employers added 173,000 workers in August and the jobless rate dropped to 5.1 percent. The gain in payrolls, while less than forecast, followed advances in July and June that were stronger than previously reported. The unemployment rate is the lowest since April 2008. Average hourly earnings climbed more than forecast and workers put in a longer workweek, the report also showed.
The jobs report is the last major data point before the Fed meets later this month on Sept. 16-17 to discuss the timing of its first increase in interest rates in nearly a decade. Investors raised bets on a September liftoff to 30 percent from 26 percent before the jobs data, while that’s still less than the 48 percent odds predicted before China devalued the yuan on Aug. 11.
…
Fed Bank of Richmond President Jeffrey Lacker said the central bank should end the era of record-low interest rates, now that the impacts from winter weather and energy prices have passed. He said labor-market slack has been reduced to pre-recession levels, and shorter-term inflation measures are tracking the U.S. central bank’s 2 percent target.“It’s time to align our monetary policy with the significant progress we have made,” Lacker said in the text of a speech in Richmond.
The Canadian number was considered encouraging by some:
For months now, Mr. Poloz has been anxiously waiting for lower interest rates, the cheaper dollar and a resurgent U.S. economy to take the sting out of the oil-price collapse.
Mr. Poloz finally got a hint of that in the July trade numbers. Canadian merchandise exports grew 2.3 per cent, paced by double-digit gains in autos and aircraft. That helped shrink the trade deficit to its lowest level since last November.
And on Friday there was more evidence that Canada’s slump was fleeting, and distinctly unrecession-like. The economy generated another 12,000 jobs in August, proving the country’s labour market remains surprisingly resilient. The gains were paced by new full-time and government jobs.
… and less encouraging by others:
The Canadian dollar closed at 75.39 cents (U.S.) on Friday, down 0.40 cents from Thursday.
The loonie was under pressure after a lacklustre Labour Force Survey was released from Statistics Canada. The jobs report shows employment in Canada was little changed in August. Last month, Canada added a mere 12,000 jobs or an increase of 0.1 per cent to the labour force. Despite the increase, national unemployment ticked up 0.2 percentage points to 7.0 per cent, as more people in Canada searched for a job.
…
The loonie was also dragged by lower oil prices. West Texas Intermediate (WTI) crude closed down 70 cents (U.S.) at $46.05 (U.S.).Markets on both sides of the border will be closed on Monday to mark Labour Day. An announcement from the Bank of Canada on interest rates and a release Wednesday, from Statistics Canada, of key housing starts and building permits data for July could affect the Canadian dollar next week.
R Split III Corp, proud issuer of RBS.PR.B, was confirmed at Pfd-2 by DBRS:
The main form of credit enhancement available to the Preferred Shares is a buffer of downside protection. Downside protection corresponds to the percentage decline in the market value of the Portfolio that must be experienced before the Preferred Shares would be in a loss position. The amount of downside protection available to the Preferred Shares as of August 27, 2015, is 72.3%.
The dividend coverage ratio is approximately 3.1 times. Other key rating factors include the downside protection stability in recent months, the credit quality and concentration of the Portfolio in one asset and the approaching maturity date of the Preferred Shares. Based on these considerations and aforementioned performance metrics, DBRS has confirmed the Pfd-2 rating of the Preferred Shares.
Dividend 15 Split Corp., proud issuer of DFN.PR.A, was confirmed at Pfd-3 by DBRS:
The payment of the Class A Share distributions results in an average annual grind on the Portfolio NAV of approximately 6.2% over the next four years. No monthly distributions to the Class A Shares will be made if the dividends of the Preferred Shares are in arrears or if the NAV of the Company falls below 1.5 times the principal amount of the outstanding Preferred Shares. Furthermore, no special distributions will be made if the NAV of the Company is below $25.
The amount of downside protection available to the Preferred Shares as of August 28, 2015, is 52.1%. The Preferred Share dividend coverage ratio is approximately 1.1 times.
One particular strength of the Portfolio is the consistency of dividend distributions of the underlying companies to date. Some potential areas of concern include the Portfolio concentration in the financial services and insurance industry. In addition, volatility of prices and possible future changes in the dividend policies of the underlying companies in the Portfolio may result in reductions in downside protection and dividend coverage.
Based on these considerations and the aforementioned performance metrics, DBRS confirms the Pfd-3 rating of the Dividend 15 Split Corp. Preferred Shares.
It was another good day for the Canadian preferred share market, with PerpetualDiscounts up 24bp, FixedResets winning 52bp and DeemedRetractibles gaining 4bp. The Performance Highlights table is suitably long. Volume was infinitesimal, as practitioners of the highest paid profession on earth took the day off enjoy the sunshine and complain about the poor service at patio bars.
For as long as the FixedReset market is so violently unsettled, I’ll keep publishing updates of the more interesting and meaningful series of FixedResets’ Implied Volatilities. This doesn’t include Enbridge because although Enbridge has a large number of issues outstanding, all of which are quite liquid, the range of Issue Reset Spreads is too small for decent conclusions. The low is 212bp (ENB.PR.H; second-lowest is ENB.PR.D at 237bp) and the high is a mere 268 for ENB.PF.G.
Remember that all rich /cheap assessments are:
» based on Implied Volatility Theory only
» are relative only to other FixedResets from the same issuer
» assume constant GOC-5 yield
» assume constant Implied Volatility
» assume constant spread
Here’s TRP:

Click for Big
TRP.PR.E, which resets 2019-10-30 at +235, is bid at 19.70 to be $0.86 rich, while TRP.PR.C, resetting 2016-1-30 at +164, is $0.97 cheap at its bid price of 13.13.
Click for Big
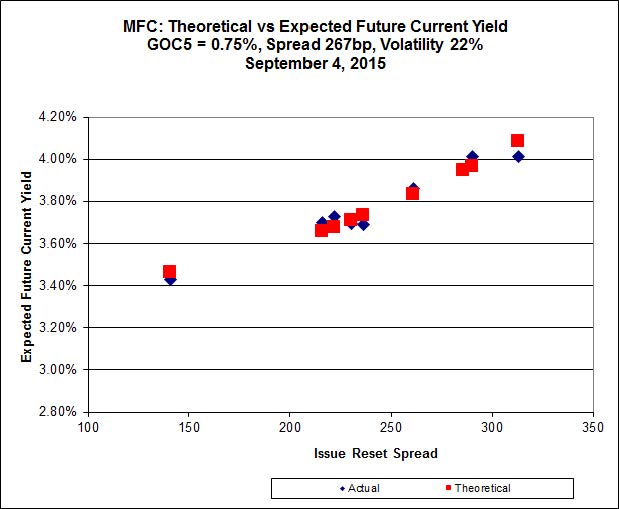
Another good fit today for MFC, with Implied Volatility dropping a bit again today.
Most expensive is MFC.PR.H, resetting at +313bp on 2017-3-19, bid at 24.18 to be 0.44 rich, while MFC.PR.G, resetting at +290bp on 2016-12-19, is bid at 22.75 to be 0.27 cheap.
Click for Big
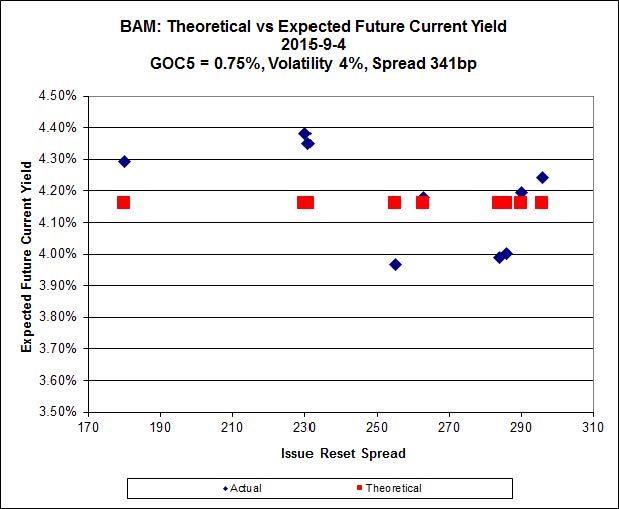
The fit on the BAM issues continues to be horrible.
The cheapest issue relative to its peers is BAM.PR.R, resetting at +230bp on 2016-6-30, bid at 17.40 to be $0.93 cheap. BAM.PF.E, resetting at +255bp on 2020-3-31 is bid at 20.80 and appears to be $0.97 rich.
Click for Big
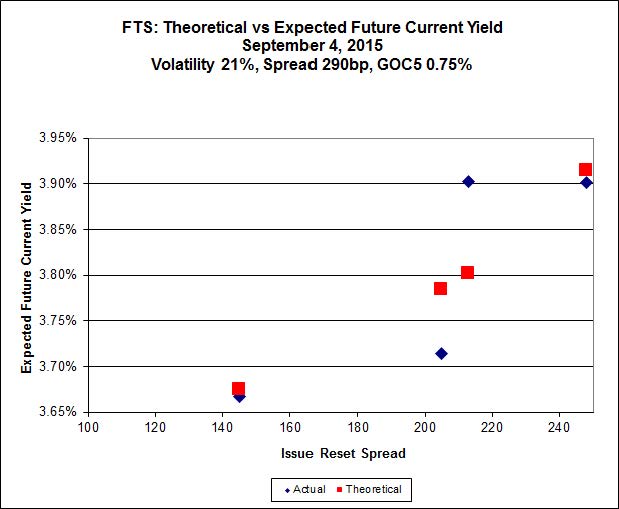
FTS.PR.K, with a spread of +205bp, and bid at 18.85, looks $0.35 expensive and resets 2019-3-1. FTS.PR.G, with a spread of +213bp and resetting 2018-9-1, is bid at 18.45 and is $0.49 cheap.

Click for Big
Investment-grade pairs predict an average three-month bill yield over the next five-odd years of -1.01%, with no outliers; not only that, but all data points are negative! Note that the distribution is bimodal, with NVCC non-compliant bank issues averaging -1.28% and the unregulated issues averaging -0.64%. There are two junk outliers below -1.80% and one above +0.20%.
Click for Big
Shall we just say that this exhibits a high level of confidence in the continued rapacity of Canadian banks?
| HIMIPref™ Preferred Indices These values reflect the December 2008 revision of the HIMIPref™ Indices Values are provisional and are finalized monthly |
|||||||
| Index | Mean Current Yield (at bid) |
Median YTW |
Median Average Trading Value |
Median Mod Dur (YTW) |
Issues | Day’s Perf. | Index Value |
| Ratchet | 0.00 % | 0.00 % | 0 | 0.00 | 0 | -1.6225 % | 1,632.0 |
| FixedFloater | 0.00 % | 0.00 % | 0 | 0.00 | 0 | -1.6225 % | 2,853.5 |
| Floater | 4.50 % | 4.56 % | 58,007 | 16.22 | 3 | -1.6225 % | 1,734.9 |
| OpRet | 0.00 % | 0.00 % | 0 | 0.00 | 0 | -0.0948 % | 2,771.5 |
| SplitShare | 4.64 % | 5.05 % | 65,008 | 3.10 | 3 | -0.0948 % | 3,248.1 |
| Interest-Bearing | 0.00 % | 0.00 % | 0 | 0.00 | 0 | -0.0948 % | 2,534.3 |
| Perpetual-Premium | 5.73 % | 2.71 % | 58,767 | 0.08 | 8 | -0.0445 % | 2,489.0 |
| Perpetual-Discount | 5.45 % | 5.50 % | 74,244 | 14.61 | 30 | 0.2441 % | 2,595.3 |
| FixedReset | 4.70 % | 4.14 % | 181,049 | 16.09 | 74 | 0.5248 % | 2,161.4 |
| Deemed-Retractible | 5.15 % | 5.22 % | 101,067 | 5.52 | 33 | 0.0379 % | 2,577.5 |
| FloatingReset | 2.43 % | 3.80 % | 52,532 | 5.95 | 9 | 0.0487 % | 2,174.8 |
| Performance Highlights | |||
| Issue | Index | Change | Notes |
| BAM.PR.K | Floater | -2.63 % | YTW SCENARIO Maturity Type : Limit Maturity Maturity Date : 2045-09-04 Maturity Price : 10.36 Evaluated at bid price : 10.36 Bid-YTW : 4.62 % |
| MFC.PR.F | FixedReset | -1.69 % | YTW SCENARIO Maturity Type : Hard Maturity Maturity Date : 2025-01-31 Maturity Price : 25.00 Evaluated at bid price : 15.75 Bid-YTW : 7.99 % |
| CU.PR.F | Perpetual-Discount | -1.66 % | YTW SCENARIO Maturity Type : Limit Maturity Maturity Date : 2045-09-04 Maturity Price : 20.71 Evaluated at bid price : 20.71 Bid-YTW : 5.47 % |
| BAM.PR.B | Floater | -1.39 % | YTW SCENARIO Maturity Type : Limit Maturity Maturity Date : 2045-09-04 Maturity Price : 10.66 Evaluated at bid price : 10.66 Bid-YTW : 4.49 % |
| IFC.PR.A | FixedReset | -1.19 % | YTW SCENARIO Maturity Type : Hard Maturity Maturity Date : 2025-01-31 Maturity Price : 25.00 Evaluated at bid price : 16.65 Bid-YTW : 8.37 % |
| HSE.PR.C | FixedReset | -1.18 % | YTW SCENARIO Maturity Type : Limit Maturity Maturity Date : 2045-09-04 Maturity Price : 20.90 Evaluated at bid price : 20.90 Bid-YTW : 4.81 % |
| CU.PR.G | Perpetual-Discount | 1.02 % | YTW SCENARIO Maturity Type : Limit Maturity Maturity Date : 2045-09-04 Maturity Price : 20.86 Evaluated at bid price : 20.86 Bid-YTW : 5.43 % |
| BAM.PF.C | Perpetual-Discount | 1.08 % | YTW SCENARIO Maturity Type : Limit Maturity Maturity Date : 2045-09-04 Maturity Price : 21.43 Evaluated at bid price : 21.43 Bid-YTW : 5.77 % |
| RY.PR.M | FixedReset | 1.10 % | YTW SCENARIO Maturity Type : Limit Maturity Maturity Date : 2045-09-04 Maturity Price : 22.25 Evaluated at bid price : 22.97 Bid-YTW : 3.68 % |
| RY.PR.Z | FixedReset | 1.16 % | YTW SCENARIO Maturity Type : Limit Maturity Maturity Date : 2045-09-04 Maturity Price : 21.46 Evaluated at bid price : 21.81 Bid-YTW : 3.58 % |
| TD.PF.B | FixedReset | 1.16 % | YTW SCENARIO Maturity Type : Limit Maturity Maturity Date : 2045-09-04 Maturity Price : 21.42 Evaluated at bid price : 21.75 Bid-YTW : 3.63 % |
| TD.PF.C | FixedReset | 1.17 % | YTW SCENARIO Maturity Type : Limit Maturity Maturity Date : 2045-09-04 Maturity Price : 21.35 Evaluated at bid price : 21.65 Bid-YTW : 3.64 % |
| BMO.PR.W | FixedReset | 1.18 % | YTW SCENARIO Maturity Type : Limit Maturity Maturity Date : 2045-09-04 Maturity Price : 21.35 Evaluated at bid price : 21.35 Bid-YTW : 3.68 % |
| RY.PR.H | FixedReset | 1.21 % | YTW SCENARIO Maturity Type : Limit Maturity Maturity Date : 2045-09-04 Maturity Price : 21.54 Evaluated at bid price : 21.81 Bid-YTW : 3.63 % |
| VNR.PR.A | FixedReset | 1.21 % | YTW SCENARIO Maturity Type : Limit Maturity Maturity Date : 2045-09-04 Maturity Price : 20.04 Evaluated at bid price : 20.04 Bid-YTW : 4.60 % |
| NA.PR.W | FixedReset | 1.25 % | YTW SCENARIO Maturity Type : Limit Maturity Maturity Date : 2045-09-04 Maturity Price : 21.06 Evaluated at bid price : 21.06 Bid-YTW : 3.81 % |
| RY.PR.J | FixedReset | 1.30 % | YTW SCENARIO Maturity Type : Limit Maturity Maturity Date : 2045-09-04 Maturity Price : 22.51 Evaluated at bid price : 23.40 Bid-YTW : 3.69 % |
| BAM.PR.N | Perpetual-Discount | 1.33 % | YTW SCENARIO Maturity Type : Limit Maturity Maturity Date : 2045-09-04 Maturity Price : 21.30 Evaluated at bid price : 21.30 Bid-YTW : 5.68 % |
| BMO.PR.T | FixedReset | 1.35 % | YTW SCENARIO Maturity Type : Limit Maturity Maturity Date : 2045-09-04 Maturity Price : 21.54 Evaluated at bid price : 21.80 Bid-YTW : 3.61 % |
| CU.PR.C | FixedReset | 1.37 % | YTW SCENARIO Maturity Type : Limit Maturity Maturity Date : 2045-09-04 Maturity Price : 21.40 Evaluated at bid price : 21.40 Bid-YTW : 3.76 % |
| TRP.PR.B | FixedReset | 1.39 % | YTW SCENARIO Maturity Type : Limit Maturity Maturity Date : 2045-09-04 Maturity Price : 12.38 Evaluated at bid price : 12.38 Bid-YTW : 4.13 % |
| HSE.PR.E | FixedReset | 1.58 % | YTW SCENARIO Maturity Type : Limit Maturity Maturity Date : 2045-09-04 Maturity Price : 22.00 Evaluated at bid price : 22.50 Bid-YTW : 4.81 % |
| NA.PR.S | FixedReset | 1.63 % | YTW SCENARIO Maturity Type : Limit Maturity Maturity Date : 2045-09-04 Maturity Price : 21.45 Evaluated at bid price : 21.80 Bid-YTW : 3.79 % |
| MFC.PR.N | FixedReset | 1.67 % | YTW SCENARIO Maturity Type : Hard Maturity Maturity Date : 2025-01-31 Maturity Price : 25.00 Evaluated at bid price : 20.65 Bid-YTW : 5.88 % |
| BMO.PR.S | FixedReset | 1.73 % | YTW SCENARIO Maturity Type : Limit Maturity Maturity Date : 2045-09-04 Maturity Price : 21.98 Evaluated at bid price : 22.39 Bid-YTW : 3.59 % |
| MFC.PR.M | FixedReset | 1.74 % | YTW SCENARIO Maturity Type : Hard Maturity Maturity Date : 2025-01-31 Maturity Price : 25.00 Evaluated at bid price : 21.06 Bid-YTW : 5.69 % |
| FTS.PR.F | Perpetual-Discount | 1.75 % | YTW SCENARIO Maturity Type : Limit Maturity Maturity Date : 2045-09-04 Maturity Price : 22.43 Evaluated at bid price : 22.69 Bid-YTW : 5.42 % |
| BAM.PR.R | FixedReset | 1.93 % | YTW SCENARIO Maturity Type : Limit Maturity Maturity Date : 2045-09-04 Maturity Price : 17.40 Evaluated at bid price : 17.40 Bid-YTW : 4.59 % |
| FTS.PR.H | FixedReset | 2.04 % | YTW SCENARIO Maturity Type : Limit Maturity Maturity Date : 2045-09-04 Maturity Price : 15.00 Evaluated at bid price : 15.00 Bid-YTW : 3.78 % |
| TRP.PR.F | FloatingReset | 2.05 % | YTW SCENARIO Maturity Type : Limit Maturity Maturity Date : 2045-09-04 Maturity Price : 14.45 Evaluated at bid price : 14.45 Bid-YTW : 3.90 % |
| CM.PR.P | FixedReset | 2.39 % | YTW SCENARIO Maturity Type : Limit Maturity Maturity Date : 2045-09-04 Maturity Price : 21.40 Evaluated at bid price : 21.40 Bid-YTW : 3.72 % |
| TRP.PR.A | FixedReset | 2.49 % | YTW SCENARIO Maturity Type : Limit Maturity Maturity Date : 2045-09-04 Maturity Price : 16.86 Evaluated at bid price : 16.86 Bid-YTW : 4.14 % |
| HSE.PR.A | FixedReset | 2.89 % | YTW SCENARIO Maturity Type : Limit Maturity Maturity Date : 2045-09-04 Maturity Price : 14.25 Evaluated at bid price : 14.25 Bid-YTW : 4.44 % |
| Volume Highlights | |||
| Issue | Index | Shares Traded |
Notes |
| RY.PR.B | Deemed-Retractible | 55,869 | RBC crossed blocks of 25,000 and 24,800, both at 25.04. YTW SCENARIO Maturity Type : Call Maturity Date : 2015-10-04 Maturity Price : 25.00 Evaluated at bid price : 25.06 Bid-YTW : 3.52 % |
| PWF.PR.P | FixedReset | 55,398 | RBC crossed blocks of 32,500 and 13,000, both at 16.00. YTW SCENARIO Maturity Type : Limit Maturity Maturity Date : 2045-09-04 Maturity Price : 16.00 Evaluated at bid price : 16.00 Bid-YTW : 3.73 % |
| BAM.PR.R | FixedReset | 41,849 | RBC bought 16,800 from Scotia at 16.93. YTW SCENARIO Maturity Type : Limit Maturity Maturity Date : 2045-09-04 Maturity Price : 17.40 Evaluated at bid price : 17.40 Bid-YTW : 4.59 % |
| IAG.PR.G | FixedReset | 31,657 | YTW SCENARIO Maturity Type : Hard Maturity Maturity Date : 2025-01-31 Maturity Price : 25.00 Evaluated at bid price : 23.89 Bid-YTW : 4.28 % |
| MFC.PR.F | FixedReset | 30,165 | YTW SCENARIO Maturity Type : Hard Maturity Maturity Date : 2025-01-31 Maturity Price : 25.00 Evaluated at bid price : 15.75 Bid-YTW : 7.99 % |
| HSE.PR.A | FixedReset | 15,329 | YTW SCENARIO Maturity Type : Limit Maturity Maturity Date : 2045-09-04 Maturity Price : 14.25 Evaluated at bid price : 14.25 Bid-YTW : 4.44 % |
| There were 7 other index-included issues trading in excess of 10,000 shares. | |||
| Wide Spread Highlights | ||
| Issue | Index | Quote Data and Yield Notes |
| IFC.PR.A | FixedReset | Quote: 16.65 – 17.80 Spot Rate : 1.1500 Average : 0.6845 YTW SCENARIO |
| NA.PR.W | FixedReset | Quote: 21.06 – 21.84 Spot Rate : 0.7800 Average : 0.5364 YTW SCENARIO |
| RY.PR.J | FixedReset | Quote: 23.40 – 24.00 Spot Rate : 0.6000 Average : 0.3739 YTW SCENARIO |
| HSE.PR.E | FixedReset | Quote: 22.50 – 23.20 Spot Rate : 0.7000 Average : 0.4961 YTW SCENARIO |
| CU.PR.F | Perpetual-Discount | Quote: 20.71 – 21.20 Spot Rate : 0.4900 Average : 0.3122 YTW SCENARIO |
| ELF.PR.G | Perpetual-Discount | Quote: 21.40 – 21.93 Spot Rate : 0.5300 Average : 0.3574 YTW SCENARIO |