The Cleveland Fed has released the December issue of Economic Trends, with articles:
- October Price Statistics
- The Yield Curve, November 2008
- Japan’s Quantitative Easing Policy
- Industrial Production, Commodity Prices, and the Baltic Dry Index
- GDP: Third Quarter Preliminary Estimate
- The Employment Situation, October 2008
- Metro-Area Differences in Home Price Indexes
- Fourth District Employment Conditions, October 2008
- Fourth District Community Banks
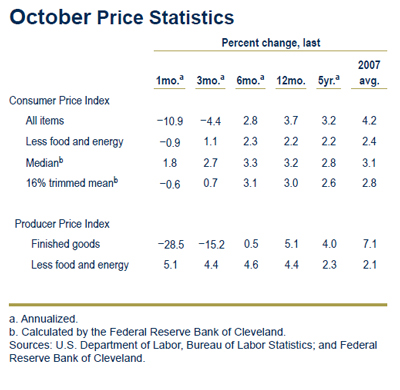
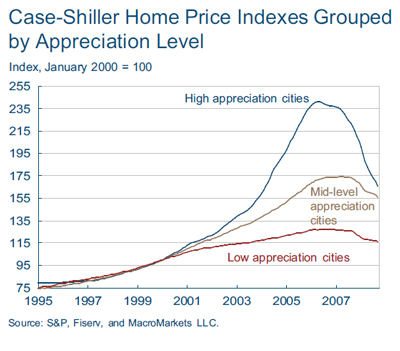
One table and one chart are of particular interest:

Deflation is always a possibility, but for now it looks like a simple unwind of the commodity boom.

Houses, ditto.
Cities like Miami, Los Angeles, San Diego, and Washington, D.C. all saw tremendous growth in home prices during the boom and have all subsequently seen massive declines in values. On the other hand, cities like Denver and Charlotte saw little to no unusual home price appreciation during the boom and have seen home prices decline only modestly during the bust.
I looked up the US CPI since 1995 — up 43% or so, which roughly tracks the low appreciation cities. I am not sure this means the high or mid-appreciation cities “should” eventually come down to the same level because there is a trend for the average house size to increase gradually over time (more square feet per person) — and hence grow faster than inflation. The Case-Shiller indices are supposed to try to factor this out, by using sale prices for the same home and eliminating “outliers”, but I am not sure how well this works.
The plot shows mid-appreciation city house prices have increased an average of 2.2% annually above the low appreciation prices — maybe too much to be attributable to the increasing house size.
Perhaps the sky has already fallen, and like the price of oil, house prices could all be back to normal in 6-12 months.