The U.S. labor market took one step forward and one back in June as job creation advanced while wages stagnated and the size of the labor force receded.
The addition of 223,000 jobs followed a 254,000 increase in the prior month that was less than previously estimated, a Labor Department report showed Thursday in Washington. The jobless rate fell to a seven-year low of 5.3 percent as people left the workforce.
…
Earnings at private employers held at $24.95 an hour in June on average and rose 2 percent over the past 12 months, matching the mean since the current expansion began six years ago. Wages had increased 2.3 percent in the year ended in May.
…
Stocks fell as investors waited for Greece’s weekend referendum on austerity measures. The Standard & Poor’s 500 Index declined 0.2 percent to 2,072.51 at 12:27 p.m. in New York. The weak wage reading lifted Treasuries, dropping the yield on the benchmark 10-year note to 2.37 percent from 2.42 percent late on Wednesday.
Naturally, this juxtaposition of higher employment with disappointing wages has increased speculation regarding what the Fed thinks:
By one measure, the U.S. labor market has already met the Federal Reserve’s expectations for 2015: The jobless rate fell to 5.3 percent in June, matching the policy makers’ projection for the end of the year, a Labor Department report Thursday showed.
The Federal Open Market Committee said in June that unemployment would ease to 5.2 to 5.3 percent in 2015, elevated just slightly from their expectation of a 5-to-5.2 percent longer-run natural rate (the joblessness that exists because of factors like labor market churn rather than due to cyclical weakness in the economy). The fact that the labor market has reached the committee’s 2015 estimate already — and has done so without spurring stronger wage gains — may prompt officials to lower both the 2015 and the long-run estimate at their September meeting.
SEC Commissioner Daniel M. Gallagher is not happy with the proposed Compensation Clawback Listing Standards:
Over the past four years, I have made it obvious to most that I am no fan of the Dodd-Frank Act, and certainly not the Act’s executive compensation rulemaking mandates. As I have noted many times in the past, there are real opportunity costs to this agency when our resources are devoted to these politically-motivated mandates.[1] Staff hours spent on clawbacks, pay-for-performance, pay ratio, and hedging rules — not to mention other nonsensical Dodd-Frank mandates like conflict minerals and extractive resources —is time not being spent on meaningful, important projects like the disclosure review project.[2] We desperately need to revamp our disclosure rules to cut through the clutter and ensure that we are only requiring disclosure of information that is important to a reasonable investor’s voting or investment decision. And there are other projects in need of CorpFin’s attention — most notably the much-needed revamp of our shareholder proposal rule. But instead of addressing these actually important issues, for years priority has been placed on plowing through Dodd-Frank’s many intrusions into state corporate governance rules.
…
The third devil is that the scope of the required compensation to be clawed back includes compensation based on financial reporting metrics as well as compensation based on share price metrics like Total Shareholder Return, or TSR. Calculating the appropriate amount of clawback for TSR-based compensation is much more difficult than calculating a clawback for a financial reporting measure, requiring an analysis such as an event study to determine what the share price would have been but for the misstatement at the time the compensation was earned. These analyses require substantial use of assumptions and judgment, often producing a range of numbers, rather than a firm number. The release candidly admits this difficulty, and proposes simply that issuers “be permitted to use reasonable estimates.”[20] This is cold comfort for the post-facto second-guessing that is likely to occur.[21] And yet, excluding TSR-based metrics from the scope of the rule would not have been the right approach either, as it would have shifted compensation packages towards these pay metrics, further entrenching the short-termism that is abetted by the Commission’s executive compensation rules.[22] I don’t know what the right answer is here, but I do know that today’s proposal isn’t it.
I had to laugh at a trend in the advising industry highlighted by Kenmar Associates in their (subscription-based) newsletter “INVESTOR PROTECTION IN CANADA- Q2 2015”:
Are you being “Reverse Churned? We are seeing a large number of accounts being converted to fee-based effectively turning commissions into fees. This may not be in your Best interests. “Reverse churning,” a claim alleging that a dealer representative has failed in his/her duties to act fairly, honestly and good faith to a client by moving an under-traded account from a commission to a fee-based compensation structure solely for the purpose of generating revenue from that account or by failing to make trades in an account that would have otherwise been made had the account been commission, instead of fee-based could be taking place. The historic effect of the prevalence of churning claims, and the attendant increase in the necessity of documenting client approval of such transactions, as well as CRM2 reporting has been the creation of an incentive for brokers to move their clients to fee-based accounts. In other words, because commission-based accounts require more action to document and justify commissions/ paid, there is an incentive for brokers to move their clients to accounts which require less day-to-day oversight. This incentive also exists with respect to accounts in which there is relatively little trading say as in, RRIF’s. IIROC rules require that a dealer representative (aka “advisor”) have a reasonable basis to believe that a recommended transaction or investment strategy involving a security or securities is suitable for the customer based on information obtained through reasonable diligence of the member or associated person to ascertain the customer’s investment profile. Is the rule being enforced? Don’t count on it. We recommend asking your advisor some probing questions if you have been converted.
I’m not sure that the choice of fee model counts as a “recommended transaction or investment strategy”, but I suppose that will be the subject of some complaints of some sort over the next little while. Many clients will, of course, be outraged that they are being charged $2,000 by an advisor who only executed two trades in a year; that will be a big issue should a fiduciary requirement eventually be imposed.
Sweden is going negative:
Sweden’s central bank lowered its main interest rate deeper into negative levels and expanded its bond purchases to the end of the year as the turmoil in Greece raises the specter of further krona gains.
The repo rate was cut to minus 0.35 percent from minus 0.25 percent, the Stockholm-based bank said in a statement. A reduction was predicted by 4 of 18 analysts in a Bloomberg survey, with remainder forecasting no change. The bank expanded its bond purchasing program by 45 billion kronor ($5.3 billion) to the end of year, adding to the 80 billion kronor to 90 billion kronor already announced.
…
The bank kept its repo rate unchanged in April after two cuts earlier in the year. Policy makers then added 40 billion kronor to 50 billion kronor to its bond buying from an initial 40 billion kronor announced since February.The moves earlier this year had limited success in keeping the krona from strengthening against the euro, as the ECB’s own bond purchases and the turmoil in Greece weigh on the common currency. Before today, the krona was up more than 2 percent against the euro this year.
Here’s one reason why the US is pushing for free trade in dairy:
There’s so much milk flowing out of U.S. cows these days that some is ending up in dirt pits because dairies can’t find buyers.
Domestic output is set to be the highest ever for a fifth straight year. Farmers are still making money as prices tumble because of cheaper and more abundant feed for their herds. Supplies of raw milk are topping capacity at processing plants in parts of the U.S. and compounding a global surplus even with demand improving.
…
Global dairy prices have dropped 39 percent from an all-time high in February 2014 and are the lowest in five years, United Nations data show. In Chicago, benchmark Class III milk futures, used in cheese making, are down 36 percent to $16.23 per 100 pounds from a record $25.30 in September. Prices may fall to $14.41 by the end of the year before recovering in 2016, said Tom Bailey, a New York-based analyst at Rabobank International.
…
At the same time, the dollar’s rally against most of the world’s currencies helped to spur a 10 percent drop in U.S. milk exports in the first four months of 2015, while imports rose 12 percent, compounding the domestic surplus, government data show.The bear market has been no barrier to more supply. At Mitch Breunig’s farm in Sauk City, Wisconsin, he’s still profitable even as the value of his milk fell 26 percent. Costs have dropped for things like fuel, and wet spring weather left an abundant alfalfa harvest, providing higher-quality hay for his 420 cows to eat. The animals are producing 3 percent more milk than last year.
Nice to see a tiny hint of rationality in Canadian securities regulation:
In Canada’s balkanized financial markets enforcement regime, when one provincial watchdog bans or suspends a fraudster or someone else who has violated securities rules, the others usually need to hold their own “rubber stamp” hearings to make the order apply in other provinces.
But the Alberta Securities Commission announced Thursday that as of July 1, most orders and settlement agreements made by other securities commissions across Canada will “automatically take effect” in Alberta, without any hearing or any notice to the person or company affected. Decisions made by regulators outside Canada, such as the U.S. Securities Exchange Commission, will not be automatically reciprocated, but could still be rubber-stamped and enforced by the ASC as they are now.
…
The changes comes after a rare and unusual decision last year, in which an ASC panel initially chose not to endorse an Ontario Securities Commission settlement with Bruce Moore, a former investment banker who agreed he had improperly traded shares through offshore accounts using confidential information he gleaned from his work at Canadian Imperial Bank of Commerce. The OSC had imposed a 15-year ban on working as a registrant in the securities industry and a 10-year ban on trading shares of public companies.The ASC panel said it denied the request to enforce the bans in Alberta, because it had not received enough information from ASC staff – not even a copy of the original OSC decision in the case. However, the ASC later reciprocated the order, presumably after commissioners were provided with enough background.
Come on, guys. We know that provincial securities regulation is just a cash grab. You don’t need to make such a pretense of independence as all that.
It’s nice to see more Chinese money recycled into the global economy:
The trend has already hit Sydney, Vancouver and the U.S. Now it’s happening in Japan: busloads of real estate buyers from China coming in, buying up homes and pushing prices higher.
Realty agencies in Beijing are organizing twice-monthly tours to Tokyo and Osaka, where 40 Chinese at a time come for three-day property-shopping trips, seeking safe places to invest their cash abroad. They’re being prompted by the yen’s decline to 22-year lows and excitement over the 2020 Tokyo Olympics driving up prices, as they did in Beijing in 2008. Property tours will soon start from Shanghai too.
Partly as a result of nascent Chinese buying, Tokyo apartment prices have reached the highest levels since the early 1990s, up 11 percent over two years, according to the Real Estate Economic Institute Co.
It was a mixed day for the Canadian preferred share market, with PerpetualDiscounts up 31bp, FixedResets off 4bp and DeemedRetractibles gaining 2bp. The Performance Highlights table is its usual lengthy self. Volume was exceedingly very awfully extremely low; I suppose today’s juxtaposition between a Canadian closing and an American one persuaded many fine representatives of the highest paid profession on earth to stay home.
For as long as the FixedReset market is so violently unsettled, I’ll keep publishing updates of the more interesting and meaningful series of FixedResets’ Implied Volatilities. This doesn’t include Enbridge because although Enbridge has a large number of issues outstanding, all of which are quite liquid, the range of Issue Reset Spreads is too small for decent conclusions. The low is 212bp (ENB.PR.H; second-lowest is ENB.PR.D at 237bp) and the high is a mere 268 for ENB.PF.G.
Remember that all rich /cheap assessments are:
» based on Implied Volatility Theory only
» are relative only to other FixedResets from the same issuer
» assume constant GOC-5 yield
» assume constant Implied Volatility
» assume constant spread
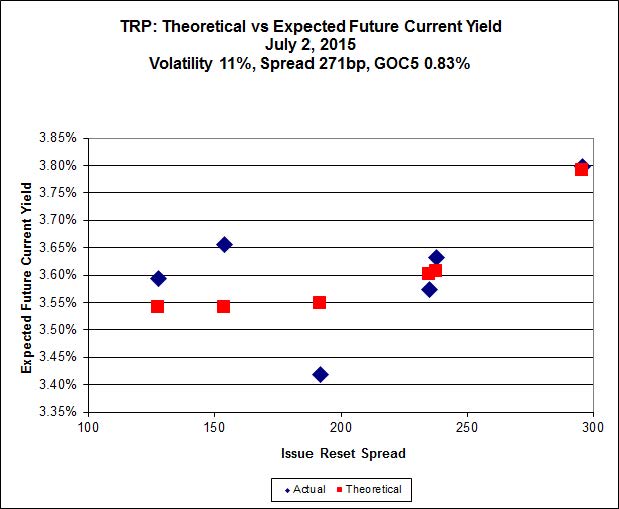
Here’s TRP:
Click for Big
TRP.PR.A, which resets 2019-12-31 at +192, is bid at 20.11 to be $0.74 rich, while TRP.PR.C, resetting 2016-1-30 at +154, is $0.53 cheap at its bid price of 16.21.
Click for Big
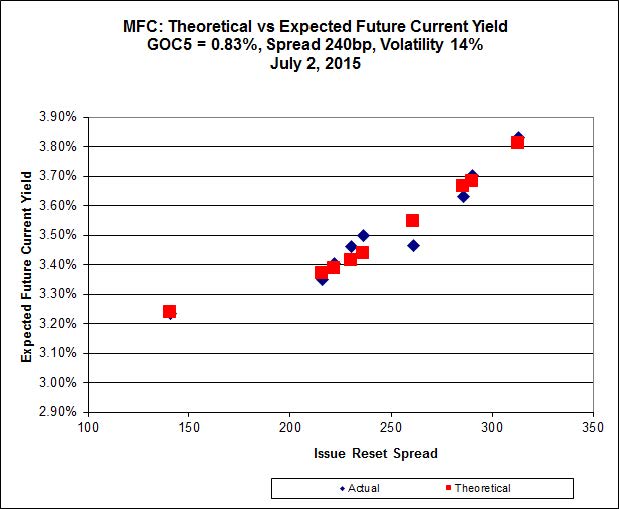
Another excellent fit, but the numbers are perplexing. Implied Volatility for MFC continues to be a conundrum. It is still too high if we consider that NVCC rules will never apply to these issues; it is still too low if we consider them to be NVCC non-compliant issues (and therefore with Deemed Maturities in the call schedule).
Most expensive is MFC.PR.J, resetting at +261bp on 2018-3-19, bid at 24.83 to be $0.588 rich, while MFC.PR.M, resetting at +236bp on 2019-12-19, is bid at 22.80 to be $0.41 cheap.
Click for Big
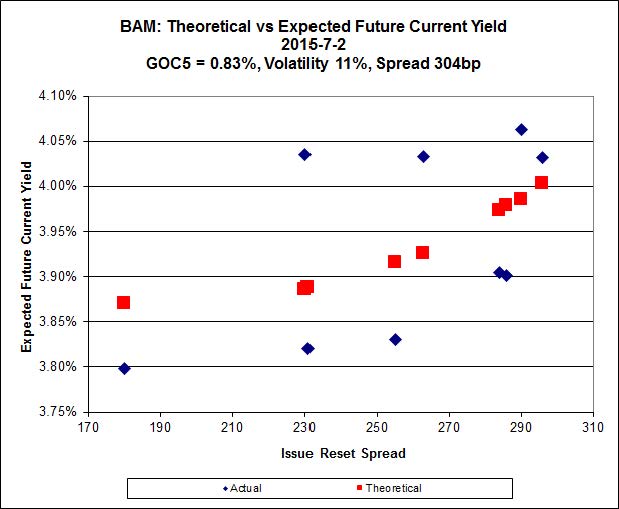
The cheapest issue relative to its peers is BAM.PR.R, resetting at +230bp on 2016-6-30, bid at 19.39 to be $0.75 cheap. BAM.PF.E, resetting at +255bp 2020-3-31 is bid at 23.75 and appears to be $0.48 rich.
Click for Big
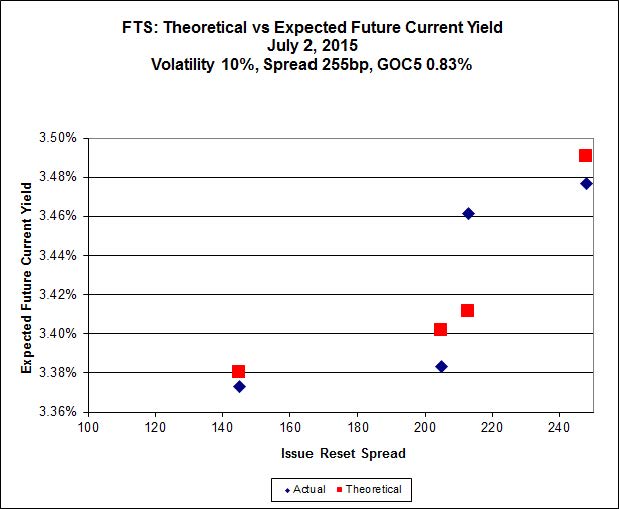
FTS.PR.G, with a spread of +213bp, and bid at 21.38, looks $0.31 cheap and resets 2018-9-1. FTS.PR.K, with a spread of +205bp and resetting 2019-3-1, is bid at 21.28 and is $0.12 rich.
Click for Big
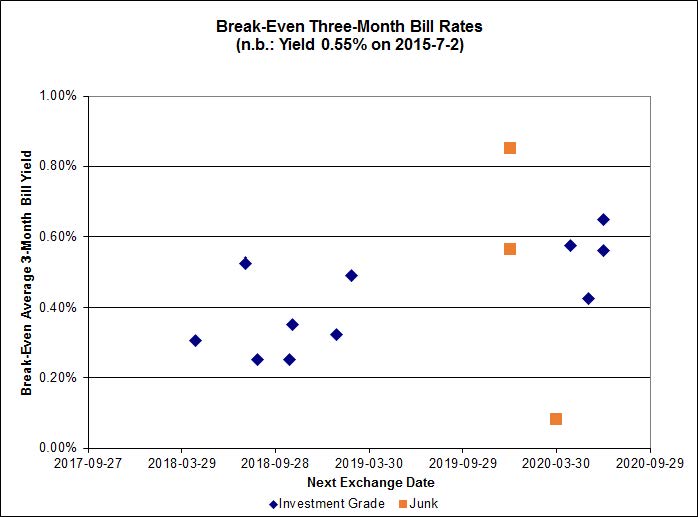
Investment-grade pairs predict an average three-month bill yield over the next five-odd years of about 0.37%, including the outlier TRP.PR.A / TRP.PR.F at -0.21. On the junk side there are three outliers: FFH.PR.E / FFH.PR.F at -0.79%; BRF.PR.A / BRF.PR.B at -0.43%; and DC.PR.B / DC.PR.D at -0.18%.

Click for Big
Shall we just say that this exhibits a high level of confidence in the continued rapacity of Canadian banks?
| HIMIPref™ Preferred Indices These values reflect the December 2008 revision of the HIMIPref™ Indices Values are provisional and are finalized monthly |
|||||||
| Index | Mean Current Yield (at bid) |
Median YTW |
Median Average Trading Value |
Median Mod Dur (YTW) |
Issues | Day’s Perf. | Index Value |
| Ratchet | 0.00 % | 0.00 % | 0 | 0.00 | 0 | -0.1382 % | 2,244.8 |
| FixedFloater | 0.00 % | 0.00 % | 0 | 0.00 | 0 | -0.1382 % | 3,925.0 |
| Floater | 3.45 % | 3.48 % | 60,124 | 18.61 | 3 | -0.1382 % | 2,386.4 |
| OpRet | 0.00 % | 0.00 % | 0 | 0.00 | 0 | -0.0134 % | 2,774.4 |
| SplitShare | 4.59 % | 4.82 % | 67,992 | 3.24 | 3 | -0.0134 % | 3,251.5 |
| Interest-Bearing | 0.00 % | 0.00 % | 0 | 0.00 | 0 | -0.0134 % | 2,536.9 |
| Perpetual-Premium | 5.47 % | 2.65 % | 66,837 | 0.16 | 13 | 0.1089 % | 2,515.7 |
| Perpetual-Discount | 5.35 % | 5.30 % | 97,153 | 14.94 | 21 | 0.3126 % | 2,673.5 |
| FixedReset | 4.51 % | 3.75 % | 224,674 | 16.16 | 88 | -0.0397 % | 2,328.2 |
| Deemed-Retractible | 5.01 % | 4.81 % | 109,386 | 3.17 | 34 | 0.0239 % | 2,620.7 |
| FloatingReset | 2.92 % | 3.26 % | 56,296 | 6.00 | 10 | -0.2482 % | 2,323.4 |
| Performance Highlights | |||
| Issue | Index | Change | Notes |
| SLF.PR.J | FloatingReset | -3.03 % | YTW SCENARIO Maturity Type : Hard Maturity Maturity Date : 2025-01-31 Maturity Price : 25.00 Evaluated at bid price : 16.00 Bid-YTW : 7.70 % |
| SLF.PR.H | FixedReset | -2.47 % | YTW SCENARIO Maturity Type : Hard Maturity Maturity Date : 2025-01-31 Maturity Price : 25.00 Evaluated at bid price : 20.50 Bid-YTW : 5.68 % |
| TRP.PR.E | FixedReset | -1.77 % | YTW SCENARIO Maturity Type : Limit Maturity Maturity Date : 2045-07-02 Maturity Price : 21.84 Evaluated at bid price : 22.25 Bid-YTW : 3.87 % |
| TD.PF.A | FixedReset | -1.74 % | YTW SCENARIO Maturity Type : Limit Maturity Maturity Date : 2045-07-02 Maturity Price : 22.07 Evaluated at bid price : 22.60 Bid-YTW : 3.67 % |
| IFC.PR.C | FixedReset | -1.38 % | YTW SCENARIO Maturity Type : Hard Maturity Maturity Date : 2025-01-31 Maturity Price : 25.00 Evaluated at bid price : 22.80 Bid-YTW : 4.84 % |
| NA.PR.M | Deemed-Retractible | -1.32 % | YTW SCENARIO Maturity Type : Call Maturity Date : 2016-05-15 Maturity Price : 25.25 Evaluated at bid price : 25.51 Bid-YTW : 5.64 % |
| NA.PR.S | FixedReset | -1.24 % | YTW SCENARIO Maturity Type : Limit Maturity Maturity Date : 2045-07-02 Maturity Price : 22.85 Evaluated at bid price : 23.95 Bid-YTW : 3.57 % |
| PWF.PR.R | Perpetual-Premium | -1.15 % | YTW SCENARIO Maturity Type : Call Maturity Date : 2020-04-30 Maturity Price : 25.25 Evaluated at bid price : 25.76 Bid-YTW : 5.22 % |
| NA.PR.Q | FixedReset | -1.11 % | YTW SCENARIO Maturity Type : Hard Maturity Maturity Date : 2022-01-31 Maturity Price : 25.00 Evaluated at bid price : 25.02 Bid-YTW : 3.60 % |
| HSE.PR.C | FixedReset | -1.06 % | YTW SCENARIO Maturity Type : Limit Maturity Maturity Date : 2045-07-02 Maturity Price : 22.47 Evaluated at bid price : 23.30 Bid-YTW : 4.42 % |
| NA.PR.W | FixedReset | -1.05 % | YTW SCENARIO Maturity Type : Limit Maturity Maturity Date : 2045-07-02 Maturity Price : 22.00 Evaluated at bid price : 22.51 Bid-YTW : 3.70 % |
| BAM.PF.G | FixedReset | -1.05 % | YTW SCENARIO Maturity Type : Limit Maturity Maturity Date : 2045-07-02 Maturity Price : 22.54 Evaluated at bid price : 23.50 Bid-YTW : 4.14 % |
| HSE.PR.A | FixedReset | 1.06 % | YTW SCENARIO Maturity Type : Limit Maturity Maturity Date : 2045-07-02 Maturity Price : 16.17 Evaluated at bid price : 16.17 Bid-YTW : 4.23 % |
| BAM.PF.C | Perpetual-Discount | 1.09 % | YTW SCENARIO Maturity Type : Limit Maturity Maturity Date : 2045-07-02 Maturity Price : 21.26 Evaluated at bid price : 21.26 Bid-YTW : 5.75 % |
| IFC.PR.A | FixedReset | 1.14 % | YTW SCENARIO Maturity Type : Hard Maturity Maturity Date : 2025-01-31 Maturity Price : 25.00 Evaluated at bid price : 19.50 Bid-YTW : 6.26 % |
| ENB.PR.N | FixedReset | 1.17 % | YTW SCENARIO Maturity Type : Limit Maturity Maturity Date : 2045-07-02 Maturity Price : 19.05 Evaluated at bid price : 19.05 Bid-YTW : 4.84 % |
| FTS.PR.J | Perpetual-Discount | 1.51 % | YTW SCENARIO Maturity Type : Limit Maturity Maturity Date : 2045-07-02 Maturity Price : 23.19 Evaluated at bid price : 23.55 Bid-YTW : 5.08 % |
| GWO.PR.N | FixedReset | 1.54 % | YTW SCENARIO Maturity Type : Hard Maturity Maturity Date : 2025-01-31 Maturity Price : 25.00 Evaluated at bid price : 17.11 Bid-YTW : 6.89 % |
| HSE.PR.E | FixedReset | 1.87 % | YTW SCENARIO Maturity Type : Limit Maturity Maturity Date : 2045-07-02 Maturity Price : 23.00 Evaluated at bid price : 24.50 Bid-YTW : 4.51 % |
| ELF.PR.G | Perpetual-Discount | 2.38 % | YTW SCENARIO Maturity Type : Limit Maturity Maturity Date : 2045-07-02 Maturity Price : 22.08 Evaluated at bid price : 22.36 Bid-YTW : 5.31 % |
| IAG.PR.A | Deemed-Retractible | 3.14 % | YTW SCENARIO Maturity Type : Hard Maturity Maturity Date : 2025-01-31 Maturity Price : 25.00 Evaluated at bid price : 23.00 Bid-YTW : 5.73 % |
| Volume Highlights | |||
| Issue | Index | Shares Traded |
Notes |
| BNS.PR.M | Deemed-Retractible | 130,160 | TD crossed 123,300 at 25.60. YTW SCENARIO Maturity Type : Call Maturity Date : 2015-08-26 Maturity Price : 25.25 Evaluated at bid price : 25.60 Bid-YTW : 0.30 % |
| BMO.PR.Q | FixedReset | 64,379 | Nesbitt crossed 52,200 at 23.40. YTW SCENARIO Maturity Type : Hard Maturity Maturity Date : 2022-01-31 Maturity Price : 25.00 Evaluated at bid price : 23.50 Bid-YTW : 3.49 % |
| FTS.PR.H | FixedReset | 33,605 | Desjardins crossed 30,500 at 16.95. YTW SCENARIO Maturity Type : Limit Maturity Maturity Date : 2045-07-02 Maturity Price : 16.90 Evaluated at bid price : 16.90 Bid-YTW : 3.57 % |
| ENB.PF.E | FixedReset | 24,190 | YTW SCENARIO Maturity Type : Limit Maturity Maturity Date : 2045-07-02 Maturity Price : 20.20 Evaluated at bid price : 20.20 Bid-YTW : 4.74 % |
| TRP.PR.B | FixedReset | 20,908 | YTW SCENARIO Maturity Type : Limit Maturity Maturity Date : 2045-07-02 Maturity Price : 14.68 Evaluated at bid price : 14.68 Bid-YTW : 3.73 % |
| ENB.PF.C | FixedReset | 16,543 | YTW SCENARIO Maturity Type : Limit Maturity Maturity Date : 2045-07-02 Maturity Price : 20.08 Evaluated at bid price : 20.08 Bid-YTW : 4.74 % |
| There were 9 other index-included issues trading in excess of 10,000 shares. | |||
| Wide Spread Highlights | ||
| Issue | Index | Quote Data and Yield Notes |
| SLF.PR.H | FixedReset | Quote: 20.50 – 21.23 Spot Rate : 0.7300 Average : 0.4779 YTW SCENARIO |
| PVS.PR.C | SplitShare | Quote: 24.92 – 25.50 Spot Rate : 0.5800 Average : 0.3662 YTW SCENARIO |
| MFC.PR.L | FixedReset | Quote: 22.31 – 23.02 Spot Rate : 0.7100 Average : 0.5012 YTW SCENARIO |
| PWF.PR.R | Perpetual-Premium | Quote: 25.76 – 26.25 Spot Rate : 0.4900 Average : 0.3256 YTW SCENARIO |
| PWF.PR.S | Perpetual-Discount | Quote: 24.02 – 24.50 Spot Rate : 0.4800 Average : 0.3185 YTW SCENARIO |
| TRP.PR.E | FixedReset | Quote: 22.25 – 22.74 Spot Rate : 0.4900 Average : 0.3432 YTW SCENARIO |