The Boston Fed published a paper by Daniel Cooper and J. Christina Wang titled Student Loan Debt and Economic Outcomes:
This policy brief advances the growing literature on how student loan debt affects individuals’ other economic decisions. Specifically, it examines the impact of student loan liabilities on individuals’ homeownership status and wealth accumulation. The analysis employs a rich set of financial and demographic control variables that are not available in many of the existing studies that use credit bureau data. Overall, student debt lowers the likelihood of homeownership for a group of students who attended college during the 1990s. There is also a fairly strong negative correlation between student loan debt and wealth (excluding student loan debt) for a group of households with at least some college experience.
…
Indeed, student loan debt has now surpassed credit card debt to become the second largest amount of household debt outstanding after mortgage debt (see Figure 1). Unlike credit card debt and other household liabilities, however, student debt cannot be discharged in bankruptcy.
…
Consistent with the previous literature on socio-economic inequality in the United States, African Americans and Hispanics have substantially less wealth than Caucasians. This negative effect is largely reversed, however, among those minority homeowners with student loan debt outstanding. This result likely reflects the fact that, among minorities, those who pursued higher education—even if they had to borrow to do so—likely have greater earning power and can accumulate more assets while they are young than minorities who did not attend college.
They also published an interesting paper by Claire Greene and Scott Schuh titled U.S. Consumers’ Holdings and Use of $100 Bills:
Conventional wisdom asserts that $100 bills are often associated with crime and foreign cash holdings, leading some commentators to call for their elimination; in light of this view, it is useful to examine the legal, domestic use of cash. This report uses new data from the 2012 Diary of Consumer Payment Choice (DCPC) to evaluate consumer use of $100 bills as a means of payment. On a typical day in the United States, 5.2 percent of consumers have a $100 bill in their pocket, purse, or wallet. But only 22 percent of U.S. consumers have at least $100 in their wallet, pocket, or purse. Of these cash-intensive consumers, the main association with holding a $100 bill is the amount of cash carried. A consumer who carries $400 to $699 has a 64 percent probability of carrying at least one $100 bill.
…
Recently, Harvard economist Kenneth Rogoff called for the total elimination of $100 bills.4 According to Rogoff (2014), the evidence suggests that, in most countries, more than 50 percent of currency is used to facilitate anonymous transactions for tax evasion or other illegal activities.
…
The DCPC shows that consumers still use cash heavily as a means of payment. U.S. consumers age 18 and older carry an average of $56 on their person (pocket, purse, or wallet), and the median consumer carries $22. Cash is still the most common method of payment for consumers (40.3 percent of the number of payments per month), even though the dollar value of these payments is relatively low (14.2 percent of value per month) because the average cash payment is small ($20.73). Only 6.6 percent of reported cash payments by number of transactions (12.3 percent by value) were in categories that were not well defined or documented and, therefore, might be more likely to be associated with criminal or underground economic activity.
…
Over the last three decades, the value of 100s shipped by the Fed to depository institutions has increased dramatically relative to other denominations. This could be due in part to inflation, to the elimination of the larger denominations, and/or to an increase in demand for U.S. currency outside the United States. Hundreds represented just about 10 percent of the value of cash shipped in January 1974, compared with 45 percent in 2010.8 In 2013, the value of $100 bills in circulation was $925 billion—enough for every person in the United States (including children) to hold $3,000 in $100 bills.
…
On any given day in October 2012, 5.2 percent of U.S. consumers carried at least one $100 bill in their pocket, purse, or wallet (on person). This statistic is somewhat incomplete because only consumers carrying at least $100 of cash (total of all denominations) could be carrying a $100 bill. As shown in Figure 6, cash holdings on person by U.S. consumers are skewed toward values much less than $100: 78 percent of consumers carried $99 or less, including 28 percent who carried $19 or less. A small proportion of consumers carry the largest amounts of cash in value. Only 22 percent of U.S. consumers carried $100 or more; just 8 percent carried $200 or more. Therefore, it is necessary to ask who carries $100 before asking who carries a $100 bill.
…
Among consumers who carry $100 or more, about one in six (17.6 percent) carries at least one $100 bill. The probability of carrying a $100 bill rises as a consumer’s total cash on person increases, as shown in Figure 8. For consumers carrying between $400 and $699, the probability of carrying $100 bill is more than 60 percent. The probability jumps to 94 percent when cash holdings exceed $700. In addition, as cash on person increases, consumers carry more $100 bills (Figure 9).
…
If they are carrying at least $100 and all other factors are equal, women are more likely than men to carry a $100 bill or bills and people younger than 25 are more likely than people 25 years old or older to carry a $100 bill or bills. No other demographic characteristics are helpful in explaining the probability of holding a $100 bill by a consumer who carries at least $100.
Patricia L. Olasker and Mindy Gilbert of Davies Ward Phillips & Vineberg LLP have submitted a comment letter on the National Securities Regulator legislation:
The PCMA introduces numerous substantive changes from the current securities law of Ontario. These include:
- •change to the long-standing and widely used definition of “misrepresentation”;
- •the broadening of the insider trading prohibition to include conduct that stops short of a sale of a security and to include transactions in securities of non-reporting companies;
- •change to the exception to the tipping prohibition;
- •introduction of a novel fiduciary relationship between underwriters and their clients;
- •unprecedented regulation of shareholders holding 20% or more of a public company as if they were “market participants”; and
- •introduction of a novel “obstruction” prohibition prohibiting the withholding of information from the regulatory authority and potentially intruding on the solicitor/client relationship.
…
We are also concerned about the extent to which the PCMA takes a platform approach to legislation. Not only are entire areas of the law proposed to be addressed in regulations, but the legislation omits a number of well-established elements of securities law. We believe that fundamental established elements of the existing law should be enshrined in the legislation itself. The commentary accompanying the release of the draft legislation noted that the platform approach was intended to promote “regulatory flexibility allowing the Authority to respond to market developments in a timely manner”. Our concern with this is threefold:
- 1.It allows for legislation by regulatory fiat with limited political accountability.
- 2.It undermines one of the key features of a sound capital market − namely, stability and predictability in the legal and regulatory regime, which are essential to transaction planning. With vast sections of the law, including key cornerstone elements, being left to regulation, there is significant risk of instability in the law, with the potential for substantive changes to be effected through a process subject to no more discipline than a 90-day request for comments.
- 3.We are sceptical of the premise that more regulatory flexibility is required than exists under the current regime. In fact, with the introduction of the federal Capital Markets Stability Act, which will allow the cooperative regulator to act to address systemic risks to the capital markets, one could argue that less rather than more regulatory flexibility is necessary at the PCMA level.
This echoes many of the concerns raised by Jeffrey MacIntosh.
And the BOC has published a paper by Gregory Bauer titled International House Price Cycles, Monetary Policy and Risk Premiums:
Using a panel logit framework, the paper provides an estimate of the likelihood of a house price correction in 18 OECD countries. The analysis shows that a simple measure of the degree of house price overvaluation contains a lot of information about subsequent price reversals. Corrections are typically triggered by a sharp tightening in the monetary policy interest rate relative to a baseline level in each country. Two different assessments of the current and future baseline estimates of monetary policy interest rates are provided: a simple Taylor rule and one extracted from a term structure model. A case study based on the Canadian housing market is presented.
…
In this paper, we construct a model to forecast house price corrections in the national housing markets of 18 OECD countries. We focus on large corrections: the (real) national house price index must decline by at least 10 per cent and the correction must last at least four quarters. There are 43 such corrections in our post-1975 sample, which highlights the advantage of an international data set. More importantly for policy-makers, the corrections appear to be triggered by increases in central bank policy rates.
…
In theory, it should be possible to estimate the degree of house price overvaluation and the consequent likelihood of a correction using the data from a single country only. However, it will be di¢ cult to estimate the degree of overvaluation in a given country if the values of homes in the markets are already away from their fundamental values. Regressing one upward-trending series (such as real house prices) on another trending series (such as real per capita income) will always produce a coefficient that can justify most of the current level of valuation. The addition of many other countries, with housing market cycles that may be different from that of Canada, will impose more discipline on the estimation of such a coefficient.
…
Figure 2 displays the real house price index in each country along with the periods that have been identified as corrections. The country with the highest number of corrections is Spain, at six corrections between 1975Q1 and 2014Q2. Denmark has experienced
five corrections over its history. Japan records the longest duration of a housing market correction at 61 quarters, or 15 years. Other notable countries with long correction durations are Spain (26 quarters), Germany (25 quarters), Italy (25 quarters) and Sweden (25 quarters).
Canada’s historical record shows two such corrections. Prices declined by a total of 30 per cent over a period of six quarters starting in 1981Q3, and by 17 per cent over a one-year period beginning in 1990Q2. For comparison, the United States also saw two housing market corrections. The first occurred in 2006Q4 and lasted seven quarters, and the second began in 2009Q1 and ended
five quarters later. During these two periods, the country experienced house price declines of 10 per cent and 14 per cent, respectively.
…
The Canadian and other country average amounts of overvaluation are shown in Figure 3. The average amount of overvaluation across the other 17 OECD countries (black line) shows considerable variation over time, reaching approximately 15 per cent at the height of the latest boom period. Canadian house prices (red line) were considered to be fairly valued in 2004, but are now estimated to be overvalued by slightly over 20 per cent (as of 2014Q2). The interquartile range of the 18 country estimates (the 25th and 75th percentile of overvaluation at each point in time) is shown in dotted lines.
…
There are a number of conclusions of interest to policy-makers. First, the relatively simple way of assessing house price overvaluation has good forecasting power for subsequent corrections. The variable is signifi
cant in all specifi
cations and at all horizons. Second, while the two methods of estimating the monetary policy stance of the central banks produce similar results, the method of extracting a global risk premium from the long-term interest rate has some advantages. The expectations component is forward looking and rises well in advance of the corrections. This may be quite useful to policy-makers today who face the zero lower bound on current policy rates while the long-term rates incorporate expectations of future rate increases.
Third, there is a distinct forecast-horizon aspect to the results. Attempting to forecast a house price decline that is going to start in the next quarter is extremely difficult. The signals from this modelling approach are very weak and would be engulfed by the noise.
The BoC warned of rising illiquidity in the Canadian corporate bond market:
The Bank of Canada warned that investors in the nation’s corporate bond market may be underestimating the difficulty of selling the securities in a market downturn, putting them at risk of greater losses.
Rising holdings of corporate bonds in mutual and exchange-traded funds could exacerbate price swings if the funds are forced to sell in a rout, the central bank said in its semi-annual Financial System Review. Some market participants also “believe” dealers are reducing market-making activity, or acting as the middleman between trades, which may make it harder to unwind large positions, the bank said.
“A potential deterioration of liquidity in Canadian corporate bond markets may not be fully priced in,” according to the report. “Market trends suggest that more sizable price swings might be observed in the future than previously, should investors seek to simultaneously unwind large positions.”
The greater role of ETFs and mutual funds in the market could cause “price dislocations” if investors cash out and funds are forced to sell underlying corporate bond holdings at lower prices, the report said.
I’ll try to review the Review in a while.
Update: The Financial System Review, December 2014 isn’t really all that interesting, although I may review their article on ETFs tomorrow. The Bloomberg story is a fair synopsis of what is said about corporate bonds on pp. 21-22 of the publication, except that the bank is concerned that rising holdings by foreigners could increase exposure to external shocks.
And, oh yeah, there was a little bit of action in the equities market:
Canadian stocks sank the most in 17 months, sending the benchmark gauge to the lowest level since February, as crude resumed a selloff after OPEC said demand will drop next year.
Penn West Petroleum Ltd. and Crescent Point Energy Corp. plunged at least 9.8 percent as energy producers sank to a 2012 low. Laurentian Bank of Canada (LB) dropped 5.3 percent to pace declines among financial services stocks. All 10 main groups in the benchmark index lost at least 0.4 percent.
The Standard & Poor’s/TSX Composite Index (SPTSX) fell 342.78 points, or 2.4 percent, to 13,852.95 at 4 p.m. in Toronto. The equity gauge has dropped 4.3 percent this week, paring its advance this year to 1.7 percent. Trading volume was 38 percent above the 30-day average.
Oil, bank and raw-materials are the biggest laggards in Canada for the first time since at least 1988, fueling concern the nation’s economy is fading just as the U.S. is taking off. The three industries, which collectively account for two-thirds of the S&P/TSX, are the worst performers among 10 groups this year, led by a 18 percent slump in energy, according to data compiled by Bloomberg.
Which is kind of tough news for preferred share investors who have tried to escape the downturn.
 Click for Big
Technically, it was a mixed day for the Canadian preferred share market, with PerpetualDiscounts losing 92bp, FixedResets down 25bp and DeemedRetractibles squeaking out a gain of 3bp; PUT THAT GUN DOWN, IT WASN’T THAT BAD! The loss for PerpetualDiscounts is grossly overstated due to some more Toronto Stock Exchanges idiocy (either with respect to its market makers, or its reporting, I’m not sure which). About 60bp of the reported tumble in PerpetualDiscounts is due to an overstatement of the bad day experienced by FTS.PR.F; see the Performance Highlights table for an explanation. The Performance Highlights table is, again, dominated by lower-spread FixedResets and has a good contingent of credit-nervous ENB issues. Volume was average.
PerpetualDiscounts now yield 5.14% (the mispricing of FTS.PR.H is not a disaster, since this is a median figure), equivalent to 6.68% interest at the standard conversion factor of 1.3x. Long corporates now yield about 4.05%, so the pre-tax interest-equivalent spread (in this context, the “Seniority Spread”) is now about 255bp, a significant increase from the 235bp reported November 26.
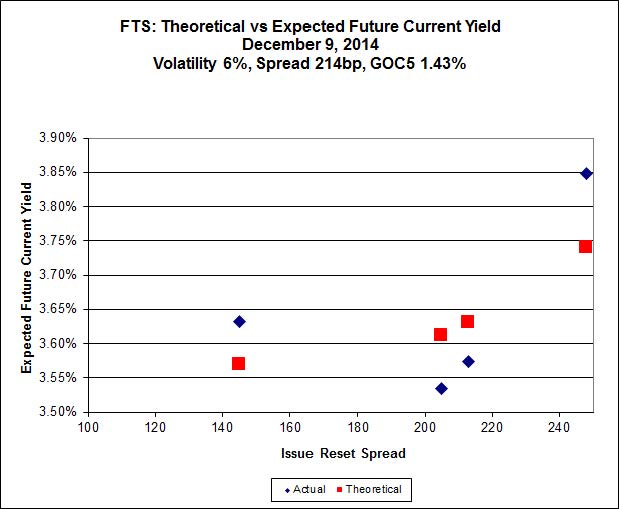
For as long as the FixedReset market is so violently unsettled, I’ll keep publishing updates of the more interesting and meaningful series of FixedResets’ Implied Volatilities. This doesn’t include Enbridge because although Enbridge has a large number of issues outstanding, all of which are quite liquid, the range of Issue Reset Spreads is too small for decent conclusions. The low is 212bp (ENB.PR.H; second-lowest is ENB.PR.D at 237bp) and the high is a mere 268 for ENB.PF.G.
Remember that all rich /cheap assessments are:
- based on Implied Volatility Theory only
- are relative only to other FixedResets from the same issuer
- assume constant GOC-5 yield
- assume constant Implied Volatility
- assume constant spread
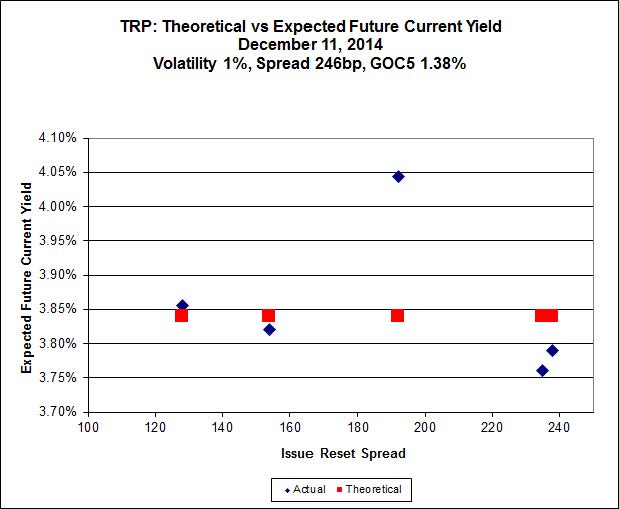
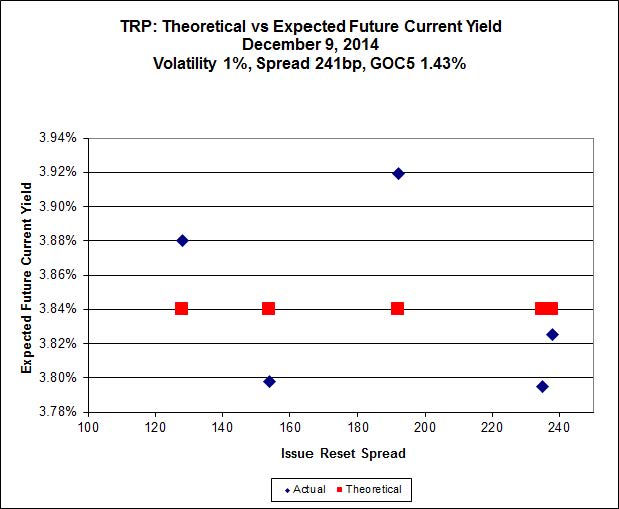
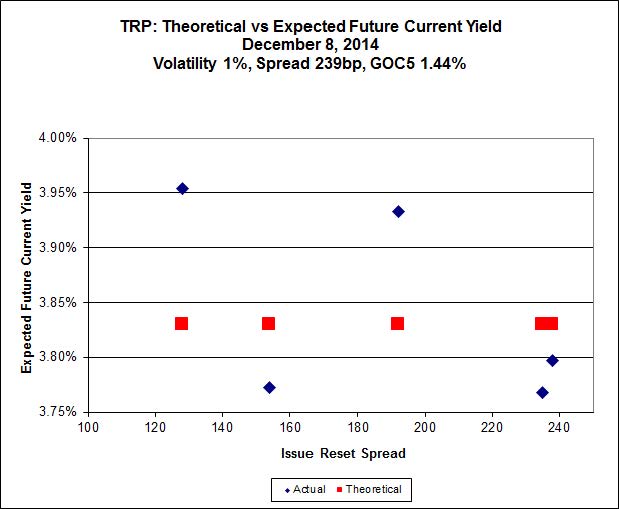
Here’s TRP:
 Click for Big
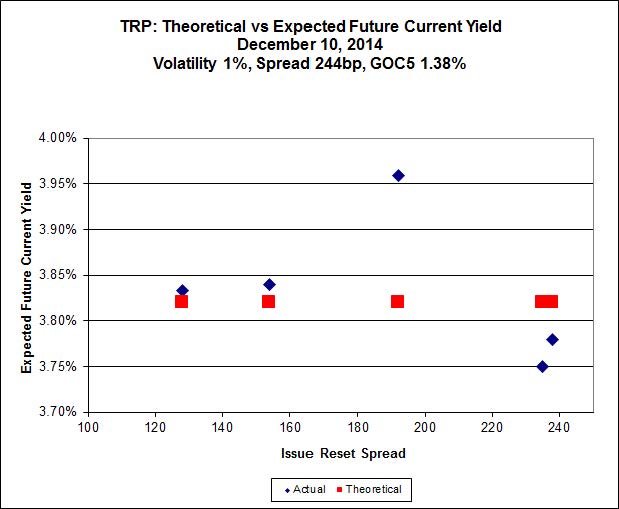
So according to this, TRP.PR.A, bid at 20.84, is $0.76 cheap, but it has already reset. TRP.PR.B, bid at 17.35, resetting 2015-6-30 and TRP.PR.C, bid at 19.01, resetting 2016-1-30 are both fairly priced. The TRP issues seem to be steadily rationalizing, but there continues to be pressure on TRP.PR.A.
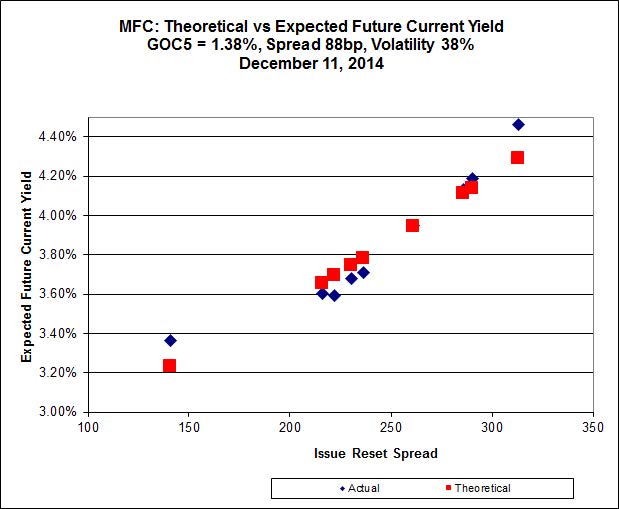
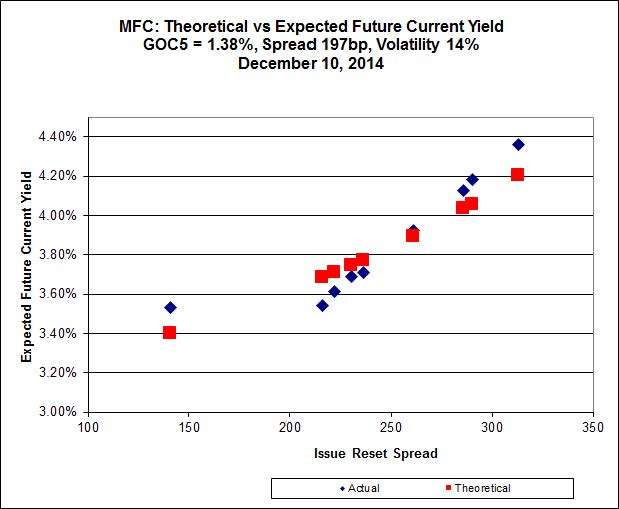
The MFC series continues to be weird.
 Click for Big
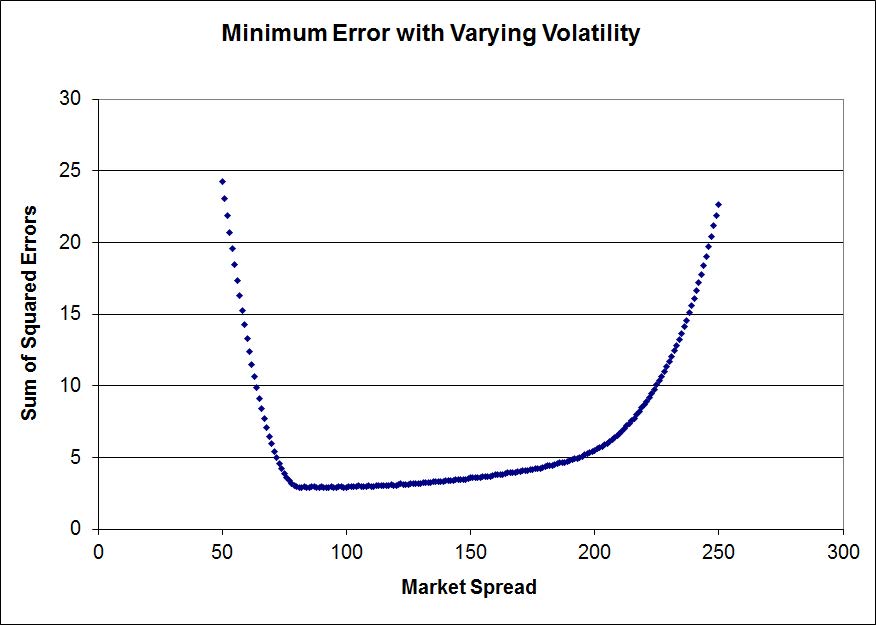
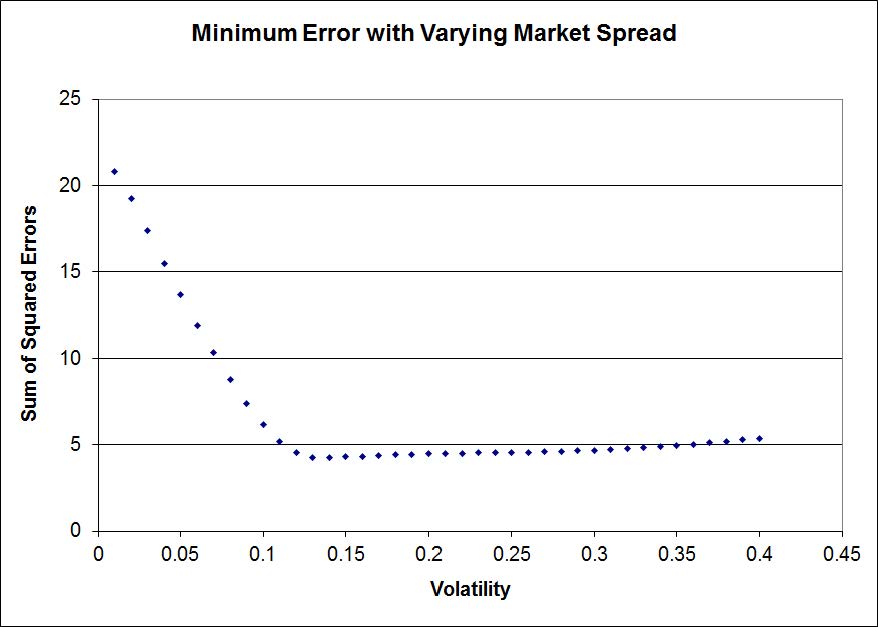
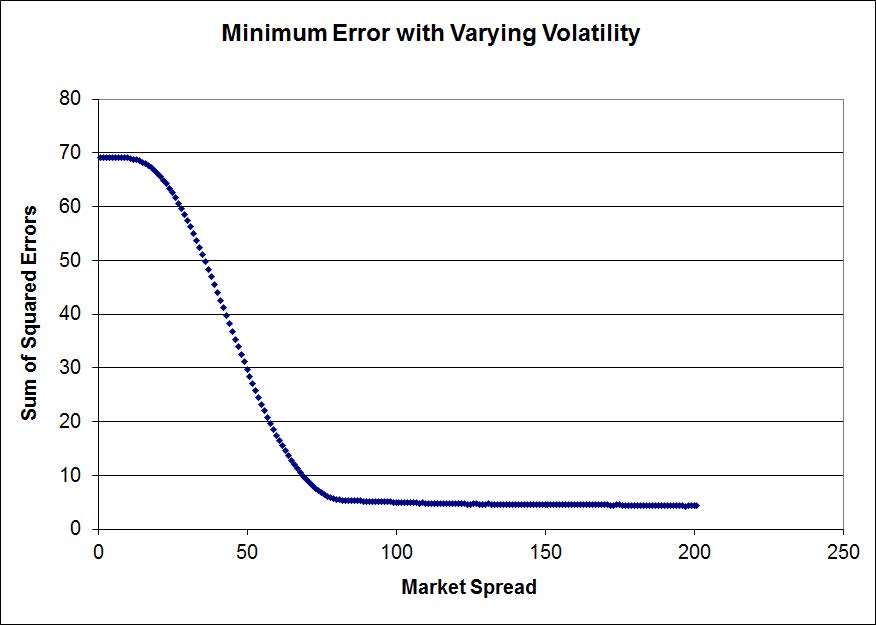
Clearly MFC.PR.F, resetting at +141 on 2016-06-19, is out of step with the others and is screwing up the calculation. To the extent that one can trust both Implied Volatility Theory AND the market’s reasonably more-or-less consistent application of it, MFC.PR.F should be bid significantly higher than its current 19.75 and the calculated Implied Volatility should be higher than the distorted value of 14%. The fit is pretty poor – all one can really tell is that the Spread is more than about 80bp and the Implied Volatility is more than about 12%.
 Click for Big
 Click for Big
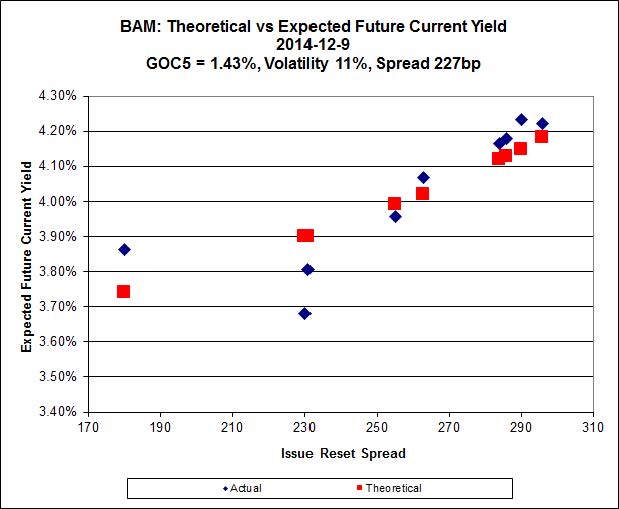
The BAM series is now also a little out of whack:
 Click for Big
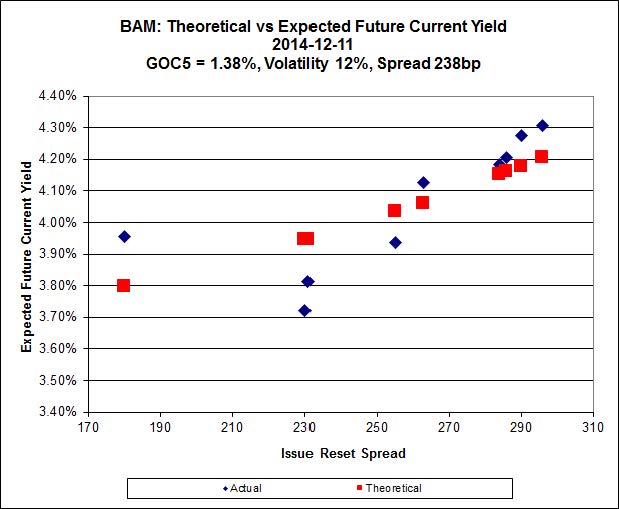
BAM.PR.X, with a +180bp spread, bid at 20.70, looks $0.80 cheap and doesn’t reset until 2017-6-30 while BAM.PR.R, with a +230bp spread, bid at 25.23, looks $1.36 rich and resets 2016-6-30. So go figure that one out, wise guy. As with the MFC series above, it seems that the extreme cheapness of the lowest-spread issue is materially distorting the calculation of Implied Volatility.
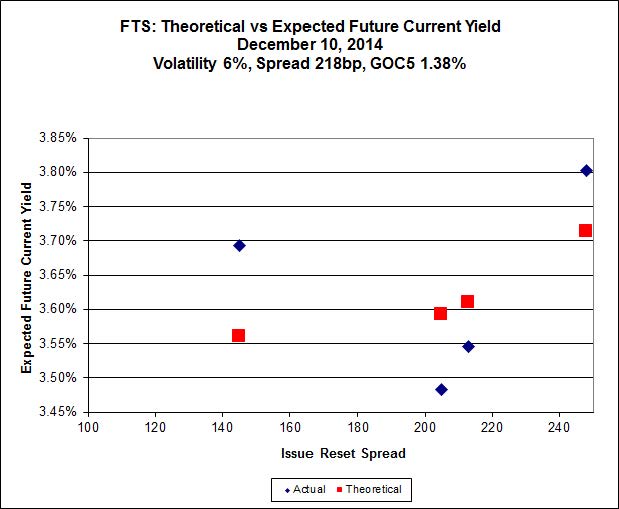
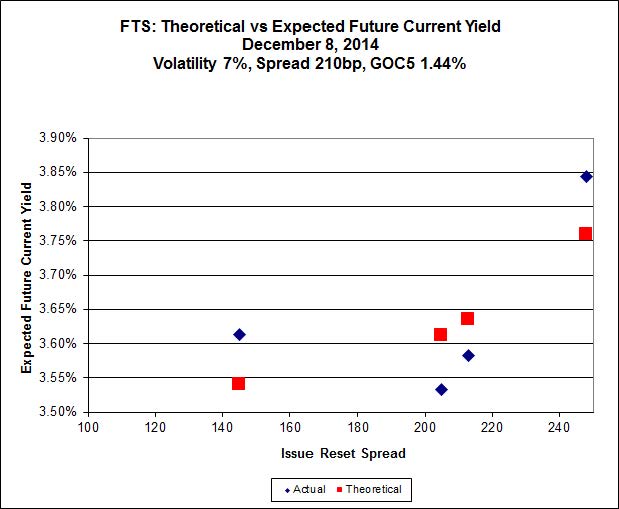
 Click for Big
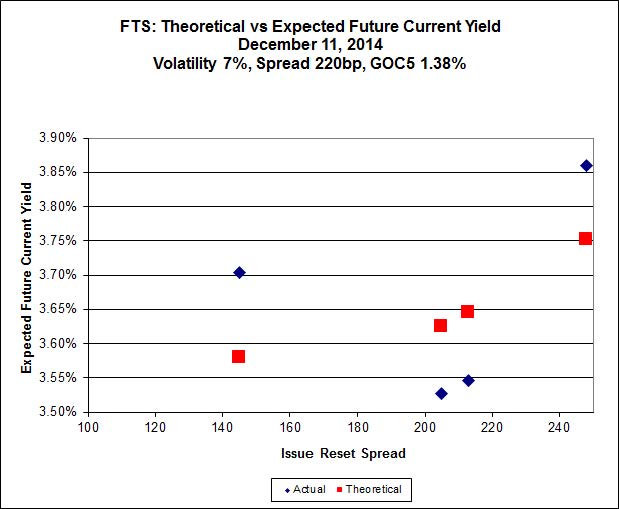
This is just weird because the middle is expensive and the ends are cheap but anyway … FTS.PR.H, with a spread of +145bp, and bid at 19.16, looks $0.71 cheap and resets 2015-6-1. FTS.PR.K, with a spread of +205bp, and bid at 24.62, looks $0.75 expensive and resets 2019-3-1
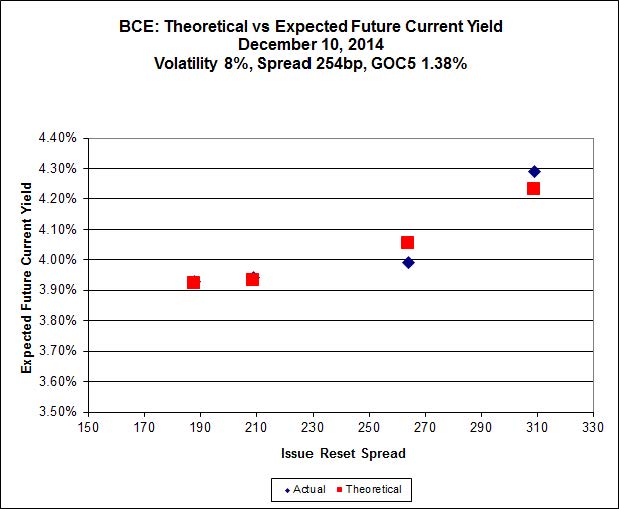
 Click for Big
Oddly, the fit for BCE is pretty good, with the model having no problem fitting BCE.PR.K, resetting at +188bp on 2016-12-30, to the curve formed by the other BCE FixedResets.
HIMIPref™ Preferred Indices
These values reflect the December 2008 revision of the HIMIPref™ Indices
Values are provisional and are finalized monthly |
| Index |
Mean
Current
Yield
(at bid) |
Median
YTW |
Median
Average
Trading
Value |
Median
Mod Dur
(YTW) |
Issues |
Day’s Perf. |
Index Value |
| Ratchet |
0.00 % |
0.00 % |
0 |
0.00 |
0 |
0.0711 % |
2,525.0 |
| FixedFloater |
0.00 % |
0.00 % |
0 |
0.00 |
0 |
0.0711 % |
3,997.5 |
| Floater |
2.99 % |
3.11 % |
61,290 |
19.38 |
4 |
0.0711 % |
2,684.2 |
| OpRet |
4.41 % |
-6.03 % |
28,395 |
0.08 |
2 |
-0.0196 % |
2,751.5 |
| SplitShare |
4.30 % |
4.02 % |
38,826 |
3.73 |
5 |
-0.2087 % |
3,171.9 |
| Interest-Bearing |
0.00 % |
0.00 % |
0 |
0.00 |
0 |
-0.0196 % |
2,515.9 |
| Perpetual-Premium |
5.44 % |
-1.34 % |
72,943 |
0.08 |
20 |
-0.0959 % |
2,474.5 |
| Perpetual-Discount |
5.24 % |
5.14 % |
111,527 |
15.23 |
15 |
-0.9199 % |
2,615.3 |
| FixedReset |
4.28 % |
3.75 % |
206,125 |
16.26 |
75 |
-0.2491 % |
2,514.4 |
| Deemed-Retractible |
5.00 % |
1.75 % |
101,180 |
0.14 |
40 |
0.0319 % |
2,599.1 |
| FloatingReset |
2.55 % |
1.89 % |
60,563 |
3.47 |
5 |
-0.2508 % |
2,544.2 |
| Performance Highlights |
| Issue |
Index |
Change |
Notes |
| FTS.PR.F |
Perpetual-Discount |
-11.87 % |
The “Last” quote, sold to me by the Toronto Stock Exchange of 21.60-24.82 is nonsensical, since there were a number of tiny trades at 3:55pm at about 24.20 (thirteen, all of 100 shares, plus one 95-share odd-lot). The low for the day was 24.19. It is not clear whether this huge burst of market activity overwhelmed the market maker who ran home crying before the bell, or whether a bid was cancelled between the “Close” and the “Last” and I’m not going to spend time and money figuring it out either because, frankly, I’m sick of these clowns.
YTW SCENARIO
Maturity Type : Limit Maturity
Maturity Date : 2044-12-10
Maturity Price : 21.60
Evaluated at bid price : 21.60
Bid-YTW : 5.72 % |
| FTS.PR.H |
FixedReset |
-3.33 % |
YTW SCENARIO
Maturity Type : Limit Maturity
Maturity Date : 2044-12-10
Maturity Price : 19.16
Evaluated at bid price : 19.16
Bid-YTW : 3.83 % |
| TRP.PR.C |
FixedReset |
-2.76 % |
YTW SCENARIO
Maturity Type : Limit Maturity
Maturity Date : 2044-12-10
Maturity Price : 19.01
Evaluated at bid price : 19.01
Bid-YTW : 4.09 % |
| TRP.PR.A |
FixedReset |
-2.48 % |
YTW SCENARIO
Maturity Type : Limit Maturity
Maturity Date : 2044-12-10
Maturity Price : 20.84
Evaluated at bid price : 20.84
Bid-YTW : 4.06 % |
| ENB.PF.C |
FixedReset |
-2.38 % |
YTW SCENARIO
Maturity Type : Limit Maturity
Maturity Date : 2044-12-10
Maturity Price : 22.46
Evaluated at bid price : 23.36
Bid-YTW : 4.44 % |
| ENB.PF.E |
FixedReset |
-2.05 % |
YTW SCENARIO
Maturity Type : Limit Maturity
Maturity Date : 2044-12-10
Maturity Price : 22.47
Evaluated at bid price : 23.41
Bid-YTW : 4.44 % |
| ENB.PR.N |
FixedReset |
-1.86 % |
YTW SCENARIO
Maturity Type : Limit Maturity
Maturity Date : 2044-12-10
Maturity Price : 22.43
Evaluated at bid price : 23.16
Bid-YTW : 4.38 % |
| FTS.PR.J |
Perpetual-Discount |
-1.48 % |
YTW SCENARIO
Maturity Type : Limit Maturity
Maturity Date : 2044-12-10
Maturity Price : 23.62
Evaluated at bid price : 24.00
Bid-YTW : 4.96 % |
| ENB.PF.A |
FixedReset |
-1.42 % |
YTW SCENARIO
Maturity Type : Limit Maturity
Maturity Date : 2044-12-10
Maturity Price : 22.57
Evaluated at bid price : 23.56
Bid-YTW : 4.40 % |
| ENB.PF.G |
FixedReset |
-1.26 % |
YTW SCENARIO
Maturity Type : Limit Maturity
Maturity Date : 2044-12-10
Maturity Price : 22.54
Evaluated at bid price : 23.56
Bid-YTW : 4.43 % |
| MFC.PR.F |
FixedReset |
-1.25 % |
YTW SCENARIO
Maturity Type : Hard Maturity
Maturity Date : 2025-01-31
Maturity Price : 25.00
Evaluated at bid price : 19.75
Bid-YTW : 5.87 % |
| SLF.PR.G |
FixedReset |
-1.22 % |
YTW SCENARIO
Maturity Type : Hard Maturity
Maturity Date : 2025-01-31
Maturity Price : 25.00
Evaluated at bid price : 19.51
Bid-YTW : 5.81 % |
| BNS.PR.Z |
FixedReset |
-1.18 % |
YTW SCENARIO
Maturity Type : Hard Maturity
Maturity Date : 2022-01-31
Maturity Price : 25.00
Evaluated at bid price : 24.37
Bid-YTW : 3.42 % |
| BAM.PR.X |
FixedReset |
-1.00 % |
YTW SCENARIO
Maturity Type : Limit Maturity
Maturity Date : 2044-12-10
Maturity Price : 20.70
Evaluated at bid price : 20.70
Bid-YTW : 4.22 % |
| MFC.PR.B |
Deemed-Retractible |
1.13 % |
YTW SCENARIO
Maturity Type : Hard Maturity
Maturity Date : 2025-01-31
Maturity Price : 25.00
Evaluated at bid price : 23.26
Bid-YTW : 5.58 % |
| GWO.PR.N |
FixedReset |
1.29 % |
YTW SCENARIO
Maturity Type : Hard Maturity
Maturity Date : 2025-01-31
Maturity Price : 25.00
Evaluated at bid price : 19.61
Bid-YTW : 5.66 % |
| MFC.PR.L |
FixedReset |
3.91 % |
YTW SCENARIO
Maturity Type : Hard Maturity
Maturity Date : 2025-01-31
Maturity Price : 25.00
Evaluated at bid price : 25.00
Bid-YTW : 3.75 % |
| Volume Highlights |
| Issue |
Index |
Shares
Traded |
Notes |
| ENB.PF.C |
FixedReset |
180,591 |
Nesbitt sold 10,700 to RBC at 23.89 and crossed 146,700 at 23.50.
YTW SCENARIO
Maturity Type : Limit Maturity
Maturity Date : 2044-12-10
Maturity Price : 22.46
Evaluated at bid price : 23.36
Bid-YTW : 4.44 % |
| BAM.PR.X |
FixedReset |
105,958 |
Nesbitt crossed 94,700 at 20.85.
YTW SCENARIO
Maturity Type : Limit Maturity
Maturity Date : 2044-12-10
Maturity Price : 20.70
Evaluated at bid price : 20.70
Bid-YTW : 4.22 % |
| TRP.PR.A |
FixedReset |
94,514 |
Will reset at 3.266% effective December 31.
YTW SCENARIO
Maturity Type : Limit Maturity
Maturity Date : 2044-12-10
Maturity Price : 20.84
Evaluated at bid price : 20.84
Bid-YTW : 4.06 % |
| HSE.PR.C |
FixedReset |
79,500 |
Recent new issue.
YTW SCENARIO
Maturity Type : Limit Maturity
Maturity Date : 2044-12-10
Maturity Price : 23.15
Evaluated at bid price : 24.98
Bid-YTW : 4.47 % |
| ENB.PR.A |
Perpetual-Premium |
65,438 |
Scotia bought two blocks from Nesbitt, of 26,000 and 20,000, both at 25.50.
YTW SCENARIO
Maturity Type : Call
Maturity Date : 2015-01-09
Maturity Price : 25.00
Evaluated at bid price : 25.25
Bid-YTW : -4.93 % |
| ENB.PR.D |
FixedReset |
59,120 |
Nesbitt crossed 40,000 at 23.00.
YTW SCENARIO
Maturity Type : Limit Maturity
Maturity Date : 2044-12-10
Maturity Price : 22.31
Evaluated at bid price : 22.83
Bid-YTW : 4.21 % |
| There were 33 other index-included issues trading in excess of 10,000 shares. |
| Wide Spread Highlights |
| Issue |
Index |
Quote Data and Yield Notes |
| FTS.PR.F |
Perpetual-Discount |
Quote: 21.60 – 24.80
Spot Rate : 3.2000
Average : 1.7894
YTW SCENARIO
Maturity Type : Limit Maturity
Maturity Date : 2044-12-10
Maturity Price : 21.60
Evaluated at bid price : 21.60
Bid-YTW : 5.72 % |
| HSE.PR.A |
FixedReset |
Quote: 19.41 – 20.21
Spot Rate : 0.8000
Average : 0.5156
YTW SCENARIO
Maturity Type : Limit Maturity
Maturity Date : 2044-12-10
Maturity Price : 19.41
Evaluated at bid price : 19.41
Bid-YTW : 4.20 % |
| FTS.PR.H |
FixedReset |
Quote: 19.16 – 19.74
Spot Rate : 0.5800
Average : 0.3744
YTW SCENARIO
Maturity Type : Limit Maturity
Maturity Date : 2044-12-10
Maturity Price : 19.16
Evaluated at bid price : 19.16
Bid-YTW : 3.83 % |
| MFC.PR.G |
FixedReset |
Quote: 25.60 – 26.10
Spot Rate : 0.5000
Average : 0.3390
YTW SCENARIO
Maturity Type : Call
Maturity Date : 2016-12-19
Maturity Price : 25.00
Evaluated at bid price : 25.60
Bid-YTW : 3.13 % |
| NEW.PR.D |
SplitShare |
Quote: 32.51 – 33.23
Spot Rate : 0.7200
Average : 0.5696
YTW SCENARIO
Maturity Type : Call
Maturity Date : 2015-06-26
Maturity Price : 32.07
Evaluated at bid price : 32.51
Bid-YTW : 3.22 % |
| FTS.PR.J |
Perpetual-Discount |
Quote: 24.00 – 24.50
Spot Rate : 0.5000
Average : 0.3510
YTW SCENARIO
Maturity Type : Limit Maturity
Maturity Date : 2044-12-10
Maturity Price : 23.62
Evaluated at bid price : 24.00
Bid-YTW : 4.96 % |