Archive for March, 2009

Best & Worst Performers: March 2009

Tuesday, March 31st, 2009

These are total returns, with dividends presumed to have been reinvested at the bid price on the ex-date. The list has been restricted to issues in the HIMIPref™ indices.

March 2009
Issue Index DBRS Rating Monthly Performance Notes (“Now” means “March 31”)
IAG.PR.A PerpetualDiscount Pfd-2(high) -8.73% Now with a pre-tax bid-YTW of 8.10% based on a bid of 14.33 and a limitMaturity.
MFC.PR.C PerpetualDiscount Pfd-1(low) -6.25% Now with a pre-tax bid-YTW of 7.59% based on a bid of 15.01 and a limitMaturity.
MFC.PR.B PerpetualDiscount Pfd-1(low) -5.39% Now with a pre-tax bid-YTW of 7.54% based on a bid of 15.61 and a limitMaturity.
HSB.PR.D PerpetualDiscount Pfd-1 -3.91% Now with a pre-tax bid-YTW of 7.73% based on a bid of 16.32 and a limitMaturity.
GWO.PR.F PerpetualDiscount Pfd-1(low) -3.90% Now with a pre-tax bid-YTW of 7.56% based on a bid of 19.70 and a limitMaturity.
RY.PR.H PerpetualDiscount Pfd-1 +6.24% Now with a pre-tax bid-YTW of 6.69% based on a bid of 21.45 and a limitMaturity.
TD.PR.Q PerpetualDiscount Pfd-1 +6.71% Now with a pre-tax bid-YTW of 6.81% based on a bid of 21.00 and a limitMaturity.
TD.PR.R PerpetualDiscount Pfd-1 +6.72% Now with a pre-tax bid-YTW of 6.72% based on a bid of 20.97 and a limitMaturity.
RY.PR.A PerpetualDiscount Pfd-1 +7.29% Now with a pre-tax bid-YTW of 6.57% based on a bid of 17.22 and a limitMaturity.
BAM.PR.B Floater Pfd-2(low) +9.43% Nice to see one of the BAM floaters on this side of ledger!

HIMIPref™ Index Rebalancing: March 2009

Tuesday, March 31st, 2009
HIMI Index Changes, March, 2009
Issue From To Because
PWF.PR.A Floater Scraps Volume
DFN.PR.A SplitShare Scraps Credit
LFE.PR.A SplitShare Scraps Credit
SBN.PR.A SplitShare Scraps Credit

To my chagrin, there are now only three issues left in the SplitShare index, all from BAM Split Corp.: BNA.PR.A, BNA.PR.B and BNA.PR.C.

There were the following intra-month changes:

HIMI Index Changes during March 2009
Issue Action Index Because
FAL.PR.B Delete Scraps Redeemed
MFC.PR.D Add FixedReset New Issue
TD.PR.I Add FixedReset New Issue
CM.PR.M Add FixedReset New Issue
MFC.PR.D Add FixedReset New Issue
RY.PR.T Add FixedReset New Issue
BNS.PR.S Delete FixedReset Coverage Discontinued
MFC.PR.D Add FixedReset New Issue
BMO.PR.O Add FixedReset New Issue
CIU.PR.B Add FixedReset New Issue
HSB.PR.E Add FixedReset New Issue

HSB.PR.E is one of those issues which are sent to try us. It was announced on March 23 with an anticipated closing date of March 31. I have seen nothing to indicate that it didn’t close, but while HSBC Canada may well have received their cheque for $175-250-million, not a single share changed hands on the exchange. With any luck, we’ll see a trade or two tomorrow.

Liquidity Fears for PerpetualDiscounts?

Tuesday, March 31st, 2009

An Assiduous Reader writes in and says:

You are very bullish on Perpetual Discount preferred shares.

No I’m not. I’m neither bullish nor bearish. I will go so far as to say that at this moment in time and speaking very generally, I prefer PerpetualDiscounts to other preferred share classes as I believe their net present value of future cash flows and market price exceeds the net present value of future cash flows and market price of the other classes.

Are you not concerned with the reduction of liquidity that is caused by the issuer buying the shares at market prices versus purchasing them at the Call price? Some of those shares also have American style Call options that make them even uglier.

It is possible that issuers could buy up their extant PerpetualDiscount issues to the extent that trading volume would suffer; but I am not aware of this ever having happened.

However, just because something has never happened before doesn’t mean it will never happen – just ask a sub-prime paper mogul contemplating housing prices 25% below peak! So it’s always worthwhile to consider.

The issue of issuer repurchases was last discussed on PrefBlog last fall, in the post Repurchase of Preferred Shares by Issuer, in which I mentioned one of the rare non-split-share issuer bids, Great-West bidding for GWO.PR.E & GWO.PR.X, large issues that will retract in the relatively near future. That particular repurchase was a fizzle.

If the majority of the issued shares have been purchased back by the issuer then you are left stranded and have to hope that they purchase the rest to get rid of the nuisance.

The following example displays the benefit to the issuer:

Issue Dividend Net Price Shares Issued Cash Dividend Yearly
Cost
New Issue 0.40625 24.25 16,000,000 388,000,000 6,500,000 6.70%
Perpetual Discount 0.29375 15.88 16,000,000 254,080,000 4,700,000
New Cash     16,000,000 133,920,000 1,800,000 5.38%

If I am interpeting this table correctly, my interlocutor is saying that a new issue of 16-million shares of Fixed-Resets could be issued with an initial coupon of 6.70% for a cash receipt after underwriting costs of $388-million. These funds could then be used to buy up an extant issue of 16-million shares of PerpetualDiscounts with an original coupon of 4.7% that is trading at 15.88 to yield 7.4%.

The net effect of this action would be $134-million net new cash to the issuer with a net increase in dividend expenses of $1.8-million quarterly, or 5.38% p.a., which would be a nice way to finance.

Well, all I can say is that it’s not happening yet! I can think of several reasons for this:

  • Inability to purchase significant stock at a 7.4% yield. If the price of the PerpetualDiscount in the example went up to $17.54, it would have a current yield of 6.7%, the same as the putative new issue. All that would happen, I think, is that you’d see a pop in the market price for the duration of the buying programme and people like me would say ‘thank you very much’ and swap into other issues.
  • There would be no change in Tier 1 Regulatory Capital, except to the extent that a profit on cancellation was recorded. While the market price of the PerpetualDiscounts may only be about $16, it’s still on the books as $25.
  • Even at 7.4%, the interest-equivalent yield is only about 10.4%. The banks are targetting a ROE in excess of this figure; therefore they would rather repurchase common equity than the PerpetualDiscount

I am not discounting the notion that liquidity might eventually dry up in the PerpetualDiscount market. In a recent post I highlighted the downward trend in PerpetualDiscount Average Trading Value and Assiduous Reader prefhound commented that It sure looks like the fixed reset pref has stolen some of the trading volume from discount prefs.. This may or may not be a factor in the recent elevated spreads against corporates. I suspect not, but it’s something of a chicken-and-egg problem and I’ll reserve judgement until the credit crunch is over!

Volumes are – to date! – sufficient to allow active trading, but we’ll see. It is possible – unlikely, I think, but nevertheless possible – that PerpetualDiscounts could go down the same road travelled by banks’ 100-year floating rate bonds, that were so popular in the eighties and now trade by appointment only at an enormous spread.

Obviously, the fixed resets can suffer the same fate! The only saving grace is that they have a floor on the yield that makes the probability of the option being called higher and saving you from being orphaned.

It would be interesting to know what the median lifetime of a Canadian Bank preferred share before total purchase/recall.

In my essay Are Floating Prefs Money Market Vehicles?, I reported that the average life of called straight perpetual issue was 10.2 years; i.e., just a little over the normal 9-year period before an issue with standard terms can be called at par (a call at $26 is normal after five years, declining by $0.25 annually).

So there you have it, such as it is! Forecasting future prices is chancy enough; forecasting liquidity is worse. All you can do is stay alert for changes and stay diversified.

March 31, 2009

Tuesday, March 31st, 2009

Wouldn’t you know it! No sooner do I award plaudits to HOOPP and point out the wonderful thing about being an independent fund manager with a captive clientele (March 25) than the Ontario government comes up with a thoroughly lunatic scheme to make Teachers’ compete for clients:

The government is introducing legislation that, if passed, would expand the mandate of the Ontario Teachers’ Pension Plan (OTPP) Board if the government and the Ontario Teachers’ Federation (as Partners of the Plan) agree. The amendment would permit the OTPP Board to provide pension administration and investment services to other pension plans and institutional investors in the public sector.

  • Benefits would include higher revenues for the OTPP Board, lower administrative costs and enhanced investment opportunities for future OTPP clients.
  • This change is consistent with recommendations of the Expert Commission on Pensions that large pension plans be permitted to offer their services to smaller pension plans to improve investment returns for Ontario pension plans and others

The empire builders and salesmen-wannabes at Teachers’ are thrilled:

“The Ontario government’s proposed amendment to the Teachers’ Pension Act represents an encouraging step forward towards pension reform for thousands of Ontarians,” said Jim Leech, President and CEO of the Ontario Teachers’ Pension Plan (Teachers’). The amendment was introduced as part of the Ontario government’s 2009 budget.

“This move would allow us to help smaller pension plans and other institutions meet their beneficiaries’ needs,” he said. “We could pool significantly large amounts of capital and make our resources, such as our direct investing expertise, available to manage their funds. Their beneficiaries would benefit in gaining expertise, scope and scale.”

You can tell he’s been booking up for this opportunity. He’s using the same words every single investment manager that has ever existed in the history of the entire universe has used to flog his funds.

The report itself completely misses the point:

However, lower investment fees are but one of the many advantages enjoyed by large plans over smaller ones and over individual savers. In terms of income generation, large plans are in a position to hire expert staff to initiate and execute their investment strategies, to make attractive private placements of their investment funds, and to spread the investment risk by acquiring a wider range of investment vehicles. In terms of administrative expense, large plans are able to reduce their unit costs of administration by spreading them across a large plan membership, and they are typically able to offer members enhanced levels of information, education and service. Finally, large plans are more likely to survive than smaller ones, if only because the enterprises (or groups of enterprises) that sponsor them are likely to be more stable or resilient than those that sponsor small plans.

The cumulative effect of all of these advantages is extremely significant. It is so significant, in fact, that plan size may be a greater determinant of a member’s pension than plan design. Or, to make a more modest claim — holding plan design constant — large plans will generally perform better than small ones.

Modest claim, eh? There’s a very easy way to test this: look at the performance of investment managers by AUM and come up with a correlation between size and performance. After all, a large manager has the same ability to “hire expert staff”, “make attractive private placements” and “spread investment risk”. Sadly, the so-called expert commission does not appear to have thought of such a real-world test of their hypothesis.

Incredibly, there are still some people who believe that markets are efficient, notwithstanding the immense profitability of dealers’ proprietary trading and evidence that mutual fund investors have real difficulties getting their timing right. Correct me if I’m wrong, but shouldn’t it be true that if one clearly identifiable group is underperforming the market (pre-fees), then their should be another clearly identifiable group that is outperforming? Just wondering. Somebody has to, the Expert Commission isn’t.

In the investment business, sales isn’t simply a slight extra cost stuck on to the firm’s expenses. Sales is pervasive throughout the organization; from coming up with an interesting story to tell, through avoiding ‘fessing up to mistakes and all the way through to hiring good talkers in preference to good doers until, in the end, investment management is viewed as just another irritating expense rather than the organization’s raison d’etre. And that, ladies and gentlemen, is what costs the money; not piddly little management fees. Not transaction fees either, although transaction costs might.

Teachers can only hope that the proportion of external assets attracted by their manager will remain at less than 10% of the total – say another $10-billion. At that level, sales really will be simply an addendum to the real business of investment management. Any higher though, and there’s a real risk that investment management will become an addendum to the real business of sales.

March came in a lion and left like a lamb, with the PerpetualDiscount market having a great day on decent volume to close with a yield of 7.29%, equivalent to 10.21% at the standard equivalency factor of 1.4x. Long corporates continue to yield a BORING 7.5% (maybe just a hair under), having returned +2.74% over the month, so the pre-tax interest-equivalent spread is ending the quarter at 271bp … still elevated by all but recent standards.

Happy birthday, Malachite Aggressive Preferred Fund!

HIMIPref™ Preferred Indices
These values reflect the December 2008 revision of the HIMIPref™ Indices

Values are provisional and are finalized monthly
Index Mean
Current
Yield
(at bid)
Median
YTW
Median
Average
Trading
Value
Median
Mod Dur
(YTW)
Issues Day’s Perf. Index Value
Ratchet 0.00 % 0.00 % 0 0.00 0 0.8383 % 870.3
FixedFloater 0.00 % 0.00 % 0 0.00 0 0.8383 % 1,407.4
Floater 4.55 % 5.49 % 63,344 14.68 3 0.8383 % 1,087.2
OpRet 5.23 % 4.75 % 130,600 3.87 15 0.3859 % 2,073.3
SplitShare 6.77 % 9.63 % 47,467 4.78 6 2.7153 % 1,644.0
Interest-Bearing 6.19 % 9.96 % 32,922 0.72 1 0.1032 % 1,927.6
Perpetual-Premium 0.00 % 0.00 % 0 0.00 0 1.0363 % 1,516.3
Perpetual-Discount 7.16 % 7.29 % 154,090 12.21 71 1.0363 % 1,396.5
FixedReset 6.12 % 5.91 % 796,648 13.68 33 0.4436 % 1,824.9
Performance Highlights
Issue Index Change Notes
BNA.PR.B SplitShare -1.82 % Asset coverage of 1.7-:1 as of February 28, according to the company. This should increase somewhat for 3/31, as BAM.A closed at 16.86 on Feb. 28 and 17.57 on Mar. 31.
YTW SCENARIO
Maturity Type : Hard Maturity
Maturity Date : 2016-03-25
Maturity Price : 25.00
Evaluated at bid price : 20.53
Bid-YTW : 8.51 %
BAM.PR.O OpRet -1.70 % YTW SCENARIO
Maturity Type : Option Certainty
Maturity Date : 2013-06-30
Maturity Price : 25.00
Evaluated at bid price : 21.38
Bid-YTW : 9.25 %
RY.PR.H Perpetual-Discount -1.38 % YTW SCENARIO
Maturity Type : Limit Maturity
Maturity Date : 2039-03-31
Maturity Price : 21.45
Evaluated at bid price : 21.45
Bid-YTW : 6.69 %
RY.PR.R FixedReset -1.17 % YTW SCENARIO
Maturity Type : Call
Maturity Date : 2014-03-26
Maturity Price : 25.00
Evaluated at bid price : 25.45
Bid-YTW : 6.11 %
BMO.PR.H Perpetual-Discount -1.02 % YTW SCENARIO
Maturity Type : Limit Maturity
Maturity Date : 2039-03-31
Maturity Price : 19.50
Evaluated at bid price : 19.50
Bid-YTW : 6.91 %
BNA.PR.C SplitShare 1.00 % Asset coverage of 1.7-:1 as of February 28, according to the company. This should increase somewhat for 3/31, as BAM.A closed at 16.86 on Feb. 28 and 17.57 on Mar. 31.
YTW SCENARIO
Maturity Type : Hard Maturity
Maturity Date : 2019-01-10
Maturity Price : 25.00
Evaluated at bid price : 11.11
Bid-YTW : 15.86 %
ELF.PR.G Perpetual-Discount 1.02 % YTW SCENARIO
Maturity Type : Limit Maturity
Maturity Date : 2039-03-31
Maturity Price : 13.25
Evaluated at bid price : 13.25
Bid-YTW : 9.02 %
HSB.PR.C Perpetual-Discount 1.04 % YTW SCENARIO
Maturity Type : Limit Maturity
Maturity Date : 2039-03-31
Maturity Price : 17.50
Evaluated at bid price : 17.50
Bid-YTW : 7.35 %
GWO.PR.G Perpetual-Discount 1.04 % YTW SCENARIO
Maturity Type : Limit Maturity
Maturity Date : 2039-03-31
Maturity Price : 17.43
Evaluated at bid price : 17.43
Bid-YTW : 7.53 %
TD.PR.A FixedReset 1.07 % YTW SCENARIO
Maturity Type : Limit Maturity
Maturity Date : 2039-03-31
Maturity Price : 22.71
Evaluated at bid price : 22.75
Bid-YTW : 4.49 %
BNS.PR.K Perpetual-Discount 1.14 % YTW SCENARIO
Maturity Type : Limit Maturity
Maturity Date : 2039-03-31
Maturity Price : 17.70
Evaluated at bid price : 17.70
Bid-YTW : 6.93 %
BNS.PR.M Perpetual-Discount 1.15 % YTW SCENARIO
Maturity Type : Limit Maturity
Maturity Date : 2039-03-31
Maturity Price : 16.66
Evaluated at bid price : 16.66
Bid-YTW : 6.90 %
RY.PR.F Perpetual-Discount 1.22 % YTW SCENARIO
Maturity Type : Limit Maturity
Maturity Date : 2039-03-31
Maturity Price : 16.55
Evaluated at bid price : 16.55
Bid-YTW : 6.84 %
TD.PR.Y FixedReset 1.26 % YTW SCENARIO
Maturity Type : Limit Maturity
Maturity Date : 2039-03-31
Maturity Price : 21.66
Evaluated at bid price : 21.70
Bid-YTW : 4.48 %
BMO.PR.J Perpetual-Discount 1.27 % YTW SCENARIO
Maturity Type : Limit Maturity
Maturity Date : 2039-03-31
Maturity Price : 16.70
Evaluated at bid price : 16.70
Bid-YTW : 6.85 %
NA.PR.L Perpetual-Discount 1.28 % YTW SCENARIO
Maturity Type : Limit Maturity
Maturity Date : 2039-03-31
Maturity Price : 17.46
Evaluated at bid price : 17.46
Bid-YTW : 7.08 %
NA.PR.N FixedReset 1.30 % YTW SCENARIO
Maturity Type : Limit Maturity
Maturity Date : 2039-03-31
Maturity Price : 23.22
Evaluated at bid price : 23.30
Bid-YTW : 4.49 %
NA.PR.M Perpetual-Discount 1.31 % YTW SCENARIO
Maturity Type : Limit Maturity
Maturity Date : 2039-03-31
Maturity Price : 20.81
Evaluated at bid price : 20.81
Bid-YTW : 7.35 %
CM.PR.I Perpetual-Discount 1.34 % YTW SCENARIO
Maturity Type : Limit Maturity
Maturity Date : 2039-03-31
Maturity Price : 15.88
Evaluated at bid price : 15.88
Bid-YTW : 7.42 %
GWO.PR.I Perpetual-Discount 1.36 % YTW SCENARIO
Maturity Type : Limit Maturity
Maturity Date : 2039-03-31
Maturity Price : 14.90
Evaluated at bid price : 14.90
Bid-YTW : 7.62 %
CM.PR.E Perpetual-Discount 1.56 % YTW SCENARIO
Maturity Type : Limit Maturity
Maturity Date : 2039-03-31
Maturity Price : 18.85
Evaluated at bid price : 18.85
Bid-YTW : 7.45 %
CM.PR.G Perpetual-Discount 1.61 % YTW SCENARIO
Maturity Type : Limit Maturity
Maturity Date : 2039-03-31
Maturity Price : 18.26
Evaluated at bid price : 18.26
Bid-YTW : 7.41 %
BNS.PR.R FixedReset 1.62 % YTW SCENARIO
Maturity Type : Limit Maturity
Maturity Date : 2039-03-31
Maturity Price : 21.96
Evaluated at bid price : 22.00
Bid-YTW : 4.56 %
PWF.PR.M FixedReset 1.63 % YTW SCENARIO
Maturity Type : Limit Maturity
Maturity Date : 2039-03-31
Maturity Price : 24.95
Evaluated at bid price : 25.00
Bid-YTW : 5.38 %
RY.PR.I FixedReset 1.72 % YTW SCENARIO
Maturity Type : Limit Maturity
Maturity Date : 2039-03-31
Maturity Price : 22.96
Evaluated at bid price : 23.00
Bid-YTW : 4.37 %
PWF.PR.L Perpetual-Discount 1.73 % YTW SCENARIO
Maturity Type : Limit Maturity
Maturity Date : 2039-03-31
Maturity Price : 16.42
Evaluated at bid price : 16.42
Bid-YTW : 7.95 %
DFN.PR.A SplitShare 1.75 % Asset coverage of 1.5+:1 as of March 13, according to the company. Since then, XFN has improved from 14.17 to 14.70.
YTW SCENARIO
Maturity Type : Hard Maturity
Maturity Date : 2014-12-01
Maturity Price : 10.00
Evaluated at bid price : 8.15
Bid-YTW : 9.63 %
RY.PR.A Perpetual-Discount 1.77 % YTW SCENARIO
Maturity Type : Limit Maturity
Maturity Date : 2039-03-31
Maturity Price : 17.22
Evaluated at bid price : 17.22
Bid-YTW : 6.57 %
SLF.PR.D Perpetual-Discount 1.81 % YTW SCENARIO
Maturity Type : Limit Maturity
Maturity Date : 2039-03-31
Maturity Price : 14.61
Evaluated at bid price : 14.61
Bid-YTW : 7.69 %
GWO.PR.H Perpetual-Discount 1.83 % YTW SCENARIO
Maturity Type : Limit Maturity
Maturity Date : 2039-03-31
Maturity Price : 16.13
Evaluated at bid price : 16.13
Bid-YTW : 7.59 %
TD.PR.S FixedReset 1.85 % YTW SCENARIO
Maturity Type : Limit Maturity
Maturity Date : 2039-03-31
Maturity Price : 21.50
Evaluated at bid price : 21.50
Bid-YTW : 4.39 %
BAM.PR.K Floater 1.87 % YTW SCENARIO
Maturity Type : Limit Maturity
Maturity Date : 2039-03-31
Maturity Price : 7.61
Evaluated at bid price : 7.61
Bid-YTW : 5.77 %
ELF.PR.F Perpetual-Discount 1.89 % YTW SCENARIO
Maturity Type : Limit Maturity
Maturity Date : 2039-03-31
Maturity Price : 14.80
Evaluated at bid price : 14.80
Bid-YTW : 9.01 %
CM.PR.H Perpetual-Discount 1.93 % YTW SCENARIO
Maturity Type : Limit Maturity
Maturity Date : 2039-03-31
Maturity Price : 16.38
Evaluated at bid price : 16.38
Bid-YTW : 7.34 %
SLF.PR.A Perpetual-Discount 2.09 % YTW SCENARIO
Maturity Type : Limit Maturity
Maturity Date : 2039-03-31
Maturity Price : 15.62
Evaluated at bid price : 15.62
Bid-YTW : 7.67 %
RY.PR.W Perpetual-Discount 2.13 % YTW SCENARIO
Maturity Type : Limit Maturity
Maturity Date : 2039-03-31
Maturity Price : 18.69
Evaluated at bid price : 18.69
Bid-YTW : 6.66 %
PWF.PR.F Perpetual-Discount 2.21 % YTW SCENARIO
Maturity Type : Limit Maturity
Maturity Date : 2039-03-31
Maturity Price : 18.00
Evaluated at bid price : 18.00
Bid-YTW : 7.46 %
BNS.PR.N Perpetual-Discount 2.31 % YTW SCENARIO
Maturity Type : Limit Maturity
Maturity Date : 2039-03-31
Maturity Price : 19.50
Evaluated at bid price : 19.50
Bid-YTW : 6.88 %
CM.PR.J Perpetual-Discount 2.33 % YTW SCENARIO
Maturity Type : Limit Maturity
Maturity Date : 2039-03-31
Maturity Price : 15.36
Evaluated at bid price : 15.36
Bid-YTW : 7.34 %
PWF.PR.G Perpetual-Discount 2.51 % YTW SCENARIO
Maturity Type : Limit Maturity
Maturity Date : 2039-03-31
Maturity Price : 19.64
Evaluated at bid price : 19.64
Bid-YTW : 7.69 %
MFC.PR.C Perpetual-Discount 2.67 % YTW SCENARIO
Maturity Type : Limit Maturity
Maturity Date : 2039-03-31
Maturity Price : 15.01
Evaluated at bid price : 15.01
Bid-YTW : 7.59 %
SLF.PR.B Perpetual-Discount 2.86 % YTW SCENARIO
Maturity Type : Limit Maturity
Maturity Date : 2039-03-31
Maturity Price : 15.84
Evaluated at bid price : 15.84
Bid-YTW : 7.65 %
PWF.PR.E Perpetual-Discount 2.95 % YTW SCENARIO
Maturity Type : Limit Maturity
Maturity Date : 2039-03-31
Maturity Price : 18.85
Evaluated at bid price : 18.85
Bid-YTW : 7.46 %
ENB.PR.A Perpetual-Discount 3.25 % YTW SCENARIO
Maturity Type : Limit Maturity
Maturity Date : 2039-03-31
Maturity Price : 23.58
Evaluated at bid price : 23.85
Bid-YTW : 5.83 %
CM.PR.D Perpetual-Discount 3.27 % YTW SCENARIO
Maturity Type : Limit Maturity
Maturity Date : 2039-03-31
Maturity Price : 19.90
Evaluated at bid price : 19.90
Bid-YTW : 7.24 %
BAM.PR.J OpRet 3.49 % YTW SCENARIO
Maturity Type : Soft Maturity
Maturity Date : 2018-03-30
Maturity Price : 25.00
Evaluated at bid price : 18.11
Bid-YTW : 10.22 %
MFC.PR.B Perpetual-Discount 3.72 % YTW SCENARIO
Maturity Type : Limit Maturity
Maturity Date : 2039-03-31
Maturity Price : 15.61
Evaluated at bid price : 15.61
Bid-YTW : 7.54 %
PWF.PR.H Perpetual-Discount 3.73 % YTW SCENARIO
Maturity Type : Limit Maturity
Maturity Date : 2039-03-31
Maturity Price : 18.63
Evaluated at bid price : 18.63
Bid-YTW : 7.90 %
PWF.PR.K Perpetual-Discount 3.75 % YTW SCENARIO
Maturity Type : Limit Maturity
Maturity Date : 2039-03-31
Maturity Price : 16.60
Evaluated at bid price : 16.60
Bid-YTW : 7.63 %
BNA.PR.A SplitShare 3.96 % Asset coverage of 1.7-:1 as of February 28, according to the company. This should increase somewhat for 3/31, as BAM.A closed at 16.86 on Feb. 28 and 17.57 on Mar. 31.
YTW SCENARIO
Maturity Type : Hard Maturity
Maturity Date : 2010-09-30
Maturity Price : 25.00
Evaluated at bid price : 23.65
Bid-YTW : 10.61 %
SBN.PR.A SplitShare 4.36 % Asset coverage of 1.6+:1 as of March 26 according to the company. Since then, BNS has declined from 31.72 to 31.07.
YTW SCENARIO
Maturity Type : Hard Maturity
Maturity Date : 2014-12-01
Maturity Price : 10.00
Evaluated at bid price : 8.86
Bid-YTW : 7.86 %
LFE.PR.A SplitShare 6.93 % Repairing most of the damage from yesterday, when it was down 7.78%. It’s doing this on little volume, trading 2,100 shares today in a range of 7.08-30 before closing at 7.10-47, 34×13. Asset coverage of 1.1-:1 as of March 13 according to the company. Since then, XFN has increased from 14.17 to 14.70.
YTW SCENARIO
Maturity Type : Hard Maturity
Maturity Date : 2012-12-01
Maturity Price : 10.00
Evaluated at bid price : 7.10
Bid-YTW : 16.14 %
Volume Highlights
Issue Index Shares
Traded
Notes
TD.PR.I FixedReset 64,720 Recent new issue.
YTW SCENARIO
Maturity Type : Limit Maturity
Maturity Date : 2039-03-31
Maturity Price : 25.06
Evaluated at bid price : 25.11
Bid-YTW : 6.03 %
RY.PR.T FixedReset 49,806 Recent new issue.
YTW SCENARIO
Maturity Type : Limit Maturity
Maturity Date : 2039-03-31
Maturity Price : 23.17
Evaluated at bid price : 25.11
Bid-YTW : 5.86 %
TD.PR.G FixedReset 48,688 YTW SCENARIO
Maturity Type : Call
Maturity Date : 2014-05-30
Maturity Price : 25.00
Evaluated at bid price : 25.60
Bid-YTW : 5.98 %
PWF.PR.K Perpetual-Discount 48,455 YTW SCENARIO
Maturity Type : Limit Maturity
Maturity Date : 2039-03-31
Maturity Price : 16.60
Evaluated at bid price : 16.60
Bid-YTW : 7.63 %
RY.PR.R FixedReset 48,035 YTW SCENARIO
Maturity Type : Call
Maturity Date : 2014-03-26
Maturity Price : 25.00
Evaluated at bid price : 25.45
Bid-YTW : 6.11 %
BMO.PR.O FixedReset 42,935 Recent new issue.
YTW SCENARIO
Maturity Type : Limit Maturity
Maturity Date : 2039-03-31
Maturity Price : 25.02
Evaluated at bid price : 25.07
Bid-YTW : 6.39 %
There were 33 other index-included issues trading in excess of 10,000 shares.

How Long is a Long-Term Investment?

Tuesday, March 31st, 2009

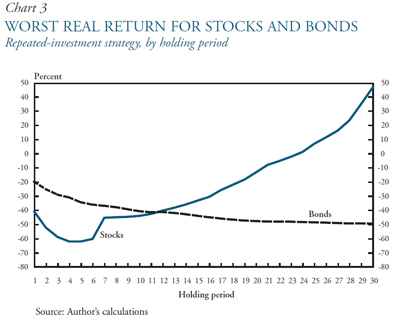
If I don’t give myself a way of finding this article quickly, I’m going to go out of my mind! I think this is a very good exposition of the stocks/bonds conundrum, and regularly spend half an hour looking up the reference – no more!

How Long is a Long-Term Investment? was written by Pu Shen of the Kansas City Fed and published in the Spring 2005 edition of their Economic Review.

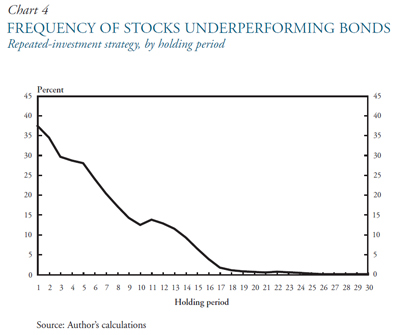
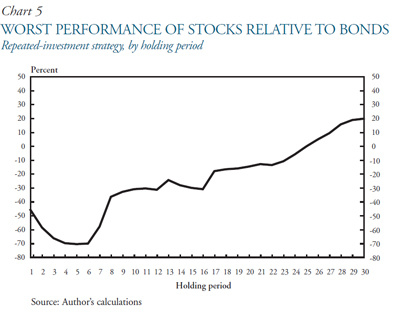
Unfortunately, the source-file is copy-protected (why do they do that?) but I can recommend this article as part of the asset allocation process; it has many fascinating graphs. The laboriously re-typed conclusion is:

This article confirms the conventional wisdom that in the United States stocks historically have been safer than long-term government bonds for investors with long holding periods. But the article also shows that the conventional wisdom has only been true for investors who held their portfolios for more than 25 years. For practical purposes, that may be too long a holding period for most investors. Over the years, for investors who have held their portfolios for shorter periods, both stocks and bonds were exposed to substantial risks, and stocks did not necessarily outperform government bonds. This implies that in making asset allocation decisions, investors should think carefully about how long they will be able to hold their portfolios undisturbed and how much risk they are willing to bear.

Update: A little bird has sent me an unlocked version of the paper, so I can reproduce my three favourite graphs:

BIS Releases Working Paper on ABX.HE Pricing

Tuesday, March 31st, 2009

The Bank for International Settlements has announced the release of Working Paper #279, The pricing of subprime mortgage risk in good times and bad: evidence from the ABX.HE indices by Ingo Fender and Martin Scheicher.

This paper investigates the market pricing of subprime mortgage risk on the basis of data for the ABX.HE family of indices, which have become a key barometer of mortgage market conditions during the recent financial crisis. After an introduction into ABX index mechanics and a discussion of historical pricing patterns, we use regression analysis to establish the relationship between observed index returns and macroeconomic news as well as market-based proxies of default risk, interest rates, liquidity and risk appetite. The results imply that declining risk appetite and heightened concerns about market illiquidity—likely due in part to significant short positioning activity—have provided a sizeable contribution to the observed collapse in ABX prices since the summer of 2007. In particular, while fundamental factors, such as indicators of housing market activity, have continued to exert an important influence on the subordinated ABX indices, those backed by AA and AAA exposures have tended to react more to the general deterioration of the financial market environment. This provides further support for the inappropriateness of pricing models that do not sufficiently account for factors such as risk appetite and liquidity risk, particularly in periods of heightened market pressure. In addition, as related risk premia can be captured by unconstrained investors, ABX pricing patterns appear to lend support to government measures aimed at taking troubled assets off banks’ balance sheets—such as the US Troubled Asset Relief Program (TARP).

The authors observe:

With market liquidity vanishing and entire market segments becoming largely dysfunctional, factors other than credit risk became increasingly important drivers of observed prices. This, in turn, rekindled earlier doubts concerning the validity of currently available models for the pricing of credit risk, particularly for portfolio instruments such as mortgage-backed securities and other complex securitisations.

The results presented in this paper suggest that declining risk appetite and heightened concerns about market illiquidity have provided a sizeable contribution to the observed collapse in ABX prices since July 2007. While fundamental factors, such as indicators of housing market activity, have continued to exert an important influence on the subordinated ABX indices, the AA and AAA indices have tended to react more to the general deterioration of the financial market environment, such as declining risk appetite and market liquidity. These results underline the well-established view that risk premia are important components of observed prices for default-risky products, and that the relative importance of non-default risk factors will tend to increase in periods of strong repricing of credit risk. This suggests that theoretical pricing models that do not sufficiently account for these factors may be inappropriate, particularly in periods of heightened market pressure.

The Value of Liquidity

Tuesday, March 31st, 2009

Assiduous Readers will be well aware that I often include articles in the blog for no other reason than to bookmark them. Having just spent twenty minutes trying to find this article after reading it some time ago, it is clear that I shall have to redouble my efforts!

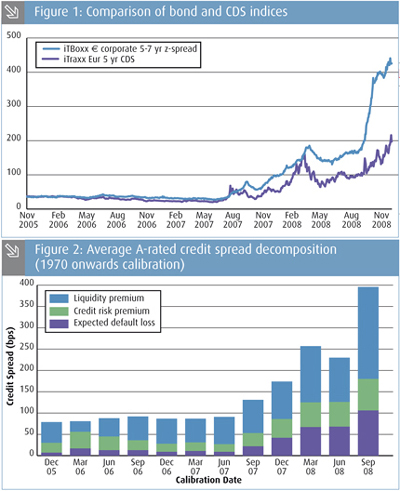
Paul Fulcher of UBS and Colin Wilson of Barrie & Hibbert wrote a nice summary regarding credit spread decomposition for The Actuary, titled Financial Crisis: The Value of Liquidity. I thought they made the central point very well:

The spread on corporate bonds over the liquid risk-free rate (for example, government bonds) represents compensation for several different factors:

A Expected default losses
B Unexpected default risk, such as default and recovery rate risk
C Mark-to-market risk, such as the risk of a fall in the market price of the bond
D Liquidity risk, such as the risk of not finding a ready buyer at the theoretical market price.

Investors concerned with the realisable value of their investment in the short-term require compensation for all these risks.

However, investors who can hold bonds to maturity need compensation only for A and B. Such investors can enjoy the premiums for C and D, and we refer to these collectively as a ‘liquidity premium’.

There are some good references, too:

March 30, 2009

Monday, March 30th, 2009

James Hamilton of Econbrowser wrote a very good post on the weekend, Money Creation and the Fed, addressing the near-vertical increase in the monetary base since September 2008 when the credit crunch really started crunching. Of particular interest were remarks by Charles Plosser of the Philadelphia Fed:

However, under current circumstances, the Fed has substituted less liquid assets for Treasuries. It is true that a number of the Fed’s new programs will unwind naturally and fairly quickly as they are terminated because they involve primarily short-term assets. Yet we must anticipate that special interests and political pressures may make it harder to terminate these programs in a timely manner, thus making it difficult to shrink our balance sheet when the time comes. Moreover, some of these programs involve longer-term assets — like the agency MBS. Such assets may prove difficult to sell for an extended period of time if markets are viewed as “fragile” or specific interest groups are strongly opposed, which could prove very damaging to our longer-term objective of price stability. Thus, we must ensure that our current credit policies do not constrain our ability to conduct appropriate monetary policy in the future.

Even more important, credit allocation decisions, in my view, should be under the purview of the fiscal authority, not the monetary authority, since they involve using the public’s money to affect the allocation of resources. The mixing of monetary policy and fiscal policy increases the number of entities that might try to influence Fed decision-making in their favor. Both economic theory and practice indicate that central banks should operate independently from such pressures and resist them when they arise so that their policies benefit society at large over the longer term and not any particular constituency in the near term.

Today, an accord to substitute Treasuries for non-Treasury debt on our balance sheet would similarly help ensure that the Fed will be able to implement its policy decisions. After all, the time will come when the Fed will want to begin raising interest rates to achieve its goals. With Treasuries back on the balance sheet, the Fed will be able to drain reserves in a timely fashion with minimal concerns about disrupting particular credit allocations or the pressures from special interests.

Dr. Hamilton concludes on a sanguine note:

Which brings me back to the original question. Does the explosive growth of the monetary base in Figure 1 imply uncontrollable inflationary pressures? My answer: not yet, but stay tuned.

I am confident that the Fed will retain its independence and sell its assets back to the public as soon as the public wishes to pay a reasonable price; I am also confident that most of what the Fed is doing is exactly what central banks are supposed to do: making liquidity available in times of stress at a penalty rate against good collateral.

I will justify the “penalty rate” part of that assertion by noting that, given the excess reserves are on the books paying 0.25%, a 4.5%-5.0% rate on mortgage assets is punitive by any normal measure.

However, I do agree with Mr. Plosser to the extent that direct ownership of assets by the Fed is a nervous thing, and that it should be Treasury stepping up and taking actual ownership risk. In the Fed’s efforts to make credit available, it should always have some degree of first-loss protection, whether that protection is given (explicitly!) by Treasury or by the private sector is immaterial.

Dr. Hamilton followed up his first post with another one, The Fed’s New Balance Sheet:

I am uncomfortable on a general level with the suggestion that unelected Fed officials are better able to make such decisions than private investors who put their own capital where they think it will earn the highest reward. Apart from that general unease, I have a particular concern about the motivation for the Term Asset-Backed Securities Loan Facility, whose goal is to generate up to $1 trillion of lending for businesses and households by catalyzing a revival of loan securitization.

But the whole premise behind those Aaa ratings– that securitization could isolate a “safe” component of a pool of fundamentally risky loans– was deeply flawed. It is impossible to diversify away aggregate or systemic risk. All that the device did was to mislead investors into thinking they were protected from those nondiversifiable risks and push those risks onto the taxpayers and the Fed. Before we decide that securitization is the road out of our present difficulties, I would like a detailed and convincing explanation of why the past mistakes are not going to be repeated again.

Dr. Hamilton … you’re going to be deeply disappointed. Financial fads are as old as the concept of money and when we do enough stupid things it requires a recession to show us the error of our ways.

I do not believe that securitization is not “the road out of our present difficulties” nor, I suggest, is the Fed intending to send that signal. What we have now is an ice dam blocking the flow of credit; the pendulum has swung more than half-way; investors are refusing point-blank to invest in securitization paper regardless of the nature of the underlying assets or the credit quality of the paper.

Rational views on credit risk will return – they always do – but the current blind fear is just as far removed from rationality as the recent blind adoration. The Fed must blow up the ice dam to prevent unnecessary damage to the economy as a whole and allow the credit markets to find a new balance gradually.

As stated, however, I do believe that direct purchase of assets by the Fed is a Bad Thing. Loans against assets, with overcollateralization, are good; but direct purchase should indeed be an explicitly political decision.

Bloomberg News points out that the joint Fed/Treasury press release (reported by PrefBlog on March 23) could have more implications than have been commonly discussed:

The release said that while the Fed collaborates with other agencies to preserve financial stability, it alone is in charge of keeping consumer prices stable, its independence “critical.”

The statement was the culmination of a behind-the-scenes, two-month long debate involving the Fed’s Open Market Committee, as well as the Treasury. The discussions were driven by Chairman Ben S. Bernanke’s concern that work with the Bush and Obama administrations on repairing banks and markets not lead to attempts at political pressure later that would delay the start of measures to combat inflation.

Mark-to-Market accounting is being eviscerated, not without controversy:

Four days after U.S. lawmakers berated Financial Accounting Standards Board Chairman Robert Herz and threatened to take rulemaking out of his hands, FASB proposed an overhaul of fair-value accounting that may improve profits at banks such as Citigroup Inc. by more than 20 percent.

The changes proposed on March 16 to fair-value, also known as mark-to-market accounting, would allow companies to use “significant judgment” in valuing assets and reduce the amount of writedowns they must take on so-called impaired investments, including mortgage-backed securities. A final vote on the resolutions, which would apply to first-quarter financial statements, is scheduled for April 2.

By letting banks use internal models instead of market prices and allowing them to take into account the cash flow of securities, FASB’s change could boost bank industry earnings by 20 percent, [tax & accounting advisor Robert] Willens said.

The Treasury Market Practices Group has released a few adjustments to its recommended fails charge procedure to lower the administrative burden on implementation.

Bank of Canada Governor Carney today delivered a speech that was remarkable for it’s degree of ass-covering and blame-shifting:

We now face important policy questions about which activities banks should perform, which should be located in sustainable, continuously-open markets, and which should be prohibited.

Markets might be sustainable and continuously open, but that is no guarantee they’re going to be doing any business.

First, banks have become increasingly heavy users of markets to fund their activities. In recent years, many international banks borrowed in short-term markets to finance asset growth and, in the process, to substantially increase their leverage. This made them increasingly dependent on continuous access to liquidity in money and capital markets. In the process, banks conflated a reliance on market liquidity with their access to central bank liquidity.

Banks often sold securities to “arms-length” conduits that they were later forced to reintermediate or held onto AAA tranches of structures that proved far from risk-free.

Reliance on liquidity was not regulated by the Basel Committee on which the Bank of Canada has a vote. Forced reintermediation without adequate capital is a fault of the Basel Committee and the national regulators. AAA is an opinion – no more. Why did the Basel Committee interpret this opinion as “risk-free”?

In many banks, a culture that rewarded innovation and opacity over risk management and transparency eventually undermined its creators. Senior managers and shareholders of banks discovered that actual risks were much greater than originally thought. By that time, the more junior traders who had assumed the risks had already been paid, largely in cash. Many large, complex institutions learned too late that there can be principal-agent problems within firms, as well as between firms and their shareholders.

In other words, the Basel Committee failed to assess sufficient capital charges based on size and concentration.

The growth in financial activity and the increasingly complex array of financial players have prompted a dramatic increase in claims within the financial system, as opposed to between the financial system and the real economy, which created risks that were difficult to identify and evaluate.

And therefore ignored by the Basel Committee.

In essence, the shadow banking system practiced maturity transformation without a safety net – that is, it was wholly reliant on the continuous availability of funding markets. The collapse in market liquidity that began in August 2007 crystallized these risks.

The regulatory system neither appreciated the scale of this activity nor adequately adapted to the new risks created by it. The shadow banking system was not supported, regulated, or monitored in the same fashion as the banking system. With hindsight, the shift towards the shadow banking system that emerged in other countries was allowed to go too far for too long.

The problem is not the size of the shadow banking system per se, but that the banks were permitted to rely upon it and that the regulators ignored the risks.

Reopening markets will ultimately require a series of measures to improve the infrastructure of core funding markets, securitization, and credit default swaps (CDS).

A bare assertion, unsupported by anything in the speech.

The U.S. Federal Reserve has improved clearing and settlement arrangements, and has encouraged the move of CDS onto clearing houses. This will encourage the standardization of these products, while making CDS counterparties – often banks – less systemically important at the margin.

If I buy a bond on margin, I’ve got to put up about 10% and give it to the dealer as collateral. If I write a CDS, giving credit protection to a bank, I’m doing the same thing – but Mr. Carney’s Basel Committee decided this was a virtually risk-free banking transaction.

Third, the crisis has demonstrated that there are many firms that have been deemed systemic and worthy of rescue even though they were not deposit-taking banks.

Only because the exposure of the banking system to these firms was not adequately regulated.

Equities were crushed:

Canadian stocks had their biggest drop in four weeks as U.S. Treasury Secretary Timothy Geithner said banks will need more government help and oil’s retreat pushed energy producers lower.

Royal Bank of Canada, the country’s largest bank by assets, slid 3.2 percent to C$35.80. Toronto-Dominion fell 4.2 percent to C$42. Manulife lost 8.5 percent to C$13.72.

A measure of 38 financial stocks in the S&P/TSX index retreated 4.1 percent, the steepest decline among 10 industries.

Decent volume today amidst all the equity wreckage, with moderate price movement; PerpetualDiscounts down a bit, fixed-Resets up. If this relative movement makes sense to anybody, let me know, because I don’t understand it at all. Sure, you can always construct an argument that will explain anything; that is the bread and butter of the average stock broker: “Well, the market is assuming huge monetary and fiscal stimulus will cause rampant inflation without an increase in credit risk”; but it’s not all that convincing, really.

HIMIPref™ Preferred Indices
These values reflect the December 2008 revision of the HIMIPref™ Indices

Values are provisional and are finalized monthly
Index Mean
Current
Yield
(at bid)
Median
YTW
Median
Average
Trading
Value
Median
Mod Dur
(YTW)
Issues Day’s Perf. Index Value
Ratchet 0.00 % 0.00 % 0 0.00 0 -0.5212 % 863.0
FixedFloater 0.00 % 0.00 % 0 0.00 0 -0.5212 % 1,395.7
Floater 4.58 % 5.52 % 63,920 14.63 3 -0.5212 % 1,078.2
OpRet 5.25 % 4.77 % 128,892 3.87 15 -0.1349 % 2,065.3
SplitShare 6.95 % 10.00 % 49,241 4.78 6 -3.3045 % 1,600.6
Interest-Bearing 6.19 % 10.07 % 33,235 0.73 1 -0.4111 % 1,925.6
Perpetual-Premium 0.00 % 0.00 % 0 0.00 0 -0.2514 % 1,500.8
Perpetual-Discount 7.23 % 7.43 % 154,721 12.07 71 -0.2514 % 1,382.2
FixedReset 6.13 % 5.87 % 577,701 13.66 32 0.3592 % 1,816.8
Performance Highlights
Issue Index Change Notes
LFE.PR.A SplitShare -7.78 % Crushed, but the day’s low was set by small trades in the mid-afternoon. Traded 6,500 shares in a range of 6.57-05 before closing at 6.64-99, 2×1. Asset coverage of 1.0+:1 as of March 13, according to the company.
YTW SCENARIO
Maturity Type : Hard Maturity
Maturity Date : 2012-12-01
Maturity Price : 10.00
Evaluated at bid price : 6.64
Bid-YTW : 18.36 %
MFC.PR.B Perpetual-Discount -4.38 % YTW SCENARIO
Maturity Type : Limit Maturity
Maturity Date : 2039-03-30
Maturity Price : 15.05
Evaluated at bid price : 15.05
Bid-YTW : 7.82 %
BNA.PR.A SplitShare -4.21 % Asset coverage of 1.7-:1 as of February 28 according to the company.
YTW SCENARIO
Maturity Type : Hard Maturity
Maturity Date : 2010-09-30
Maturity Price : 25.00
Evaluated at bid price : 22.75
Bid-YTW : 13.45 %
DFN.PR.A SplitShare -4.07 % Asset coverage of 1.5+:1 as of March 13 according to the company.
YTW SCENARIO
Maturity Type : Hard Maturity
Maturity Date : 2014-12-01
Maturity Price : 10.00
Evaluated at bid price : 8.01
Bid-YTW : 10.00 %
RY.PR.W Perpetual-Discount -3.23 % YTW SCENARIO
Maturity Type : Limit Maturity
Maturity Date : 2039-03-30
Maturity Price : 18.30
Evaluated at bid price : 18.30
Bid-YTW : 6.81 %
CIU.PR.A Perpetual-Discount -3.13 % YTW SCENARIO
Maturity Type : Limit Maturity
Maturity Date : 2039-03-30
Maturity Price : 17.00
Evaluated at bid price : 17.00
Bid-YTW : 6.86 %
MFC.PR.C Perpetual-Discount -2.66 % YTW SCENARIO
Maturity Type : Limit Maturity
Maturity Date : 2039-03-30
Maturity Price : 14.62
Evaluated at bid price : 14.62
Bid-YTW : 7.79 %
HSB.PR.D Perpetual-Discount -2.35 % YTW SCENARIO
Maturity Type : Limit Maturity
Maturity Date : 2039-03-30
Maturity Price : 16.21
Evaluated at bid price : 16.21
Bid-YTW : 7.78 %
GWO.PR.H Perpetual-Discount -2.22 % YTW SCENARIO
Maturity Type : Limit Maturity
Maturity Date : 2039-03-30
Maturity Price : 15.84
Evaluated at bid price : 15.84
Bid-YTW : 7.72 %
SBN.PR.A SplitShare -1.96 % Asset coverage of 1.6+:1 as of March 19 according to Mulvihill.
YTW SCENARIO
Maturity Type : Hard Maturity
Maturity Date : 2014-12-01
Maturity Price : 10.00
Evaluated at bid price : 8.49
Bid-YTW : 8.77 %
BAM.PR.J OpRet -1.96 % YTW SCENARIO
Maturity Type : Soft Maturity
Maturity Date : 2018-03-30
Maturity Price : 25.00
Evaluated at bid price : 17.50
Bid-YTW : 10.75 %
BAM.PR.K Floater -1.84 % YTW SCENARIO
Maturity Type : Limit Maturity
Maturity Date : 2039-03-30
Maturity Price : 7.47
Evaluated at bid price : 7.47
Bid-YTW : 5.88 %
BAM.PR.H OpRet -1.70 % YTW SCENARIO
Maturity Type : Soft Maturity
Maturity Date : 2012-03-30
Maturity Price : 25.00
Evaluated at bid price : 23.10
Bid-YTW : 8.73 %
BNA.PR.C SplitShare -1.52 % Asset coverage of 1.7-:1 as of February 28 according to the company.
YTW SCENARIO
Maturity Type : Hard Maturity
Maturity Date : 2019-01-10
Maturity Price : 25.00
Evaluated at bid price : 11.00
Bid-YTW : 16.01 %
CM.PR.P Perpetual-Discount -1.40 % YTW SCENARIO
Maturity Type : Limit Maturity
Maturity Date : 2039-03-30
Maturity Price : 18.31
Evaluated at bid price : 18.31
Bid-YTW : 7.53 %
BNS.PR.O Perpetual-Discount -1.38 % YTW SCENARIO
Maturity Type : Limit Maturity
Maturity Date : 2039-03-30
Maturity Price : 20.66
Evaluated at bid price : 20.66
Bid-YTW : 6.92 %
BNS.PR.N Perpetual-Discount -1.35 % YTW SCENARIO
Maturity Type : Limit Maturity
Maturity Date : 2039-03-30
Maturity Price : 19.06
Evaluated at bid price : 19.06
Bid-YTW : 7.04 %
NA.PR.K Perpetual-Discount -1.30 % YTW SCENARIO
Maturity Type : Limit Maturity
Maturity Date : 2039-03-30
Maturity Price : 20.50
Evaluated at bid price : 20.50
Bid-YTW : 7.27 %
BAM.PR.I OpRet -1.16 % YTW SCENARIO
Maturity Type : Soft Maturity
Maturity Date : 2013-12-30
Maturity Price : 25.00
Evaluated at bid price : 21.30
Bid-YTW : 9.50 %
TD.PR.P Perpetual-Discount -1.15 % YTW SCENARIO
Maturity Type : Limit Maturity
Maturity Date : 2039-03-30
Maturity Price : 19.77
Evaluated at bid price : 19.77
Bid-YTW : 6.78 %
BAM.PR.O OpRet -1.14 % YTW SCENARIO
Maturity Type : Option Certainty
Maturity Date : 2013-06-30
Maturity Price : 25.00
Evaluated at bid price : 21.75
Bid-YTW : 8.78 %
W.PR.J Perpetual-Discount 1.05 % YTW SCENARIO
Maturity Type : Limit Maturity
Maturity Date : 2039-03-30
Maturity Price : 19.86
Evaluated at bid price : 19.86
Bid-YTW : 7.09 %
SLF.PR.B Perpetual-Discount 1.12 % YTW SCENARIO
Maturity Type : Limit Maturity
Maturity Date : 2039-03-30
Maturity Price : 15.40
Evaluated at bid price : 15.40
Bid-YTW : 7.86 %
GWO.PR.G Perpetual-Discount 1.29 % YTW SCENARIO
Maturity Type : Limit Maturity
Maturity Date : 2039-03-30
Maturity Price : 17.25
Evaluated at bid price : 17.25
Bid-YTW : 7.60 %
PWF.PR.H Perpetual-Discount 1.30 % YTW SCENARIO
Maturity Type : Limit Maturity
Maturity Date : 2039-03-30
Maturity Price : 17.96
Evaluated at bid price : 17.96
Bid-YTW : 8.20 %
SLF.PR.C Perpetual-Discount 1.39 % YTW SCENARIO
Maturity Type : Limit Maturity
Maturity Date : 2039-03-30
Maturity Price : 14.55
Evaluated at bid price : 14.55
Bid-YTW : 7.72 %
BNS.PR.R FixedReset 1.50 % YTW SCENARIO
Maturity Type : Limit Maturity
Maturity Date : 2039-03-30
Maturity Price : 21.36
Evaluated at bid price : 21.65
Bid-YTW : 4.62 %
RY.PR.R FixedReset 1.54 % YTW SCENARIO
Maturity Type : Call
Maturity Date : 2014-03-26
Maturity Price : 25.00
Evaluated at bid price : 25.75
Bid-YTW : 5.82 %
TD.PR.C FixedReset 1.60 % YTW SCENARIO
Maturity Type : Limit Maturity
Maturity Date : 2039-03-30
Maturity Price : 24.16
Evaluated at bid price : 24.20
Bid-YTW : 4.99 %
PWF.PR.E Perpetual-Discount 1.72 % YTW SCENARIO
Maturity Type : Limit Maturity
Maturity Date : 2039-03-30
Maturity Price : 18.31
Evaluated at bid price : 18.31
Bid-YTW : 7.68 %
IAG.PR.C FixedReset 1.85 % YTW SCENARIO
Maturity Type : Limit Maturity
Maturity Date : 2039-03-30
Maturity Price : 21.96
Evaluated at bid price : 22.00
Bid-YTW : 6.18 %
ACO.PR.A OpRet 1.92 % YTW SCENARIO
Maturity Type : Call
Maturity Date : 2009-04-29
Maturity Price : 26.00
Evaluated at bid price : 26.55
Bid-YTW : -14.14 %
CM.PR.K FixedReset 1.95 % YTW SCENARIO
Maturity Type : Limit Maturity
Maturity Date : 2039-03-30
Maturity Price : 21.96
Evaluated at bid price : 22.00
Bid-YTW : 4.90 %
PWF.PR.K Perpetual-Discount 3.90 % YTW SCENARIO
Maturity Type : Limit Maturity
Maturity Date : 2039-03-30
Maturity Price : 16.00
Evaluated at bid price : 16.00
Bid-YTW : 7.92 %
Volume Highlights
Issue Index Shares
Traded
Notes
BNS.PR.X FixedReset 61,652 RBC crossed 54,300 at 25.40.
YTW SCENARIO
Maturity Type : Call
Maturity Date : 2014-05-25
Maturity Price : 25.00
Evaluated at bid price : 25.40
Bid-YTW : 6.16 %
BMO.PR.O FixedReset 60,374 Recent new issue.
YTW SCENARIO
Maturity Type : Limit Maturity
Maturity Date : 2039-03-30
Maturity Price : 24.95
Evaluated at bid price : 25.00
Bid-YTW : 6.41 %
TD.PR.M OpRet 54,100 Desjardins bought blocks of 20,000 and 30,000 shares from National, both at 25.87.
YTW SCENARIO
Maturity Type : Soft Maturity
Maturity Date : 2013-10-30
Maturity Price : 25.00
Evaluated at bid price : 25.77
Bid-YTW : 4.16 %
PWF.PR.K Perpetual-Discount 51,190 YTW SCENARIO
Maturity Type : Limit Maturity
Maturity Date : 2039-03-30
Maturity Price : 16.00
Evaluated at bid price : 16.00
Bid-YTW : 7.92 %
RY.PR.R FixedReset 50,343 YTW SCENARIO
Maturity Type : Call
Maturity Date : 2014-03-26
Maturity Price : 25.00
Evaluated at bid price : 25.75
Bid-YTW : 5.82 %
CM.PR.H Perpetual-Discount 43,948 YTW SCENARIO
Maturity Type : Limit Maturity
Maturity Date : 2039-03-30
Maturity Price : 16.07
Evaluated at bid price : 16.07
Bid-YTW : 7.48 %
There were 27 other index-included issues trading in excess of 10,000 shares.

Seminar, April 30: Floating Rate Issues

Sunday, March 29th, 2009

Update, 2009-8-25: To gain access to the on-line video of this seminar and the ancillary written material, please visit PrefLetter.com

I am pleased to announce the next seminar in the series on the theory and practice of preferred share investing.

These seminars will be aimed at active and potential preferred share investors who wish to review relative valuation techniques in preferred share analysis.

All seminars will be presented by James Hymas, who has written extensively on the subject of preferred share investment and has been referred to as a "top expert" on the subject.

Questions are encouraged throughout the seminars, as well as in informal discussion at the end of the session.

Each seminar is two hours in length; coffee and tea will be served. The cost of attendance is $100, but a discount of $50 will be given to participants who have an annual subscription to PrefLetter with at least one issue remaining at the time of the seminar.

All seminars will be video-recorded for future distribution.

Thursday, April 30

Floating Rate Issues: Theory & Practice

"Floating Rate Issues" are popular with investors who:

  • wish to obtain tax-advantaged income
  • want protection against future inflation

These issues are characterized by:

  • Issued by Operating companies
    • Extant issues are non-financial
  • Dividends are paid by reference to Canada Prime
  • An exchange option may exist to lock in a rate for five years on a given date
  • Issues are Perpetual

This seminar will review the theory of Floating Rate Preferred evaluation, including:

  • Credit Quality
  • Embedded calls
  • Exchange Options
  • The importance of ex-Dividend dates
  • Investment characteristics relative to
    • money market instruments
    • other perpetual instruments

Examples of relative valuation in current markets will be supplied and discussed. Note that Floating Rate issues include the HIMIPref™ Indices:

  • Ratchet
  • FixedFloater
  • Floater

. "FixedReset" issues will not be discussed as part of this seminar.

Attendence is limited; a reservation will avoid disappointment.

Location: Days Hotel & Conference Center, (at Carlton & College, downtown Toronto) Yorkville Room (see map).

Time: April 30, 2009, 6pm-8pm.

Reservations: Please visit the PrefLetter Seminar Page.

Update, 2009-8-24: The seminar and its ancillary material have been accredited for four hours of IDA Professional Development Continuing Education.

Update, 2009-8-24: ◦This program is eligible for four CE credit hours, as granted by CFA Institute. If you are a CFA Institute member, CE credit for your participation in this program will be automatically recorded in your CE Diary.


Watch the Details on Rate-Reset Preferreds

Saturday, March 28th, 2009

Barry Critchley of the Financial Post has been all over the map on Fixed-Resets:

… and now he is warning that “redeemable” is different from “retractible”:

If the prefs are not redeemed, in five years holders will be offered a choice of a new fixed-rate pref or an option to convert to a floating-rate pref. The rate will be set at the same spread as the original fixed-rate prefs. (Over time, the spread has widened to 450 basis points from 160 basis points.) The actual rate offered could be lower or higher than the original coupon.

Now, Len Ruggins, a former senior financing executive with BCE, has weighed in. He argues the terms are “greatly tilted in the issuer’s favour, primarily because of their option to periodically call the issue at their pleasure.”

Ruggins said he “would buy into these issues if they were non-call for financial advantage for at least 25 years. This, in my mind, would establish a level playing field between the issuer and the investor. I am not trying to cut off a source of capital for our Canadian banks. However, I don’t think they should take undue advantage of the financially unsophisticated retail investor.”

By and large, Mr. Critchley’s attitude towards the structure has become more cautionary as the terms of new issues have improved! I consider the recent spate of new issues to be somewhat rich compared to PerpetualDiscounts, but to a much smaller degree than they were a year ago. In fact, there is now enough overlap between the more expensive PerpetualDiscounts and the cheaper FixedResets that the fund I manage has taken some opportunistic positions in Fixed Resets, as disclosed in the portfolio composition review for January 2009.

It is interesting to compare this column with the column by Rob Carrick of the Globe and Mail, published on the same day.

Update, 2009-3-31: In light of the comments to this post by Assiduous Reader GAndreone, I thought it would be interesting to post the HIMIPref™ Option Calculation Box for BMO.PR.O as of 2009-3-30. Note that I do not claim that this represents a perfect and correct calculation of what the price of the option would be if it was separable from the preferred share; I will say, however, that the various parameters used as inputs … er … how shall I phrase this … seem to work pretty much OK when used as part of HIMIPref™’s valuation routine.

Update, 2009-3-31: There’s a great comment on the G&M story:

Bruce King from Canada writes: I think James Hymas is stuck with a lot of straight preferreds that have tanked and he’s hoping to drum up some demand in order to unload them on us. He’s probably salivating at the chance to generate enough cash to buy some of the new rate-reset preferreds.

Curses! Foiled!