A Bloomberg piece titled How to Lose $667 Million in Bond Trades Without Trying discusses why stupid and lazy portfolio managers underperform:
Bond investors can waste a lot of money and not even know it.
They lost about $667 million in the year ended March 31 by paying higher prices for corporate bonds that were available at lower prices elsewhere, according to September research by Larry Harris, a business professor at the University of Southern California.
In most of the deals the investors simply did not know that the lower prices existed because they rely on human traders to tell them the value of bonds at any given moment before they make a trade. (Not to mention the salaries they need to pay those brokers to work the phones to find out who holds what and who might want to sell.)
The author, Lisa Abramowicz, mentions regulatory efforts to destroy the corporate bond market:
So far, the Securities and Exchange Commission is only encouraging big bond firms to use electronic marketplaces more frequently so that investors have an easier way to see market prices in real time.
But if that doesn’t work, regulators may take more invasive measures to streamline the playing field and make it cheaper to do business in the $8 trillion market for U.S. company bonds.
Regardless of what the SEC might do, it makes sense for Wall Street banks to work together to find a more efficient way to trade bonds because it may be the best for their bottom lines.
All this is interesting in light of the pending crippling of the Canadian corporate bond market discussed last week. Ms. Abramowicz buttresses her views – and regulators are virtually certain to follow her – by referencing a recent paper by Lawrence Harris of the University of Southern California titled Transaction Costs, Trade Throughs, and Riskless Principal Trading in Corporate Bond Markets:
This study analyzes the costs of trading bonds using previously unexamined quotations data consolidated across several electronic bond trading venues. Much bond market trading is now electronic, but the benefits largely accrue to dealers because their customers often do not trade at the best available prices. The trade through rate is 43%; the riskless principal trade (RPT) rate is above 42%; and 41% of customer trade throughs appear to be RPTs. Average customer transaction costs are 85 bp for retail-size trades and 52 bp for larger trades. Estimated total transaction costs for the year ended March 2015 are above $26 billion, of which about $0.5 billion is due to trade-through value while markups on customer RPTs transfer $0.7M to dealers. Small changes in bond market structure could substantially improve bond market quality.
The problem, as is usual with this type of paper, lies in the assumption of the very first sentence of the introduction:
Brokers are supposed to obtain the best available prices for their clients.
In virtually all cases in the bond market, the dealer is acting as principal. It is not just his privilege, but his job to leave his counterparties naked, hungry and freezing. This fundamental misstatement of the facts of the transaction persists throughout the paper. Particularly disgusting is the claim:
Although this transaction might not strictly be a trade through (it would not be if the broker-dealer exhausts all the size at the quoted price), the broker-dealer clearly is front-running the customer order, though not necessarily illegally.
Front-running is a breach of trust and can occur only when the intermediary is an agent of the trade initiator, therefore having a fiduciary responsibility to the initiator. The concept does not apply to trades executed as principal.
Another problem is with his definition of “transaction costs”:
I estimate the cost of trading for the side that initiated the trade by first identifying that side, and then by comparing the trade price to the quote midpoint price.
This definition makes dealer markups appear worse than they actually are.
Markups and commissions both contribute to transaction costs. Markups are incorporated in the price whereas commissions are tacked onto the price. Both allow brokers to recover the costs of arranging trades, and presumably all other costs of providing trading services to their clients.
…
Markups differ from commissions because broker-dealers generally do not fully disclose markups to their clients.
They also differ from commissions in that commissions apply to agency trades while markups apply to principal trading.
Even when broker-dealers fully disclose the nature of their relationships with their clients—that they are acting as principle [sic] and not as agent—many clients may not recognize the distinction and its implications. The distinction can be difficult to recognize when the broker-dealer sometimes acts as broker and sometimes as dealer, a process commonly called dual trading.
If clients do not recognize the distinction then they should not be trading. Traders in the institutional market will almost always be professionals and will have passed numerous proficiency tests set by the regulators. If retail traders want to play with the big boys and trade individual bonds themselves, they should recognize that step one is learning the rules of the game.
I will admit to long-term confusion over this whole concept of “fairness” and “equal access” as used by the regulators and rabble-rousers. Why are these things considered important points when discussing market structure? Are hospitals required to make operating rooms fairly accessible to DIY brain surgeons?
In his literature review, he (not surprisingly) refers to a number of papers I have discussed on PrefBlog before:
Biais and Green (2007) show that exchange-listed bond trading was quite liquid in municipal bonds before the late 1920s and in corporate bonds before the mid-1940s, and that transaction costs then were lower than they are now. The proliferation of electronic bond trading systems has the potential to substantially lower bond transaction costs, presumably to levels lower than Biais and Green document given the well-known economic efficiencies associated with electronic trading. Harris (2015) provides a survey of these efficiencies.
Well, that’s an inflammatory paragraph, isn’t it? But I reviewed Biais and Green in the post Exchange Traded Bonds? (emphasis added):
The third possibility [for the collapse of the exchange market] is due to the interaction of groups with differing objectives in a heterogeneous market:
Different equilibria will vary in terms of their attractiveness for different categories of market participants. Intermediaries benefit when liquidity concentrates in venues where they earn rents, such as opaque and fragmented markets. For reasons we will show were quite evident to observers at the time, large institutional investors fare better than retail investors in a dealership market. This was especially true on the NYSE until 1975, because commissions were regulated by the Constitution of the Exchange, while intermediary compensation was fully negotiable on the OTC market. We find that liquidity migrated from the exchange to the OTC market at times when institutional investors and dealers became more important relative to retail investors. As institutions and dealers became more prevalent in bond trading, they tipped the balance in favor of the over-the-counter markets.
Unlike many writers on this topic, Biais and Green show some understanding of the competing interests that determine market microstructure:
More Biais & Green:
Furthermore, the professionalized management and relatively frequent presence in the market of institutions makes transparency less important to them than to less sophisticated small investors who trade infrequently. The repeated interaction that dealers and institutions have with each other renders them less vulnerable to the opportunities which a lack of transparency affords other participants to profit at their expense on a one-time basis. Smaller institutions and individuals, for the opposite reasons, will tend to fare better in an exchange-based trading regime. Indeed, the theoretical model of Bernhardt et al (2005) shows that, in a dealer market, large institutions will trade more frequently and in larger amounts than retail investors, and incur lower transactions costs.(footnote)
Footnote: Bernhardt et al (2005) also offer an interesting empirical illustration of these effects in the case of the London Stock Exchange.
…there was a dramatic increase in institutional ownership in corporate bonds between 1940 and 1960. In the 1940s the weight and importance of institutional investors in the bond market grew tremendously. These investors came to amount for the majority of the trading activity in the bond market. Naturally, they chose to direct their trades to the OTC market, where they could effectively exploit their bargaining power, without being hindered by reporting and price priority constraints, and where they could avoid the regulated commissions which prevailed on the Exchange. Thus, the liquidity of the corporate bond market migrated to the dealer market.
Having cited Biais and Green, we may assume that Dr. Harris is familiar with these details, but he has chosen to ignore them in his efforts to increase market regulation.
One important point that goes against the thrust of the paper is the fact that:
The quotes used in this study are not generally available to the public, though they are available to IB’s customers in real-time.
…
Zitzewitz (2010) identifies RPTs, which he calls “trade pairing,” in the TRACE data using similar methods to those presented in this study. He finds that RPTs are very common (46% of trades under $100,000) and that they are mostly small trades. These results are similar to those obtained in this study.
…
Interactive Brokers serves as an agency-only broker for its clients. To facilitate their bond trades, IB collects pre-trade quotes and indications from several electronic trading platforms that offer automated execution services. These bond market centers include BondDesk, BONDLARGE, Knight BondPoint, NYSE Arca Bonds, and Tradeweb, and a few other centers that specialize only in municipal bonds or treasuries.13 None of these platforms provides universal coverage of all bonds that trade in the U.S. corporate bond markets. IB presents the quoted prices and sizes to its customers in real-time just as it and other brokers do for stocks, options, and futures.
…
IB reported to me that during the week ended September 10, 2015, they obtained complete fills for about 83% of its customers’ marketable orders and that they did not receive any cancellations after filling. This statistic indicates that a substantial fraction of the quoted and indicated prices that IB records are actionable.
The fact that all these quotes are available to anybody who signs up with Interactive Brokers shows that no regulatory changes are necessary. Anybody who wants to access these electronic quotes can do so. I see no problem here.
Dr. Harris does acknowledge the differing sizes of the retail and institutional trades:
Practitioners and academics often label trades with par values of $100,000 or less as retail-size trades, and larger trades as institutional-size trades. Many trades are relatively small retail-size trades. During the Primary Period, 67.3% of the trades in the full sample are retail-size trades (Table 9). Retail-size trades represent a slightly larger fraction (69.7%) in the subset sample. The median par value size of the retail-size trades is $18,000 in both samples.
The median trade size for institutional-size trades is $500,000 in both samples. The percentages of trades reported with indicators for par value sizes of $1,000,000 (speculative grade bonds) and $5,000,000 (investment grade bonds) or more are 4.6% and 1.3% in the full sample and about the same in the subset sample. Assuming that the actual size of these trades is equal to their minimum possible sizes of $1,000,000 and $5,000,000, the truncated mean par value trade size for all institutional-size trades is $908K and $953K in the two samples.
…
Among trades of a given size class, interdealer trades represent the smallest percentage of the largest class—those trades marked 5MM+ (13.1%). Many of these large trades probably are agency trades in which broker-dealers, acting as brokers, intermediate trades between customer buyers and sellers. In contrast, interdealer trades account for 40.8% of retail-size trades. The results in Section 7 show that many of these trades are riskless principal trades.
Of particular interest is the discussion of Table 19:
Most (82.3%) of the customer trade throughs are retail-size trades (Table 19). The mean price improvement for these trades is -93 bp, nearly a 1% markup. These markups seem quite large for relatively easy-to-arrange trades that can be arranged electronically. The total trade-through value for the retail trades is $74M. The mean price dis-improvement is smaller for institutional trades that traded through. Although these institutional trades are much larger, the total trade-through value is relatively small because these trades outsize the quotes. The average ratio of quote size to trade size is only 1.2% for institutional size trades in comparison to 28% for retail-size trades.
….
Standing quote to trade size ratio is the ratio of the opposing side quote size to the trade size.
So if I’m reading this correctly, the average size of a “trade-through” trade is four times the size of the quote, even when we restrict the sampling to retail sized trades (which average $18M, remember!). So these are itsy-bitsy little quotes and the “markups” calculated with respect to trade-through value would seem to be more of a market-impact cost than an extortionate dealer mark-up.
The number reported in the Bloomberg article comes from the introduction:
I find that average transaction costs that customers incur when trading range between 84.5 bp for retail size trades (under $100,000 in par value) and 52.1 bp for larger trades. These costs are several times larger than costs for similar size trades in equity markets. Trades occurring in markets with two-sided quotes that have stood at least two seconds trade through 46.8% of those markets; 40.8% of these trade throughs appear to be riskless principal transactions—trades for which the dealer has no inventory risk exposure usually because the dealer simultaneously offsets a trade with a customer with an interdealer trade. RPT transactions account for more than 41.7% of all trades. Total transaction costs borne by customers in U.S. corporate bond markets for the year ended March 31, 2015 are at least $26B, of which about $0.5B is due to trade-through value. During this period, markups on customer RPTs transferred $667M to dealers.
OK, so now we get to the good part, which is Dr. Harris’ Section 10.1, Public Policy Recommendations:
Many reasons explain why transaction costs are higher in bond markets than in stock markets. The most common explanation is that so many different bond issues make matching buyers to sellers difficult. This explanation certainly is true for the inactively traded bonds, but many bonds trade as actively as do small- and some mid-cap stocks, and they would undoubtedly trade much more actively if transaction costs were lower. Customers would benefit if the 850 bonds that are quoted nearly continuously were traded in market structures more similar to equity markets than the current OTC markets.
The problem with this paragraph is that much of it has not been supported by prior argument. Which stocks trade about as actively as which bonds, and what is the bid-offer spread on these stocks? How much size is there in these markets? Let us turn briefly to a speech by SEC Commissioner Luis A. Aguilar titled The Need for Greater Secondary Market Liquidity for Small Businesses:
In addition, it’s been reported that venture exchanges—both here and abroad—have suffered from low liquidity and, at times, high volatility.[19] This means investors could lose a lot of money quickly, and could have trouble selling their shares in a downturn. The Commission should attempt to determine the underlying causes of these problems and how best to address them. In this regard, we may need to ask some difficult questions. For example, should venture exchanges be structured as dealer markets, rather than auction markets? Also, could venture exchanges enhance liquidity through batch auctions, rather than continuous trading? How can the Commission, consistent with the Exchange Act, encourage traders to execute transactions on venture exchanges, rather than in off-exchange venues?[20] And, finally, could larger ticker sizes enhance liquidity by encouraging market maker activity and fostering research coverage? In this regard, the Commission’s proposed tick size pilot program[21] may offer valuable insights on the role of tick sizes in ensuring an active secondary market for smaller companies.
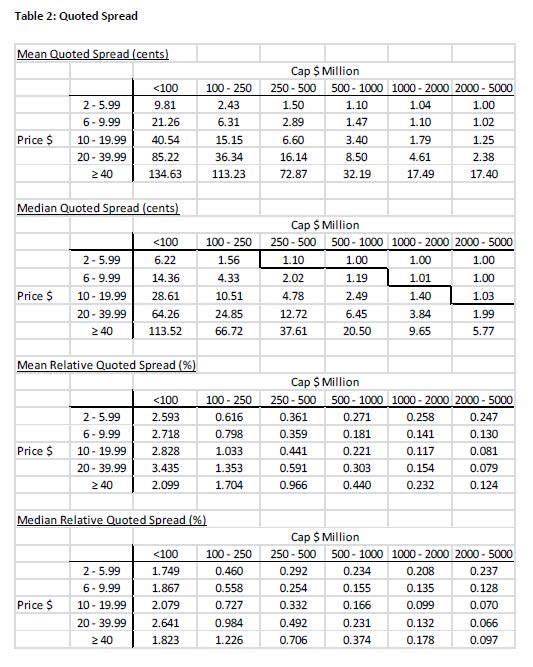
So for at least some of these smaller issues there are musings about possibly moving the other way – from exchange trading to a dealer market! We can also look at the fascinating Table 2 from the SEC’s report A characterization of market quality for small capitalization US equities:
 Click for Big
Given that most bond issues will be smaller than the largest equities on this table and that bonds trade less intensively than equities, it is clear that that a Dr. Harris needs to support his recommendation in considerably more detail than he has in this paper. As an aside, I think he needs to explain his tables a little better! I can’t figure out what 850 bonds he’s talking about in his Table 11! And when he’s talking about “size”, I don’t know if he’s talking about dollar value, multiples of 100, or multiples of 1000 … I suspect he means multiples of 100, but it’s certainly not very clear!
Another recommendation is:
The SEC also should consider enacting a trade through rule for bonds similar to that in Reg NMS (for equities) that would require that broker-dealers access electronically available orders when filling orders for their clients before trading through. The SEC may want to do so before a class-action lawsuit based on common law agency principles effectively imposes a Manning Rule for bonds similar to FINRA Rule 5320 (Prohibition Against Trading Ahead of Customer Orders) for equities
Well, I’m not going to pretend to know anything about the Manning Rule, or the chances that a class-action lawsuit might have! However, I will point out that while this might well apply to dealers acting as brokers, it does not apply to dealers acting as principal.
Dr. Harris suggests:
At the minimum, FINRA or the SEC should require that brokers disclose their markup rates on RPTs on a pre-trade basis as they do with their commission rates.34 Since the two rates are perfect substitutes for each other, investors would be less confused if one rate were simply set to zero. This brokerage pricing standard would ensure that brokers would compete on the same basis for order flow. Since customers understand commissions much better than they understand markups, simply banning markups on RPTs would be best. Such a ban would have no effect on competition because dealers could always raise their commissions to compensate for their lost markups. Their customers then would know the full cost of the intermediation services that they obtain from their brokers.
Readers who have gotten this far will know that I am going to object to the assertion that commissions and markups are equivalent – the former applies to brokerage and the latter to principals. I will also note that while full-service commissions are highly variable and considered top-secret, 1% for equity trades is a good place to start. The comparisons here appear to be with equity transactions via a discount brokerage, which is a different kettle of fish.
Update, 2015-9-27: I note from Rob Carrick’s fee project:
Two ways of paying for investing advice aren’t covered in depth by our calculator. One is the transactional model, where you pay commissions to trade securities. The investment industry consulting firm PriceMetrix says the average commission last year was 0.99 per cent of the cost of the trade.
Now back to Dr. Harris:
Finally, a rule that would require brokers to post limit orders of willing customers to venues (order display facilities) that widely disseminate these prices would help prevent many trade throughs. Many trade throughs undoubtedly happen simply because traders are unaware of better prices. Such a rule likely would substantially increase such offers of liquidity, especially if implemented in conjunction with a trade-through rule. These order display facilities could be existing exchanges and ATSs, or new ones formed for this purpose.
This follows from the idea that bond dealers act as brokers and the marketplace is an exchange.
If the SEC fails to take these actions, and if no class-action suit is successful, the markets will continue to improve as innovators such as IB continue to capture order flow by creating their own NBBOs. But it may be many years before most customers become sophisticated enough to demand these facilities from their brokers, if they ever do, and some brokers may never offer these facilities, either because their customers are not well enough informed or because their customers suffer various agency problems, including the problems associated with payments for order flow.
It’s the profitability of ‘innovators such as IB’ that makes the debate unnecessary. Let competition reign – particularly since for small investors the real competition is ETFs and funds.
With respect to trading, bonds are securities just like equities, only less risky. U.S. corporate and municipal bonds presently trade differently for historic reasons. They need not trade differently in the future. U.S. Treasury bonds and corporate bonds in several well developed countries trade in substantially more transparent markets that do corporate and municipal bonds in the U.S. presently do. The quality of these markets shows that opaque markets are not necessary for fixed income securities.
This paragraph is not supported by the text and ignores the work that has been done on market microstructure as it relates to market-depth and transparency.
Finally, note that the creation of more liquid markets will benefit issuers as well as customers. Investors are more willing to buy securities in the primary markets when they expect that they can sell them easily at low cost in the secondary markets. Low secondary trading costs thus imply higher bond IPO values, and lower corporate funding costs.
While it’s nice to see a nod to the interests of issuers, the evidence actually goes the other way. In the Bessembinder paper I reviewed in the post TRACE and Corporate Bond Market Transparency, it is shown that increased transparency caused a migration to less transparent “144a” structures, which are private placements:
One way to circumvent TRACE, which applies to publicly-issued bonds, is for a firm to issue privately placed bonds (sometimes referred to as Rule 144a securities, for the section of the Securities Act of 1933 that provides exemption from registration requirements). … In 2001, before TRACE, “144a for life” bonds were 7.3 percent of dollar volume and 9.6 percent of issues. The percentage of dollar volume in “144a for life” bonds jumped to 27.8 percent in 2003, the first full year after TRACE initiation, and grew to 39.8 percent in 2004, before declining to 16.9 percent in 2006.…
Also consistent with a shift towards alternative asset classes, the credit default swap market experienced phenomenal growth in recent years relative to bonds. Table 6 reports on outstanding notional principal in these credit default swaps, which grew from $919 billion in 2001 to $34.4 trillion in 2006. One dealer suggested to us that, prior to TRACE introduction, ten times as much capital was allocated to corporate bond trading than to credit default swaps, but that the ratio has now been reversed.
…
To the extent that the shift to privately placed bonds and bank loans was initiated by corporate borrowers, and in response to TRACE, it suggests that the net costs of TRACE may exceed the benefits….
All in all, it’s an interesting paper and a good reminder that corporate bond trades should ensure they have independent access to electronic marketplaces … but note that if a dealer is sitting on a stack of inventory he’s willing to sell at 102.00, then sees all the offers below 102.00 disappear, he’s probably going to raise his price! But the data needs to be presented with more explanation in the tables and the advocacy should be taken out and used elsewhere; in addition, more account needs to be taken of previous work on market microstructure and the interests of issuers which, I assert, must be paramount when contemplating changes to the system.