Malachite Aggressive Preferred Fund’s Net Asset Value per Unit as of the close May 29, 2026, was $10.9319.
Fund returns were adversely affected by PWF.PF.A (-1.54%), FFH.PR.K (+0.04% following last month’s underperformance) and SLF.PR.D (+1.09% following last month’s outperformance) but benefitted from good performance by IFC.PR.A (+4.00% following last month’s underperformance), ENB.PR.B (+5.09% following last month’s outperformance) and TRP.PR.B (+5.89%); small holdings are not considered for individual mention here.
So anyway, I want to tell you a war story but I have to introduce it first. There is one infallible way of telling whether a Portfolio Manager is a clown or not. If he’s a clown, he will try to persuade you that he’s good by telling you a war story … ‘We got our clients into Nvidia at $50 because we foresaw … blah-blah-blah’.
A good Portfolio Manager will eschew war stories since they don’t mean anything. A good PM will say something more like … ‘Here’s our historical composite performance, annualized on a rolling basis since we started. Don’t look at the one-year returns … we get into the first quartile more often than we should, but the first quartile is dominated by guys who bought a winning lottery ticket. Look at the five-year returns and run your finger down that column to check how consistent they are against the index with all the different annual end-dates. Ten-years is better, but there’s not as much data, of course …’
The first story is exciting and fits into the way Joe Lunchbucket thinks the market works. The second story is boring, which is why clowns dominate the industry.
So, that being said, I’m going to tell you a war story – not to try to prove I’m good, but to illustrate just how hopelessly inefficient the preferred share market is and just how extreme things can get at the margins.
Readers who indefatigably plough through these reports (and the ones in PrefLetter) will remember that I’ve been complaining basically every month for a long time about how BPO has been screwing up the regressions by performing so well (y axis) with a relatively consistent set of attributes (x axis) – BPO is having a long recovery from its near death (according to the market) experience a few year’s back (see the post BPO Downgraded to P-4 by S&P and ensuing discussion in the comments). Long term price charts (like here for example) are most entertaining.
So when the fund sold BPO.PR.A in May to buy BPO.PR.E, paying up about $0.95, I had a look to see how the BPO.PR.As got into inventory. It turns out I bought them in January … selling BPO.PR.E and taking out … about $2.90.
That’s wild. It’s not an unusual story for the fund, but usually with a much smaller difference between the relative prices!
FixedResets are now yielding more than PerpetualDiscounts due largely to the large increase in the GOC-5 yield used to estimate future reset rates; on May 29, I reported median YTWs of 5.77% and 5.68%, respectively, for these two indices; compare with mean Current Yields of 5.60% and 5.61%, respectively.
| Returns to May 29, 2026 |
| Period |
MAPF |
TXPR*
Total Return |
CPD – according to RBCGAM |
| One Month |
+1.84% |
+1.56% |
+1.5% |
| Three Months |
+3.68% |
+3.15% |
+3.0% |
| One Year |
+19.91% |
+16.11% |
+15.5% |
| Two Years (annualized) |
+17.99% |
+15.04% |
N/A |
| Three Years (annualized) |
+24.26% |
+17.42% |
+16.7% |
| Four Years (annualized) |
+11.89% |
+8.35% |
N/A |
| Five Years (annualized) |
+9.72% |
+6.44% |
+5.9% |
| Six Years (annualized) |
+18.34% |
+11.72% |
N/A |
| Seven Years (annualized) |
+12.43% |
+8.32% |
N/A |
| Eight Years (annualized) |
+8.13% |
+5.86% |
N/A |
| Nine Years (annualized) |
+8.98% |
+6.08% |
N/A |
| Ten Years (annualized) |
+10.24% |
+7.01% |
+6.5% |
| Eleven Years (annualized) |
+7.60% |
+5.14% |
|
| Twelve Years (annualized) |
+6.79% |
+4.42% |
|
| Thirteen Years (annualized) |
+6.46% |
+4.06% |
|
| Fourteen Years (annualized) |
+6.70% |
+4.17% |
|
| Fifteen Years (annualized) |
+6.20% |
+4.11% |
|
| Sixteen Years (annualized) |
+7.40% |
+4.72% |
|
| Seventeen Years (annualized) |
+8.11% |
+4.93% |
|
| Eighteen Years (annualized) |
+9.07% |
+4.33% |
|
| Nineteen Years (annualized) |
+8.73% |
|
|
| Twenty Years (annualized) |
+8.55% |
|
|
| Twenty-One Years (annualized) |
+8.39% |
|
|
| Twenty-Two Years (annualized) |
+8.47% |
|
|
| Twenty-Three Years (annualized) |
+9.00% |
|
|
| Twenty-Four Years (annualized) |
+8.89% |
|
|
| Twenty-Five Years (annualized) |
+9.18% |
|
|
| MAPF returns assume reinvestment of distributions, and are shown after expenses but before fees. |
| The BMO Capital Markets “50” Preferred Share Index is no longer being calculated. The final performance report incorporating this venerable index was published as of December, 2020. |
| “TXPR” is the S&P/TSX Preferred Share Index. It is calculated without accounting for fees, but does assume reinvestment of dividends. |
| CPD Returns are for the NAV and are after all fees and expenses. Reinvestment of dividends is assumed. |
| All fund and ETF returns shown below are after all fees and expenses |
| Figures for NBI Preferred Equity Income Fund, Series F [NBC780] (formerly Omega Preferred Equity) (which are after all fees and expenses) for 1-, 3- and 12-months are +1.41%, +2.39% and +16.64%, respectively, according to National Bank Investments after all fees & expenses. Three year performance is +18.91%; five year is +7.26%; ten year is +8.24%.
Figures from Morningstar are no longer conveniently available. |
| Manulife Preferred Income Class Adv has been terminated by Manulife. The performance of this fund was last reported here in March, 2018. |
Figures for Horizons GlobalX Active Preferred Share ETF (HPR) (which are after all fees and expenses) for 1-, 3- and 12-months are +1.68%, +3.37% & +18.60%, respectively. Three year performance is +19.90%, five-year is +7.62%, ten year is +7.85% |
| Figures for NBI Preferred Equity Fund Series F [NBC710] (formerly Altamira Preferred Equity Fund) are +1.67%, +3.39% and +18.20% for one-, three- and twelve months, respectively. Three year performance is +20.42%; five-year is +7.82%; ten-year is +8.10%
Acccording to the fund’s fact sheet as of June 30, 2016, the fund’s inception date was October 30, 2015. I do not know how they justify this nonsensical statement, but will assume that prior performance is being suppressed in some perfectly legal manner that somebody at National considers ethical.
The last time Altamira Preferred Equity Fund’s performance was reported here was April, 2014; performance under the National Bank banner was first reported here May, 2014. |
| The figures for the NAV of BMO Laddered Preferred Share Index ETF (ZPR) is +20.16% for the past twelve months. Two year performance is +17.40%, three year is +20.52%, five year is +8.09%, ten year is +8.20%
Note that analysis of ZPR shows some doubt as to whether this fund is either "laddered" or an "index fund". However, there was a remarkable improvement in the laddering in the six months following the publication of my analysis. |
| Figures for Fiera Canadian Preferred Share Class Cg Series F, (formerly Natixis Canadian Preferred Share Class Series F) (formerly NexGen Canadian Preferred Share Tax Managed Fund) are no longer available as the Fund is now the property of Canoe Financial. The last reported performance for the merged fund was May 2020. |
| Figures for BMO Preferred Share Fund (advisor series) are not available as the fund has been terminated. This is as per an announcement by the bank on 2024-5-28. The last performance report for this awful fund was as of July 31, 2024.
|
| Figures for PowerShares Canadian Preferred Share Index Class, Series F (PPS) are no longer available since the fund has been terminated. Performance was last reported for the fund to month-end, March 2023 |
| Figures for the First Asset Preferred Share Investment Trust (PSF.UN) are no longer available since the fund has merged with First Asset Preferred Share ETF (FPR).
Performance for the fund was last reported here in September, 2016; the first report of unavailability was in October, 2016. |
| Figures for Lysander-Slater Preferred Share Dividend Fund (Class F) according to the company are +1.1%, +1.4% and +10.4% for the past one, three and twelve months, respectively. Three year performance is +14.7%, five-year is +5.3%, ten-year is +6.0%. |
| Figures for the Desjardins Canadian Preferred Share Fund F Class (F Class), as reported by the company are +1.68%, +2.90% and +15.81% for the past one, three and twelve months, respectively. Two year performance is +14.78%, three-year is +17.28%, five-year is +6.37%, ten-year is +6.61% |
| Figures for the RBC Canadian Preferred Share ETF (RPF) are reported as +1.6%, +4.5% and +20.7% for the past one, three and twelve months, respectively. Three-year performance is +20.5%, five-year is +7.6% |
| Figures for the Dynamic Active Preferred Shares ETF (DXP) are +1.5%, +2.9% and +16.3% for the past one, three and twelve months, respectively. Three-year performance is +18.6%; five-year is +8.1% |
| Figures for the Purpose Canadian Preferred Share Fund (Class F) are +1.30%, +2.81% and +16.00% for the past one, three and twelve months, respectively. Three-year performance is +18.88%; four-year is +8.16%; five-year is +6.67%; seven-year is +9.82%; ten-year is +7.12%. |
| Figures for the TD Active Preferred Share ETF (TPRF) are +1.55%, +3.57% and +18.57% for the past one, three and twelve months, respectively. Two-year performance is +16.86%, three-year is +20.08%; five-year is +8.71%.
Note that “The TD ETF may also hold common shares, government and corporate bonds, and other income-producing securities. … The TD ETF may invest in foreign securities to an extent that will vary from time to time but is not typically expected to exceed 5% of its assets at the time that foreign securities are purchased.
The non-preferred share components of the portfolio are relatively minor – as of their year-end 2023 report, they had $1.6-million in Canadian Natural Resources Limited common, $1.8-million in RBC common, $1.6-million in SLF common, and $1.75-million in Fortis common, totalling $6.75-million in a $220-million portfolio.
I take the view that the purpose of this mandate is to destroy, or at least deprecate, comparability. Banks hate comparability. |
So at the time of initial writing (2026-05-03) none of the comparator funds have published returns to May month-end. I will, as usual, have to attempt to fill in the blanks prior to publishing the June PrefLetter. Remember, readers, if you want customer service, you have to go to a big firm like Hymas Investment Management Inc. – if you go to some tiny outfit like Royal Bank, you’ll find that they simply do not have the resources to publish returns promptly after each applicable month-end. They have published their prices, most of them: updating the performance numbers to reflect these data would be trivial programming work – if they cared to do it.
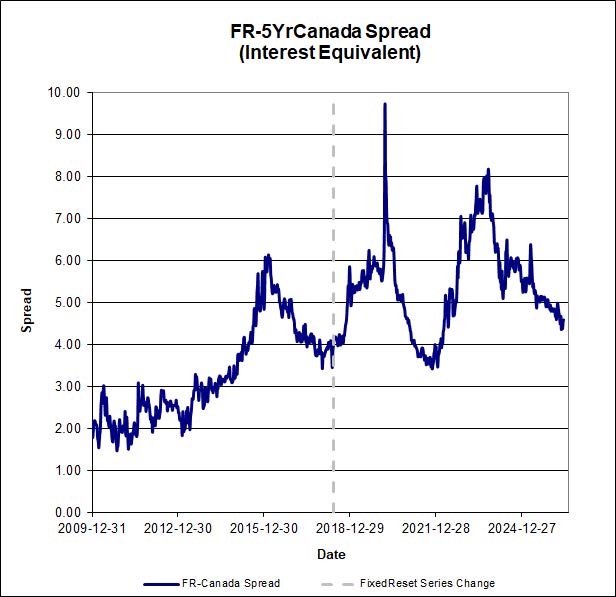
The five-year Canada yield was virtually unchanged over the month, with the five-year Canada yield (“GOC-5”) moving from 3.11% at April month-end to 3.12% at May month-end (not without some interesting variability along the way!) and 3-month bills unchanged at 2.30% over the month.
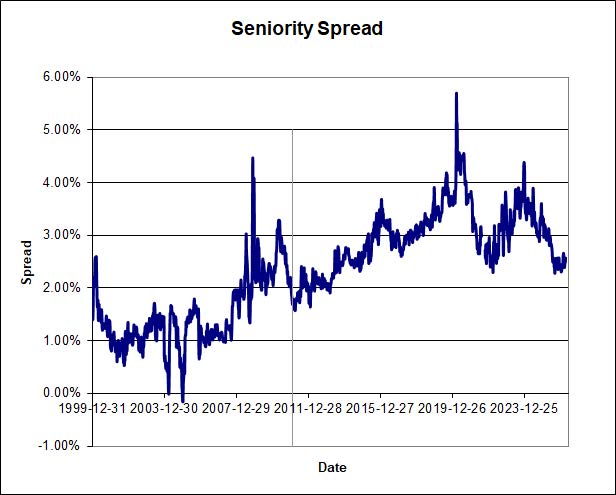
The Seniority Spread (between long-term corporate bonds and interest-equivalent PerpetualDiscounts) was 245bp on 2026-05-27, widening slightly (and perhaps spuriously) from 240bp on 2026-05-09 (chart end-date 2026-05-08)
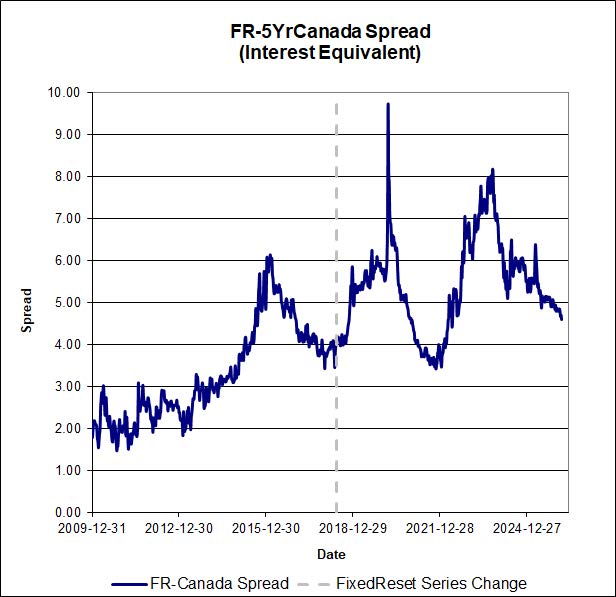
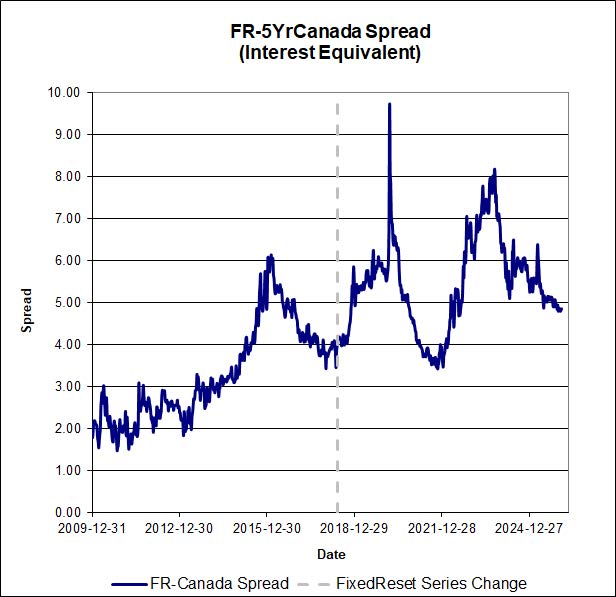
The situation with FixedResets is interesting, with the spread between GOC-5 and the interest-adjusted FixedReset (Discount) rate widening significantly (despite recent narrowing) from its 2021-11-10 low of 344bp to a level of 439bp (as of 2026-5-27)… (chart end-date 2026-05-08):
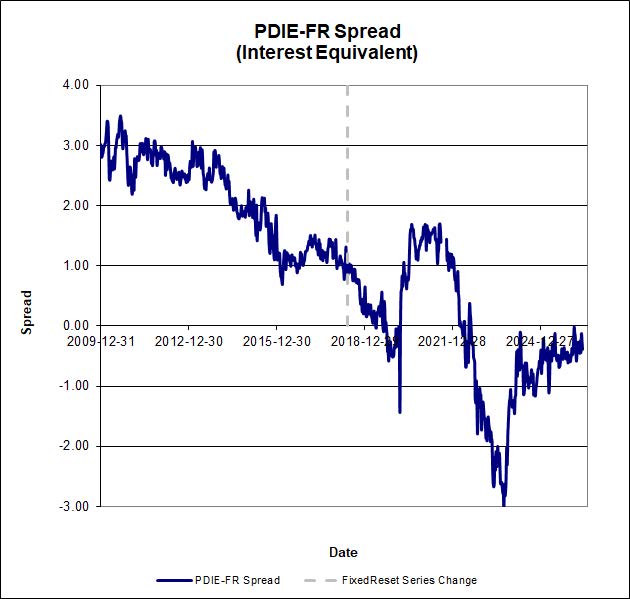
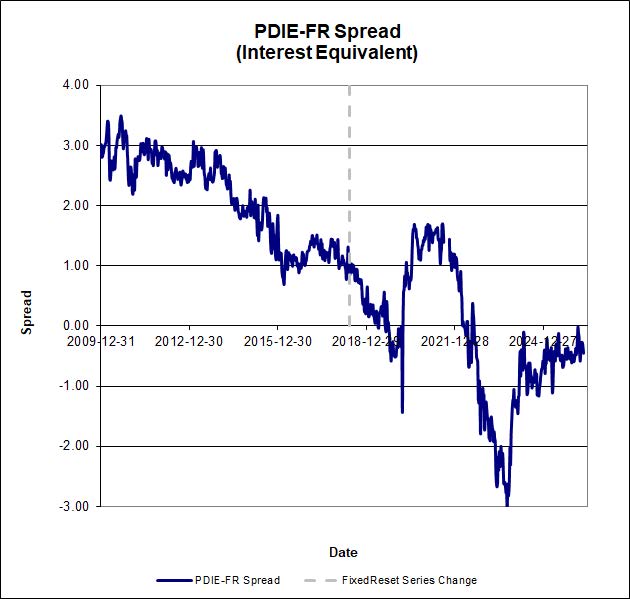
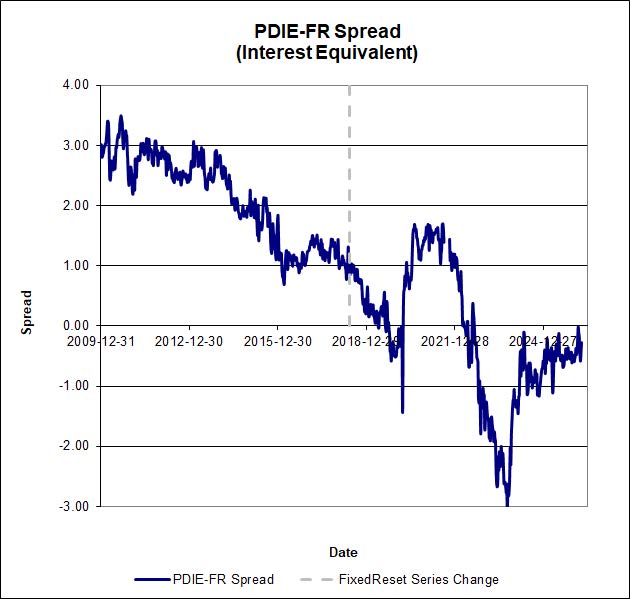
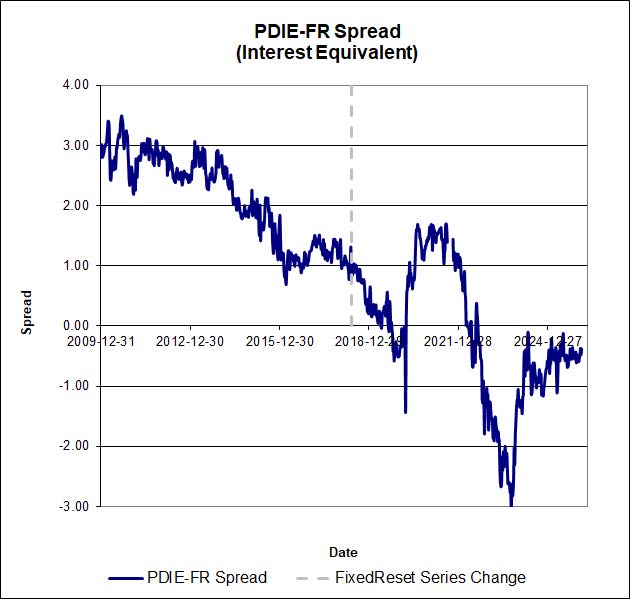
…while at the same time the interest-equivalent spread between FixedReset (Discounts) and PerpetualDiscounts has narrowed to -13bp (as of 2026-05-27) from its 2021-7-28 level of +170bp (chart end-date 2026-05-08):
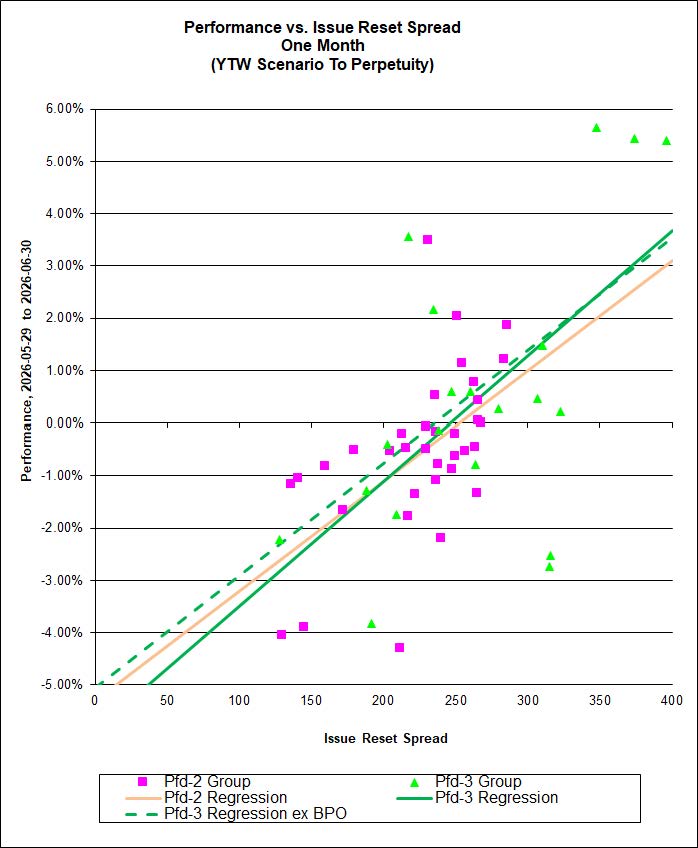
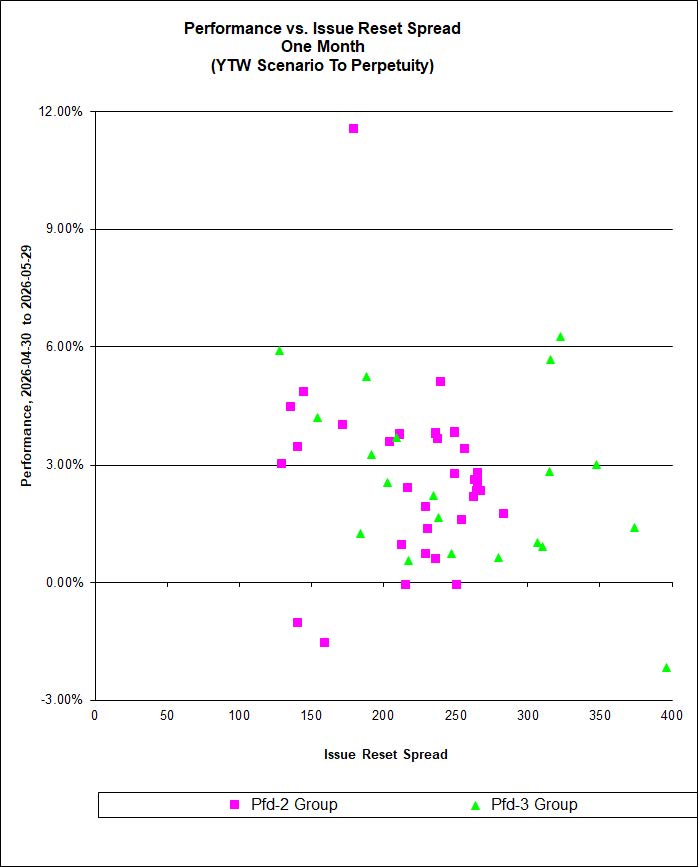
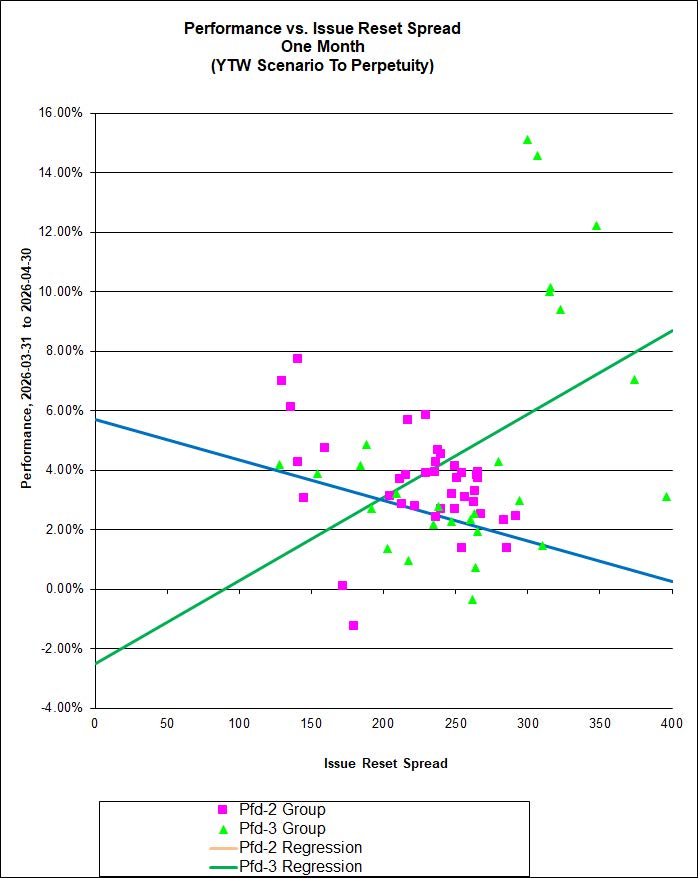
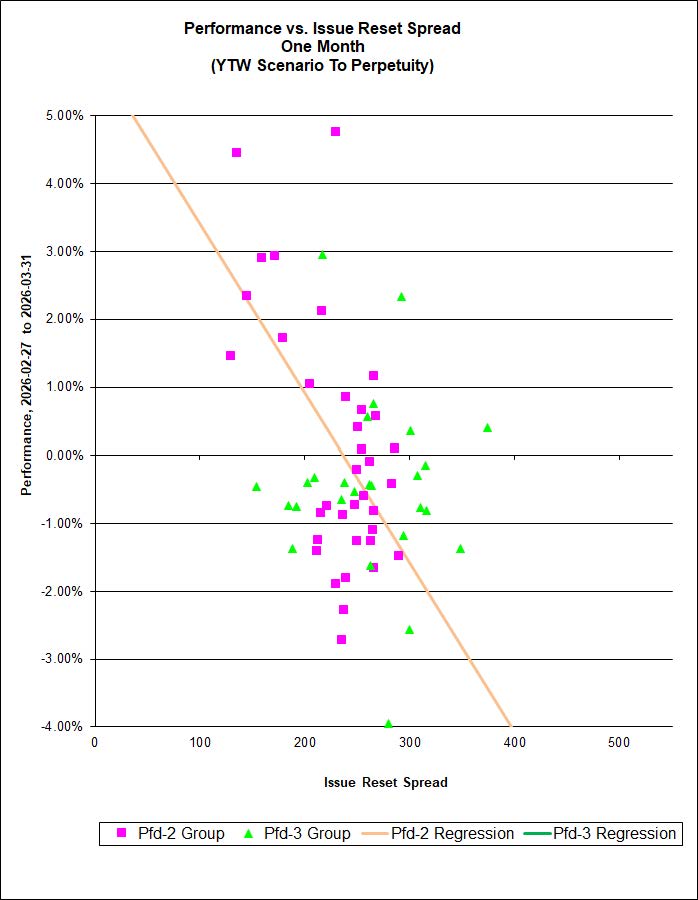
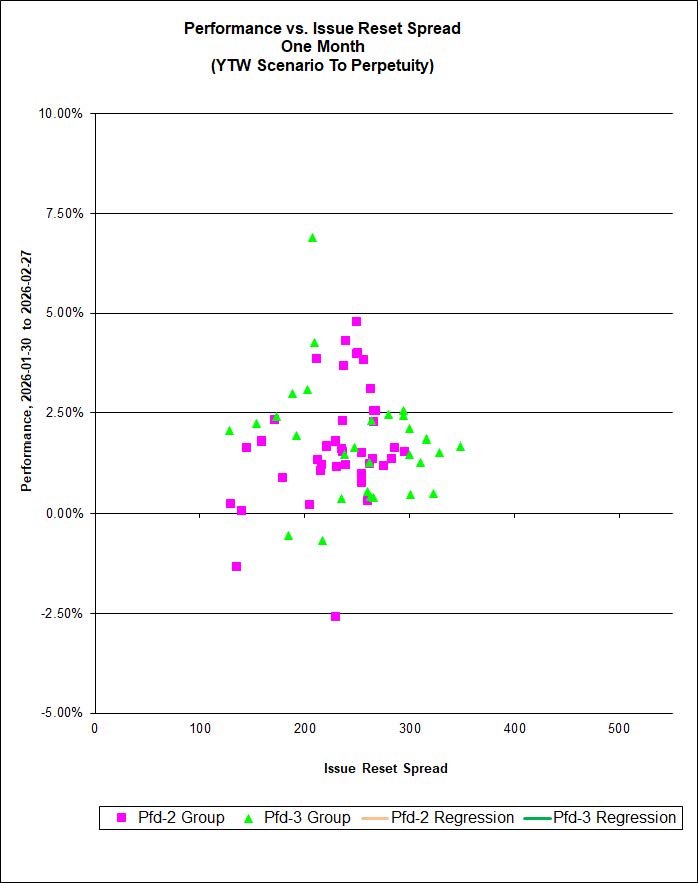
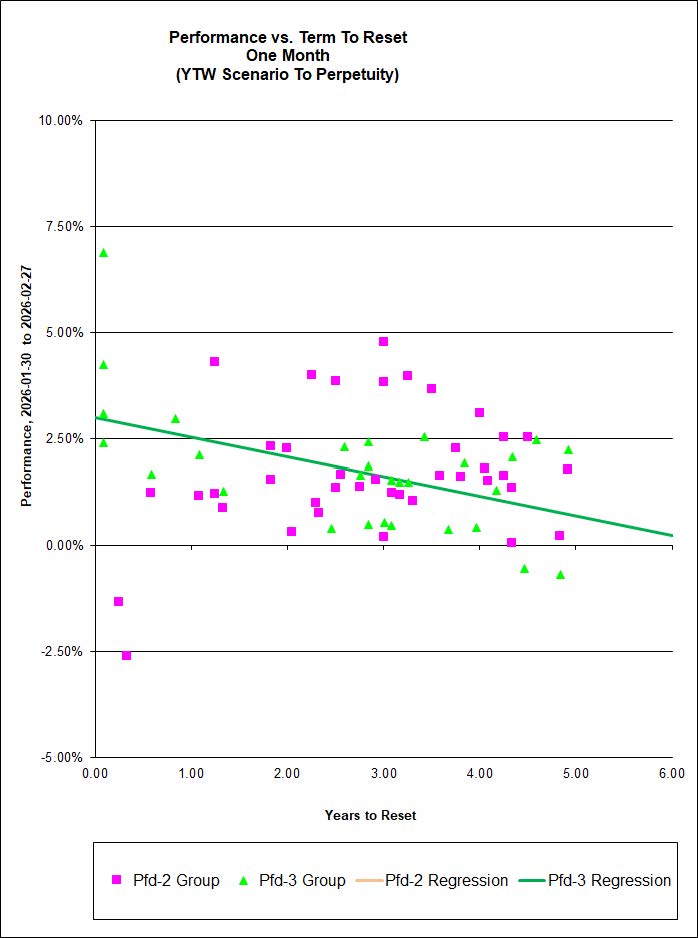
There is no correlation between the Issue Reset Spread and 1-month performance for discounted FixedResets for the Pfd-2 Group or for the Pfd-3 Group issues
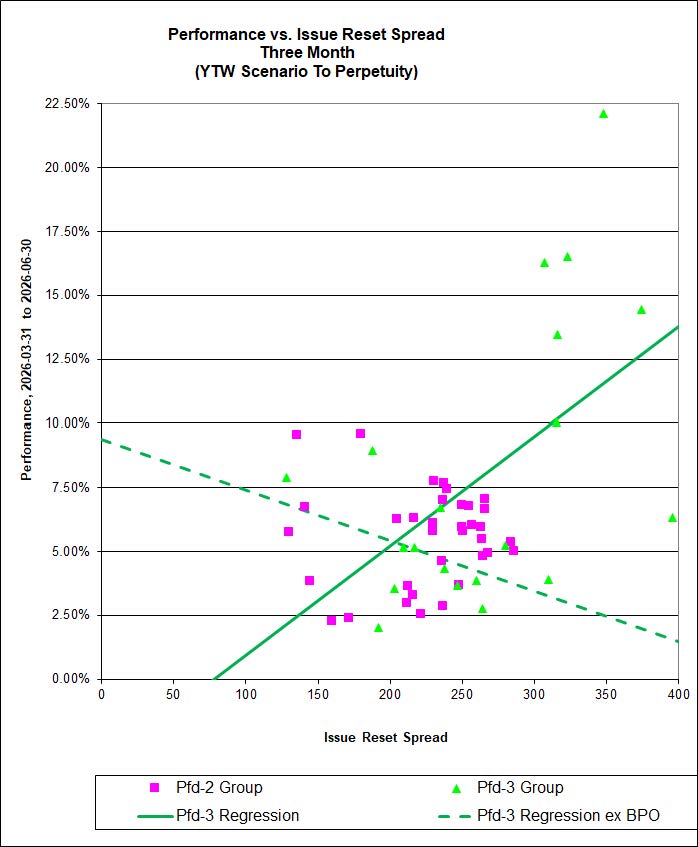
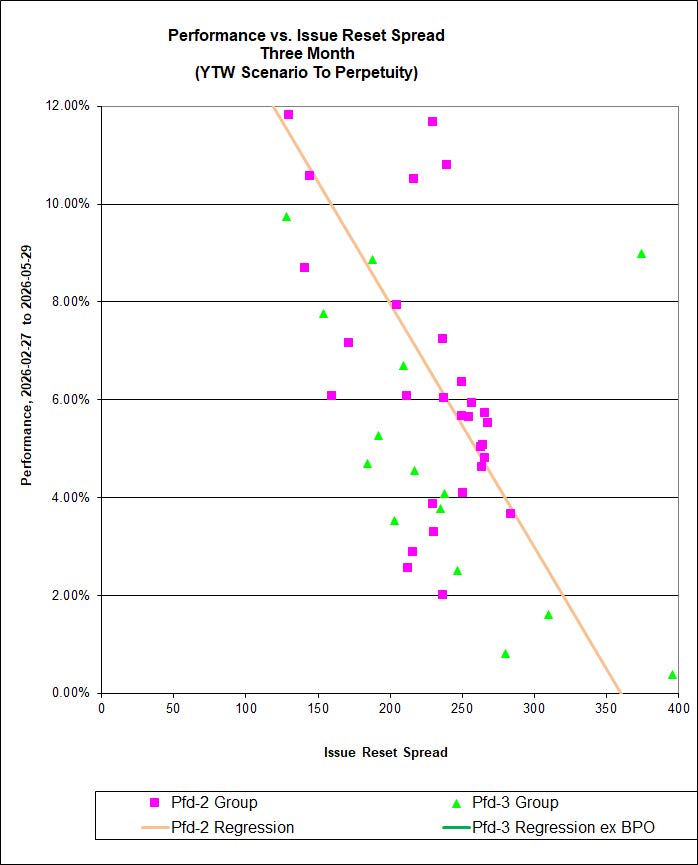
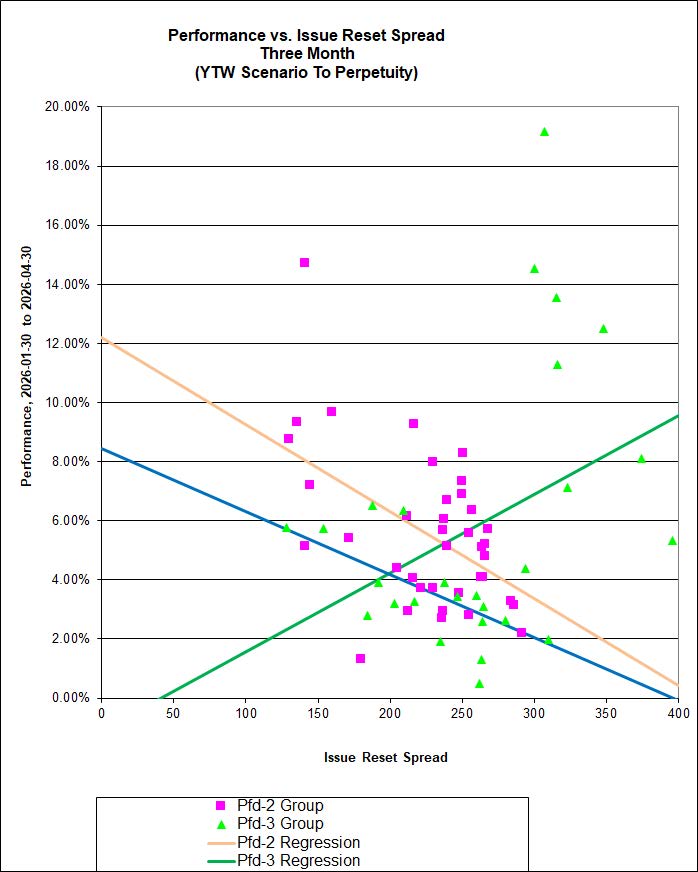
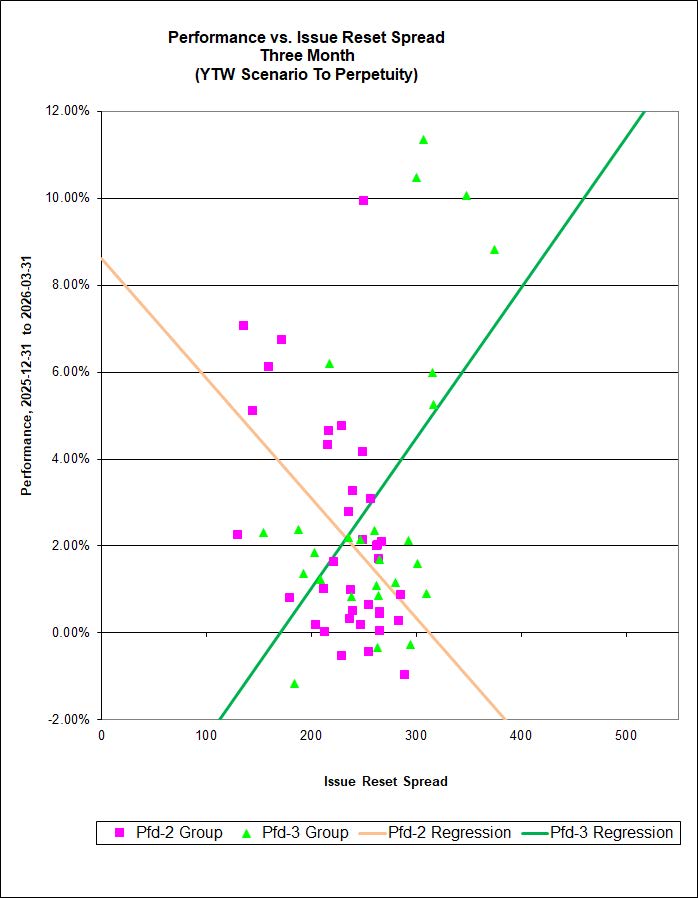
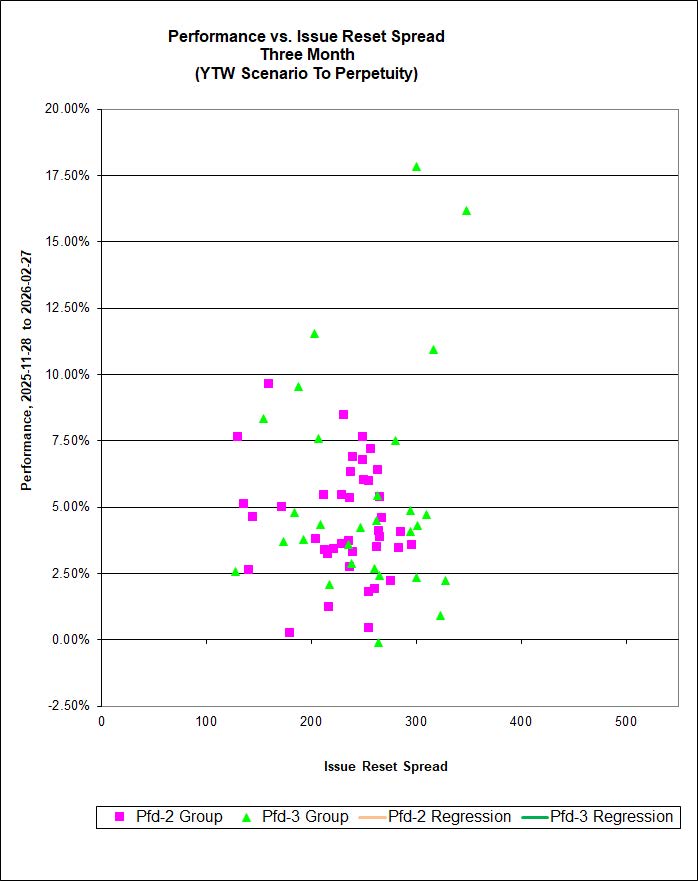
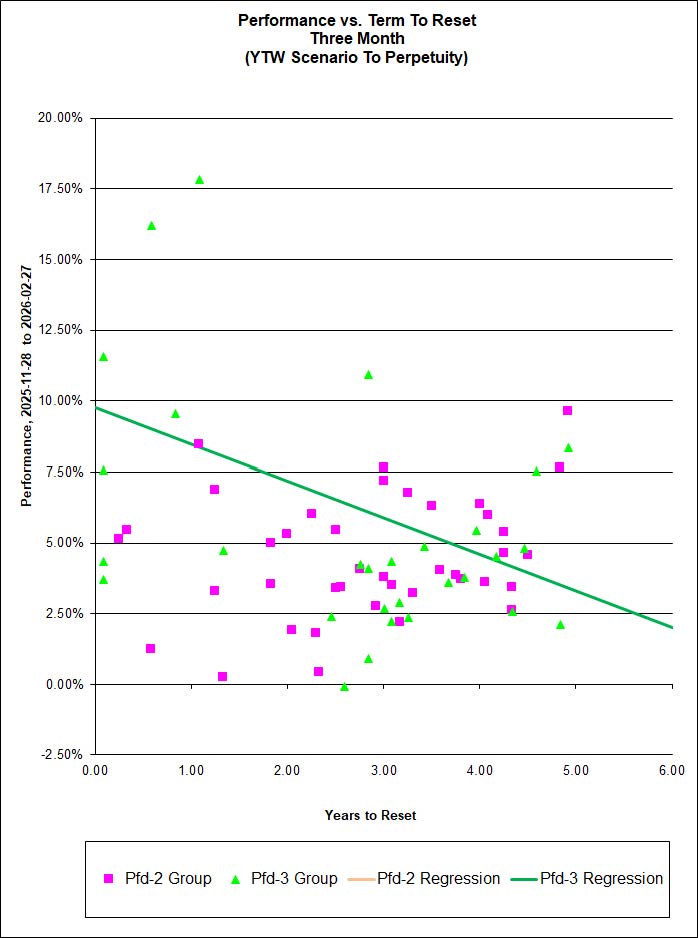
There is a correlation for the Pfd-2 group (42%) but none for the Pfd-3 group between the Issue Reset Spread and 3-month performance for discounted FixedResets
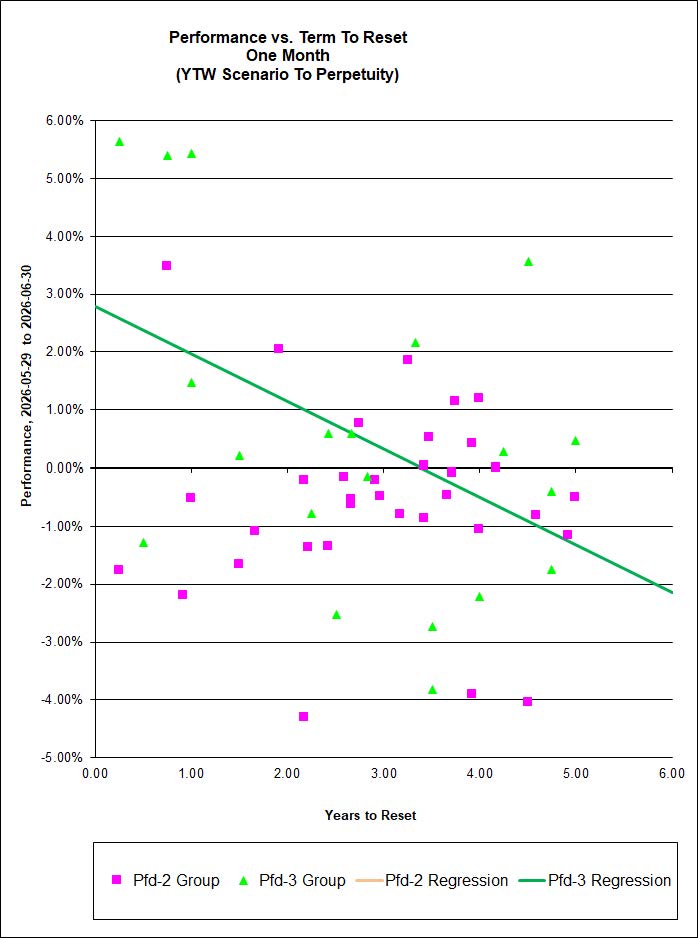
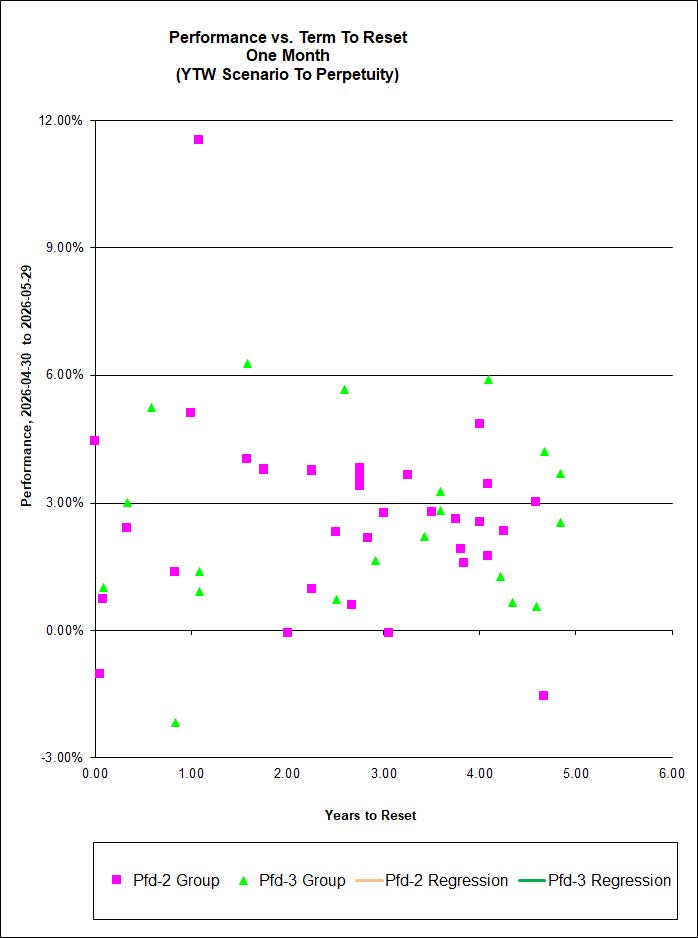
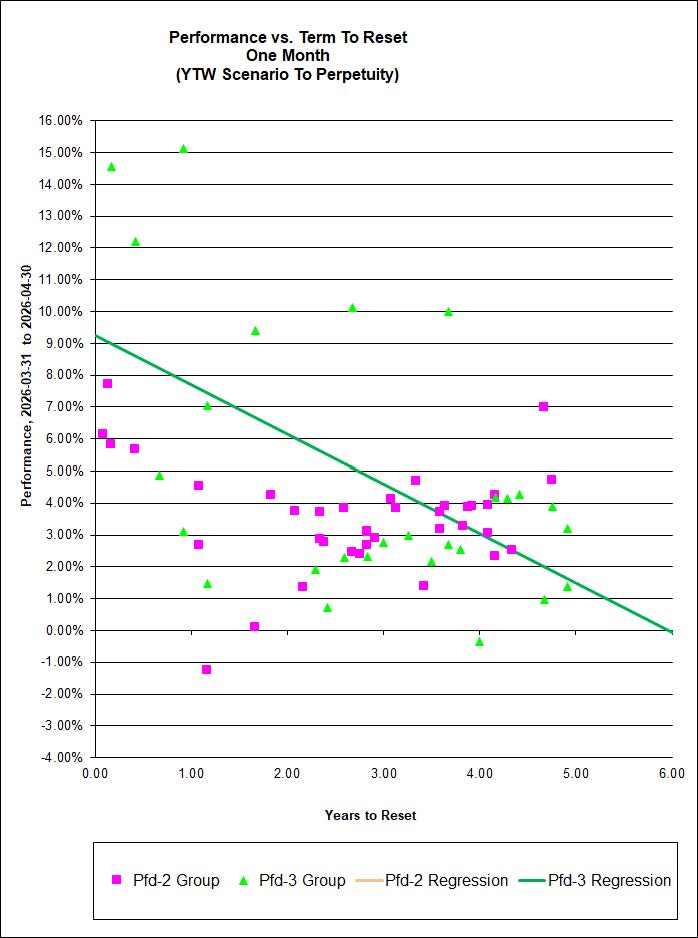
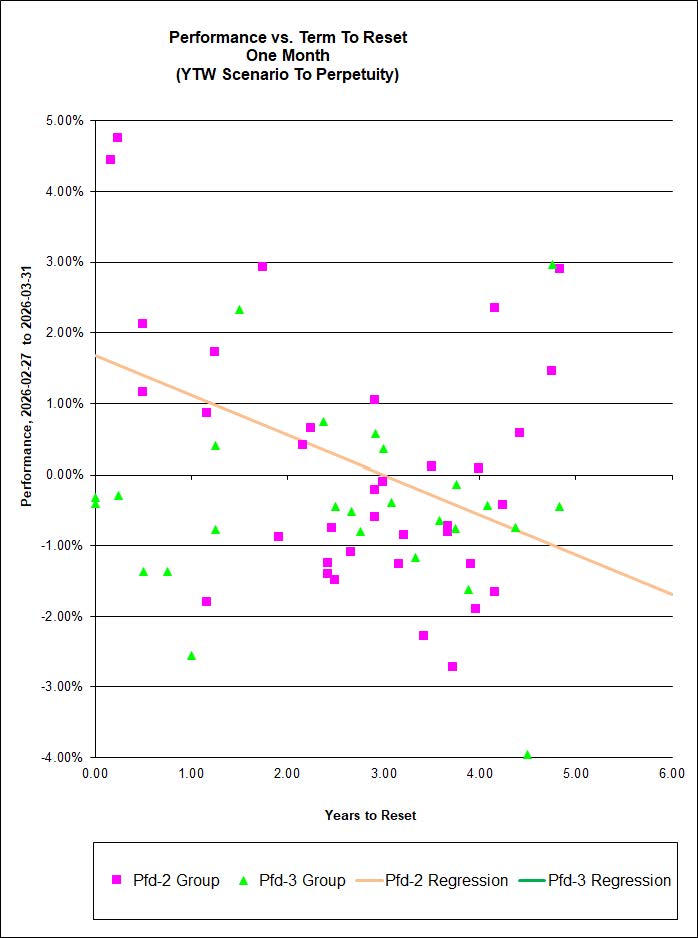
There is no correlation for either the Pfd-2 Group or the Pfd-3 Group:
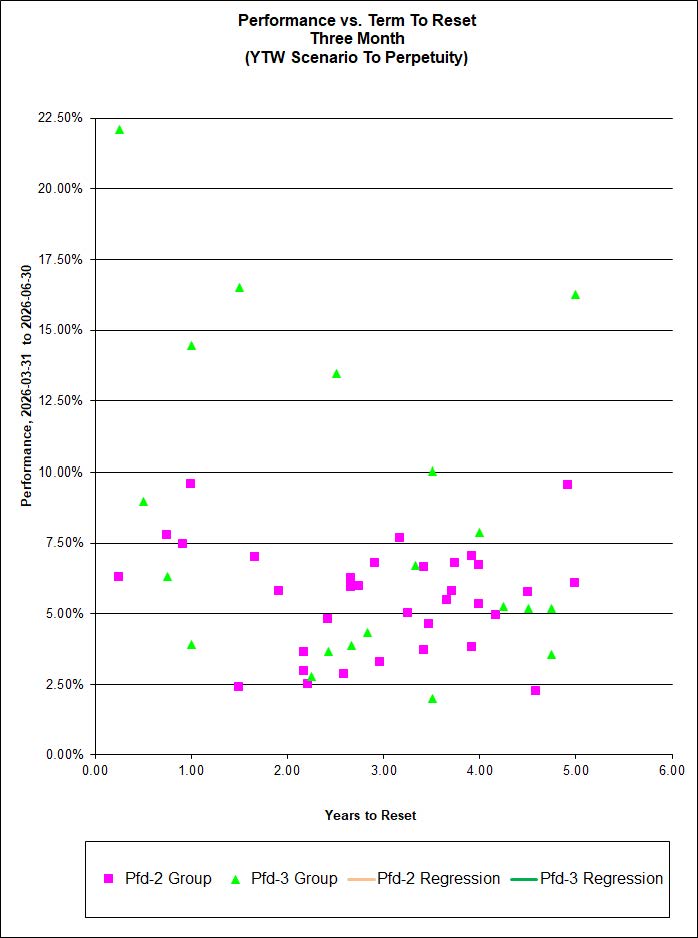
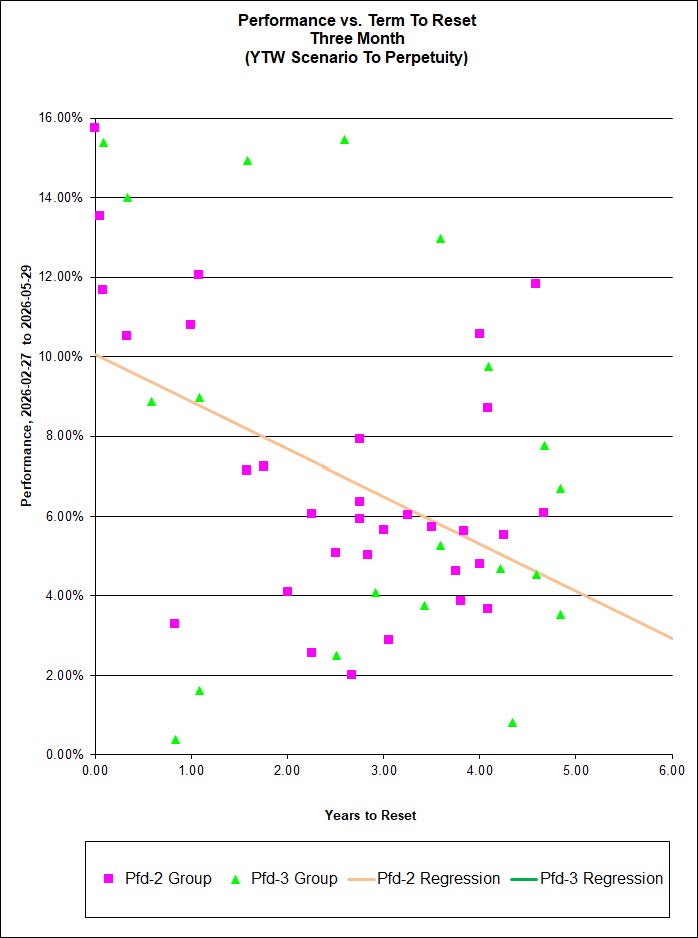
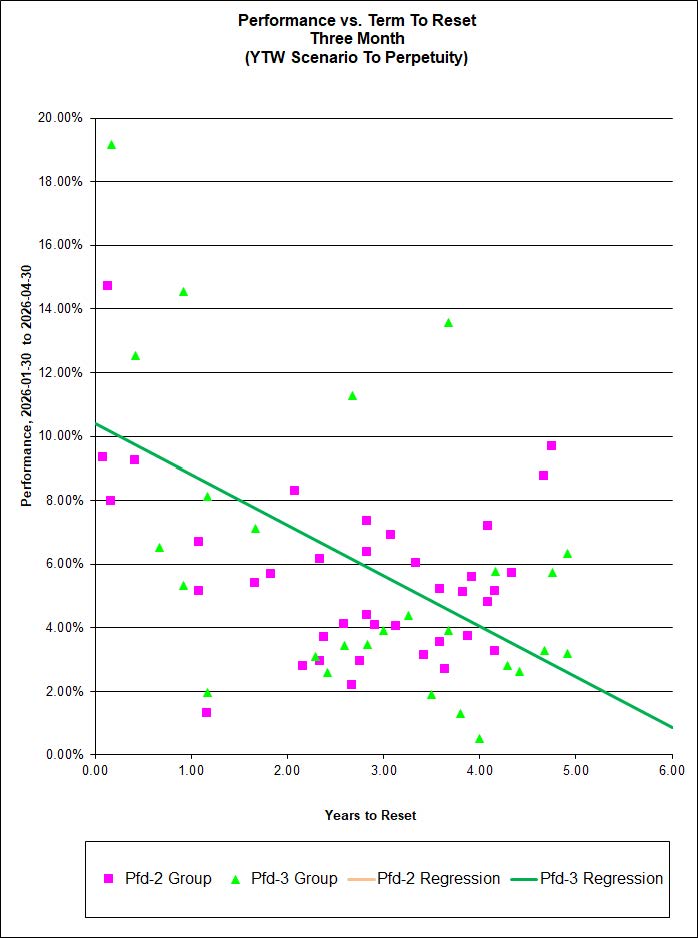
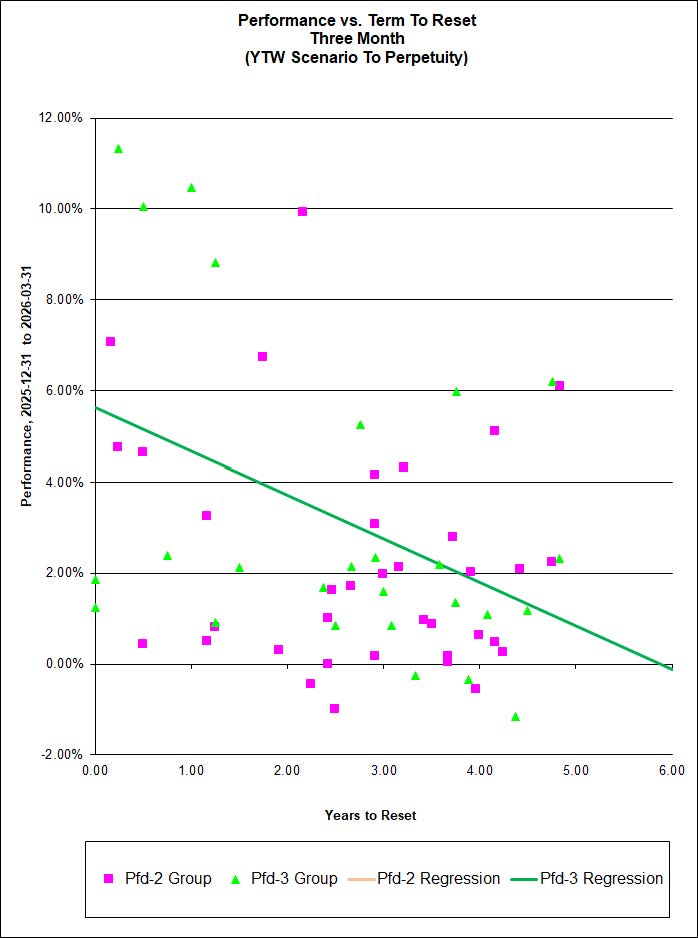
… but the three-month returns vs. Term to Reset show a correlation for the Pfd-2 Group(20%) but none for the Pfd-3 Group.
It should be noted that to some extent a dependence (of performance on term-to-reset) can be justified as the nearer-term issues will receive the benefit (adverse effects) of higher (lower) projected dividend rates sooner as a result of higher GOC-5 yields and therefore, perhaps, for longer. Equations for the relationship between correlation slope and change in GOC-5 were derived in the August 2022 PrefLetter.
Upward-sloping correlations of Performance vs. Term are to be expected when GOC-5 declines.
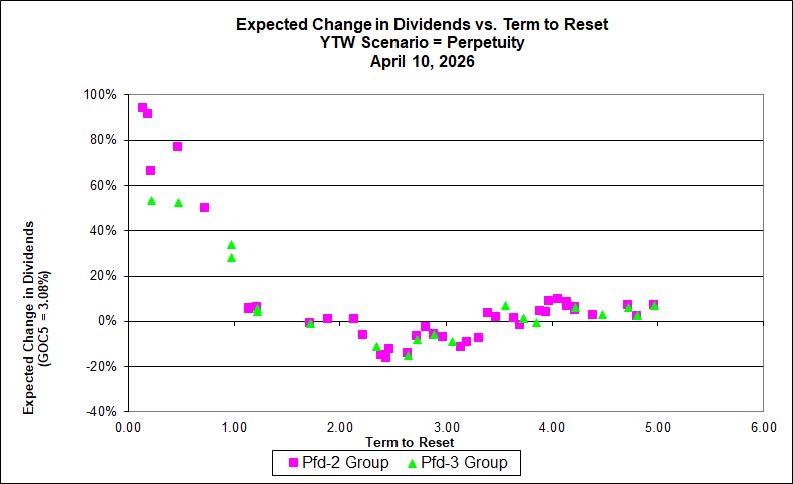
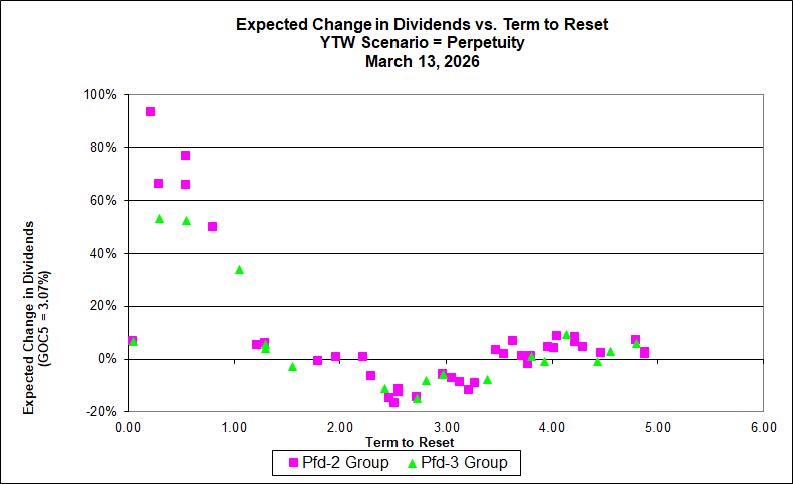
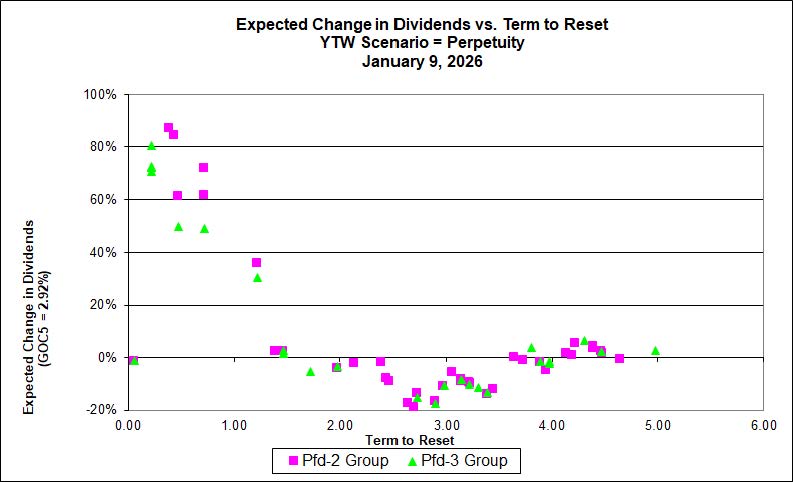
I keep talking about ‘Sustainable Income’ when discussing the fund’s income projections. This is because Sustainable Income is the average yield-to-worst (YTW) of the portfolio when the YTW is calculated to perpetuity (or to redemption, of course, if the yield to redemption is lower), including resets at the current GOC-5 rate. The sharp increase in GOC-5 in the past few years caused the difference between YTW and Current Yield to skyrocket, but these two values have become much closer. We have to wait for the reset date of the MAPF portfolio securities before we see a change in actual cash receipts – and, of course, there is no guarantee whatsoever that the rate used for estimation purposes now will be used for the actual calculation in the future (chart prepared as of 2026-05-08).
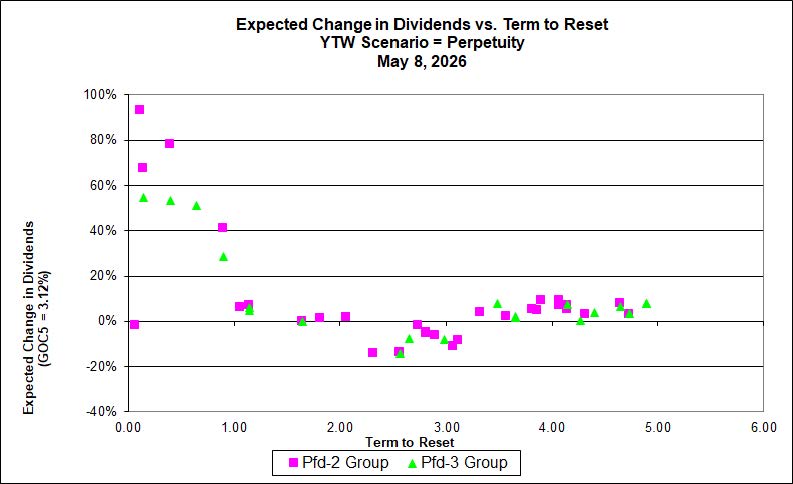
I will note that the fund’s current holdings of FixedResets are now paying dividends based on their previous reset at an average GOC-5 rate of 2.70% (for discounted FixedResets only, weighted by shares held), about 40bp below the current rate used for projections.
| Calculation of MAPF Sustainable Income Per Unit |
| Month |
NAVPU |
Portfolio
Average
YTW |
Leverage Divisor |
Securities Average
YTW |
Capital Gains
Multiplier |
Sustainable
Income per
Current
Unit |
| June, 2007 |
9.3114 |
5.16% |
1.03 |
5.01% |
1.552 |
0.3006 |
| September |
9.1489 |
5.35% |
0.98 |
5.46% |
1.552 |
0.3219 |
| December, 2007 |
9.007 |
5.53% |
0.942 |
5.87% |
1.552 |
0.3407 |
| March, 2008 |
8.8512 |
6.17% |
1.047 |
5.89% |
1.552 |
0.3359 |
| June |
8.3419 |
6.03% |
0.952 |
6.34% |
1.552 |
0.3407 |
| September |
8.1886 |
7.11% |
0.969 |
7.34% |
1.552 |
0.387 |
| December, 2008 |
8.0464 |
9.24% |
1.008 |
9.17% |
1.552 |
0.4752 |
| Mar, 2009 |
$8.83 |
8.60% |
0.995 |
8.80% |
1.552 |
0.5009 |
| June |
10.9846 |
7.05% |
0.999 |
7.06% |
1.552 |
0.4995 |
| September |
12.3462 |
6.03% |
0.998 |
6.04% |
1.552 |
0.4806 |
| December, 2009 |
10.5662 |
5.74% |
0.981 |
5.85% |
1.306 |
0.4734 |
| March, 2010 |
10.2497 |
6.03% |
0.992 |
6.08% |
1.306 |
0.4771 |
| June |
10.577 |
5.96% |
0.996 |
5.98% |
1.306 |
0.4846 |
| September |
11.3901 |
5.43% |
0.98 |
5.54% |
1.306 |
0.4832 |
| December, 2010 |
10.7659 |
5.37% |
0.993 |
5.41% |
1.207 |
0.4824 |
| March, 2011 |
11.056 |
6.00% |
0.994 |
5.96% |
1.207 |
0.5463 |
| June |
11.1194 |
5.87% |
1.018 |
5.98% |
1.207 |
0.5505 |
| September |
10.2709 |
6.10% |
1.001 |
6.11% |
1.207 |
0.5196 |
| December, 2011 |
10.0793 |
5.63% |
1.031 |
5.81% |
1.172 |
0.4992 |
| March, 2012 |
10.3944 |
5.13% |
0.996 |
5.11% |
1.172 |
0.4531 |
| June |
10.2151 |
5.32% |
1.012 |
5.38% |
1.172 |
0.4693 |
| September |
10.6703 |
4.61% |
0.997 |
4.62% |
1.172 |
0.421 |
| December, 2012 |
10.8307 |
4.24% |
0.989 |
4.29% |
1.172 |
0.3962 |
| March, 2013 |
10.9033 |
3.87% |
0.996 |
3.89% |
1.172 |
0.3615 |
| June |
10.3261 |
4.81% |
0.998 |
4.80% |
1.172 |
0.4229 |
| September |
10.0296 |
5.62% |
0.996 |
5.64% |
1.172 |
0.4829 |
| December, 2013 |
9.8717 |
6.02% |
1.008 |
5.97% |
1.172 |
0.503 |
| March, 2014 |
10.2233 |
5.55% |
0.998 |
5.56% |
1.172 |
0.4851 |
| June |
10.5877 |
5.09% |
0.998 |
5.10% |
1.172 |
0.4607 |
| September |
10.4601 |
5.28% |
0.997 |
5.30% |
1.172 |
0.4727 |
| December, 2014 |
10.5701 |
4.83% |
1.009 |
4.79% |
1.172 |
0.4317 |
| March, 2015 |
9.9573 |
4.99% |
1.001 |
4.99% |
1.172 |
0.4235 |
| June |
9.4181 |
5.55% |
1.002 |
5.54% |
1.172 |
0.4451 |
| September |
7.814 |
6.98% |
0.999 |
6.99% |
1.172 |
0.4658 |
| December, 2015 |
8.1379 |
6.85% |
0.997 |
6.87% |
1.172 |
0.4771 |
| March, 2016 |
7.4416 |
7.79% |
0.998 |
7.81% |
1.172 |
0.4956 |
| June |
7.6704 |
7.67% |
1.011 |
7.59% |
1.172 |
0.4965 |
| September |
8.059 |
7.35% |
0.993 |
7.40% |
1.172 |
0.509 |
| December, 2016 |
8.5844 |
7.24% |
0.99 |
7.31% |
1.172 |
0.5356 |
| March, 2017 |
9.3984 |
6.26% |
0.994 |
6.30% |
1.172 |
0.505 |
| June |
9.5313 |
6.41% |
0.998 |
6.42% |
1.172 |
0.5224 |
| September |
9.7129 |
6.56% |
0.998 |
6.57% |
1.172 |
0.5447 |
| December, 2017 |
10.0566 |
6.06% |
1.004 |
6.04% |
1.172 |
0.5179 |
| March, 2018 |
10.2701 |
6.22% |
1.007 |
6.18% |
1.172 |
0.5413 |
| June |
10.2518 |
6.22% |
0.995 |
6.25% |
1.172 |
0.5468 |
| September |
10.2965 |
6.62% |
1.018 |
6.50% |
1.172 |
0.5713 |
| December, 2018 |
8.6875 |
7.16% |
0.997 |
7.18% |
1.172 |
0.5324 |
| March, 2019 |
8.4778 |
7.09% |
1.007 |
7.04% |
1.172 |
0.5093 |
| June |
8.0896 |
7.33% |
0.996 |
7.36% |
1.172 |
0.5079 |
| September |
7.7948 |
7.96% |
0.998 |
7.98% |
1.172 |
0.5305 |
| December, 2019 |
8.09 |
6.03% |
0.995 |
6.06% |
1.172 |
0.4183 |
| March |
5.5596 |
7.04% |
1.006 |
7.00% |
1.172 |
0.332 |
| June |
6.3568 |
6.10% |
0.99 |
6.16% |
1.172 |
0.3342 |
| September |
7.2852 |
5.32% |
1 |
5.32% |
1.172 |
0.3307 |
| December, 2020 |
8.3947 |
4.46% |
0.999 |
4.46% |
1.172 |
0.3197 |
| March, 2021 |
9.6473 |
4.48% |
0.996 |
4.50% |
1.172 |
0.3703 |
| June |
10.3712 |
3.92% |
0.985 |
3.98% |
1.172 |
0.3522 |
| September |
10.7572 |
4.08% |
1.017 |
4.01% |
1.172 |
0.3682 |
| December, 2021 |
10.7432 |
4.31% |
0.999 |
4.31% |
1.172 |
0.3954 |
| March, 2022 |
10.504 |
5.53% |
1.004 |
5.51% |
1.172 |
0.4937 |
| June |
9.3115 |
7.04% |
0.993 |
7.09% |
1.172 |
0.5633 |
| September |
8.4093 |
8.10% |
0.997 |
8.12% |
1.172 |
0.5829 |
| December, 2022 |
7.9921 |
8.47% |
0.996 |
8.50% |
1.172 |
0.5799 |
| March, 2023 |
8.0788 |
7.90% |
0.997 |
7.92% |
1.172 |
0.5462 |
| June |
8.0197 |
9.19% |
1.003 |
9.16% |
1.172 |
0.627 |
| September |
7.9922 |
9.86% |
0.997 |
9.89% |
1.172 |
0.6744 |
| December, 2023 |
8.4715 |
8.14% |
1.002 |
8.12% |
1.172 |
0.5872 |
| March,2024 |
9.5892 |
7.60% |
1.006 |
7.56% |
1.172 |
0.6181 |
| June |
9.8516 |
7.32% |
0.999 |
7.33% |
1.172 |
0.6159 |
| September |
10.3641 |
6.55% |
0.99 |
6.62% |
1.172 |
0.5851 |
| December, 2024 |
11.0142 |
6.44% |
0.992 |
6.49% |
1.172 |
0.6101 |
| March,2025 |
10.8891 |
6.22% |
0.993 |
6.26% |
1.172 |
0.582 |
| June |
11.4529 |
6.10% |
0.997 |
6.12% |
1.172 |
0.5979 |
| September |
11.7912 |
5.78% |
1.002 |
5.77% |
1.172 |
0.5803 |
| December, 2025 |
10.5056 |
5.61% |
1.016 |
5.52% |
1 |
0.5801 |
| March, 2026 |
10.4455 |
5.59% |
1.002 |
5.58% |
1 |
0.5827 |
| May, 2026 |
10.9319 |
5.44% |
0.996 |
5.462% |
1 |
0.5971 |
NAVPU is shown after quarterly distributions of dividend income and annual distribution of capital gains.
Portfolio YTW includes cash (or margin borrowing), with an assumed interest rate of 0.00%
The Leverage Divisor indicates the level of cash in the account: if the portfolio is 1% in cash, the Leverage Divisor will be 0.99
Securities YTW divides “Portfolio YTW” by the “Leverage Divisor” to show the average YTW on the securities held; this assumes that the cash is invested in (or raised from) all securities held, in proportion to their holdings.
The Capital Gains Multiplier adjusts for the effects of Capital Gains Dividends. On 2009-12-31, there was a capital gains distribution of $1.989262 which is assumed for this purpose to have been reinvested at the final price of $10.5662. Thus, a holder of one unit pre-distribution would have held 1.1883 units post-distribution; the CG Multiplier reflects this to make the time-series comparable. Note that Dividend Distributions are not assumed to be reinvested.
Sustainable Income is the resultant estimate of the fund’s dividend income per current unit, before fees and expenses. Note that a “current unit” includes reinvestment of prior capital gains; a unitholder would have had the calculated sustainable income with only, say, 0.9 units in the past which, with reinvestment of capital gains, would become 1.0 current units. |
| DeemedRetractibles are comprised of all Straight Perpetuals (both PerpetualDiscount and PerpetualPremium) issued by BMO, BNS, CM, ELF, GWO, HSB, IAG, MFC, NA, RY, SLF and TD, which are not exchangable into common at the option of the company or the regulator (definition refined in May, 2011). These issues are analyzed as if their prospectuses included a requirement to redeem at par on or prior to 2022-1-31 (banks) or the Deemed Maturity date for insurers and insurance holding companies (see below)), in addition to the call schedule explicitly defined. See the Deemed Retractible Review: September 2016 for the rationale behind this analysis.
The same reasoning is also applied to FixedResets from these issuers, other than explicitly defined NVCC from banks.
In November, 2019, the assumption of DeemedRetraction for insurance issues was cancelled in the wake of the IAIS decision included in ICS 2.0. This resulted in a large drop in the yield calculated for these issues |
| The Deemed Maturity date for insurers was set at 2022-1-31 at the commencement of the process in February, 2011. It was extended to 2025-1-31 in April, 2013 and to 2030-1-31 in December, 2018. In November, 2019, the assumption of DeemedRetraction was cancelled in the wake of the IAIS decision included in ICS 2.0. |
| Yields for September, 2011, to January, 2012, were calculated by imposing a cap of 10% on the yields of YLO issues held, in order to avoid their extremely high calculated yields distorting the calculation and to reflect the uncertainty in the marketplace that these yields will be realized. From February to September 2012, yields on these issues have been set to zero. All YLO issues held were sold in October 2012. |
These calculations were performed assuming constant contemporary GOC-5 and 3-Month Bill rates, as follows:
| Canada Yields Assumed in Calculations |
| Month-end |
GOC-5 |
3-Month Bill |
| September, 2015 |
0.78% |
0.40% |
| December, 2015 |
0.71% |
0.46% |
| March, 2016 |
0.70% |
0.44% |
| June |
0.57% |
0.47% |
| September |
0.58% |
0.53% |
| December, 2016 |
1.16% |
0.47% |
| March, 2017 |
1.08% |
0.55% |
| June |
1.35% |
0.69% |
| September |
1.79% |
0.97% |
| December, 2017 |
1.83% |
1.00% |
| March, 2018 |
2.06% |
1.08% |
| June |
1.95% |
1.22% |
| September |
2.33% |
1.55% |
| December, 2018 |
1.88% |
1.65% |
| March, 2019 |
1.46% |
1.66% |
| June |
1.34% |
1.66% |
| September |
1.41% |
1.66% |
| December, 2019 |
1.68% |
1.68% |
| March, 2020 |
0.57% |
0.21% |
| June |
0.37% |
0.21% |
| September |
0.35% |
0.14% |
| December, 2020 |
0.42% |
0.08% |
| March, 2021 |
0.94% |
0.09% |
| June |
0.93% |
0.13% |
| September |
1.07% |
0.13% |
| December, 2021 |
1.31% |
0.16% |
| March, 2022 |
2.44% |
0.53% |
| June |
3.24% |
2.11% |
| September |
3.45% |
3.60% |
| December, 2022 |
3.37% |
4.35% |
| March, 2023 |
2.93% |
4.44% |
| June |
3.74% |
5.00% |
| September |
4.31% |
5.21% |
| December, 2023 |
3.21% |
5.13% |
| March, 2024 |
3.55% |
5.06% |
| June |
3.41% |
4.71% |
| September |
2.74% |
3.94% |
| December, 2024 |
3.02% |
3.19% |
| March, 2025 |
2.64% |
2.66% |
| June |
2.85% |
2.68% |
| September |
2.75% |
2.45% |
| December, 2025 |
2.93% |
2.18% |
| March, 2026 |
3.13% |
2.33% |
| May, 2026 |
3.12% |
2.30% |