Archive for July, 2011

MAPF Performance: July 2011

Saturday, July 30th, 2011

The fund had a disappointing month, dragged down by its holdings in YLO preferreds and the lower-coupon DeemedRetractibles.

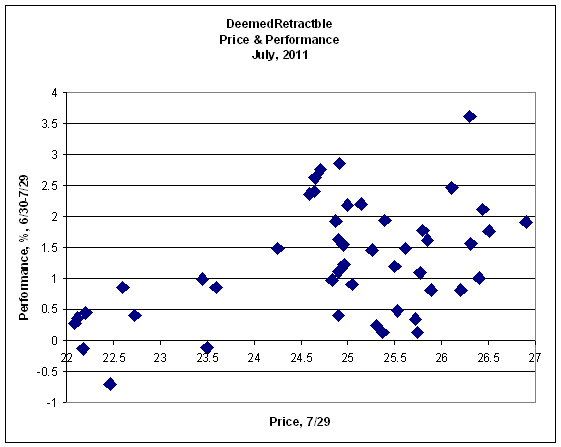
DeemedRetractibles exhibited a very surprising relationship between Price and Performance, as illustrated by:


Click for big

As for the holdings in YLO preferreds – which were topped up during the month to maintain a weighting of about 3.5% in the face of declining price – what can I say? While I certainly agree that this is not a tip-top credit – which is why I’m limiting exposure to 3.5% – I cannot fathom why the preferreds are trading at only a little over half price – particularly since the sale of Trader Corporation to Apax closed on July 28.

I received an eMail from a client early in the month:

Hi James, TD Newcrest has downgraded this company from hold to reduce in its Morning Action Notes today … It seems to me a good enough reason to not hold their securities in MAPF, even if it is a minor position, with the risk rating raised to high. Why wait for the credit agencies to follow?

Well, in general terms, as I have often stated: Sell Side analysis is a superb source of data, a very good source of ideas and a laughable source of actionable investment advice. It should always be remembered that sell-side analysis does not have performance as its object: the purpose of sell-side analysis is to get you to change your mind about a particular issue so that you’ll trade more.

For instance:

A couple of analysts did come to Sino’s defence, most notably Dundee’s Richard Kelertas. In a remarkable conference call on Tuesday, he jumped way outside his mandate and accused Mr. Block of committing his own fraud, calling his research “a pile of crap.” If he’s right, he will go down as the hero of the saga. If he’s wrong, he will be remembered like former Nesbitt analyst Egizio Bianchini, who backed Bre-X after the fraud allegations (though it worked out fine for Mr. Bianchini, now vice chair at BMO Capital Markets).

Additionally, I will note:

TD Newcrest analyst Scott Cuthbertson threw in the towel on Yellow Media Inc. (YLO-T2.08-0.08-3.70%), slashing his price target by half to $2 and downgrading it to “sell” after having recommended investors hold it since the beginning of March 2010, when the stock traded around $6.

Generally speaking, I think stocks become more attractive when the price moves down, not less. It is, of course, possible that YLO’s business prospects deteriorated even more rapidly than the share price – but I find that idea a little hard to justify from the financial statements. I couldn’t find any data readily available on Mr. Cuthbertson’s track record – but, as implied above, performance is irrelevant for sell-side analysis.

The reference in the client eMail to the credit rating agencies is also interesting: as I showed in the June edition of PrefLetter, a similarly precipituous decline in the BBD preferreds (back in 2002) lasted for a little over half a year; the actual downgrade marked the end of the panic and the issues recovered in price almost immediately. Presumably, the actual downgrade got more players to look at the issue seriously and decide – ‘hey! This is a not so good credit, but the price indicates imminent bankruptcy and I don’t think the situation is that serious!’

So anyway, I’m sticking to my guns. Whatever the merits (or faults) of YLO common as an investment, I can’t for the life of me figure out why the preferreds are trading so low – and until I can figure that out, I’m going to assume that this is simply another episode of mass hysteria, brought about by retail’s tendency to see all things in a binary light: there’s either no problems at all, or bankruptcy is imminent, with nothing in between. This is just another case of the relatively random fluctuations in market price brought about by supply and demand imbalances that are the fund’s bread and butter, writ large. I will also note that eMails such as the one I received are how the retail perspective transmits to institutional portfolios: I can assure you that in this kind of situation, with dramatic market movements and heavy media coverage, a lot of Portfolio Managers sell (sometimes against their better judgement, if they have any) simply so they won’t have to explain their holdings to their clients. The business is, in general, not about performance; it’s about story telling.

In the meantime, however, the fund’s holdings of YLO preferreds cost about 0.62% in return for the month.

The fund’s Net Asset Value per Unit as of the close July 29 was $11.0683.

Returns to July 29, 2011
Period MAPF Index CPD
according to
Claymore
One Month -0.46% +0.87% +0.74%
Three Months +2.70% +2.69% +2.05%
One Year +15.79% +13.10% +9.56%
Two Years (annualized) +15.62% +11.48% N/A
Three Years (annualized) +27.92% +9.79% +7.29%
Four Years (annualized) +18.09% +5.17%  
Five Years (annualized) +15.47% +4.25%  
Six Years (annualized) +13.58% +4.06%  
Seven Years (annualized) +12.67% +4.20%  
Eight Years (annualized) +13.47% +4.43%  
Nine Years (annualized) +13.46% +4.63%  
Ten Years (annualized) +13.24% +4.57%  
The Index is the BMO-CM “50”
MAPF returns assume reinvestment of distributions, and are shown after expenses but before fees.
CPD Returns are for the NAV and are after all fees and expenses.
* CPD does not directly report its two-year returns.
Figures for Omega Preferred Equity (which are after all fees and expenses) for 1-, 3- and 12-months are +0.75%, +2.24% and +10.45%, respectively, according to Morningstar after all fees & expenses. Three year performance is +8.00%.
Figures for Jov Leon Frazer Preferred Equity Fund Class I Units (which are after all fees and expenses) for 1-, 3- and 12-months are +0.13%, +0.80% and +6.69% respectively, according to Morningstar
Figures for Manulife Preferred Income Fund (formerly AIC Preferred Income Fund) (which are after all fees and expenses) for 1-, 3- and 12-months are +0.68%, +2.40% & +7.39%, respectively
Figures for Horizons AlphaPro Preferred Share ETF are not yet available (inception date 2010-11-23)

MAPF returns assume reinvestment of dividends, and are shown after expenses but before fees. Past performance is not a guarantee of future performance. You can lose money investing in Malachite Aggressive Preferred Fund or any other fund. For more information, see the fund’s main page. The fund is available either directly from Hymas Investment Management or through a brokerage account at Odlum Brown Limited.

Sometimes everything works … sometimes the trading works, but sectoral shifts overwhelm the increment … sometimes nothing works. The fund seeks to earn incremental return by selling liquidity (that is, taking the other side of trades that other market participants are strongly motivated to execute), which can also be referred to as ‘trading noise’. There were a lot of strongly motivated market participants during the Panic of 2007, generating a lot of noise! Unfortunately, the conditions of the Panic may never be repeated in my lifetime … but the fund will simply attempt to make trades when swaps seem profitable, without worrying about the level of monthly turnover.

There’s plenty of room for new money left in the fund. I have shown in recent issues of PrefLetter that market pricing for FixedResets is demonstrably stupid and I have lots of confidence – backed up by my bond portfolio management experience in the markets for Canadas and Treasuries, and equity trading on the NYSE & TSX – that there is enough demand for liquidity in any market to make the effort of providing it worthwhile (although the definition of “worthwhile” in terms of basis points of outperformance changes considerably from market to market!) I will continue to exert utmost efforts to outperform but it should be borne in mind that there will almost inevitably be periods of underperformance in the future.

The yields available on high quality preferred shares remain elevated, which is reflected in the current estimate of sustainable income.

Calculation of MAPF Sustainable Income Per Unit
Month NAVPU Portfolio
Average
YTW
Leverage
Divisor
Securities
Average
YTW
Capital
Gains
Multiplier
Sustainable
Income
per
current
Unit
June, 2007 9.3114 5.16% 1.03 5.01% 1.2857 0.3628
September 9.1489 5.35% 0.98 5.46% 1.2857 0.3885
December, 2007 9.0070 5.53% 0.942 5.87% 1.2857 0.4112
March, 2008 8.8512 6.17% 1.047 5.89% 1.2857 0.4672
June 8.3419 6.034% 0.952 6.338% 1.2857 $0.4112
September 8.1886 7.108% 0.969 7.335% 1.2857 $0.4672
December, 2008 8.0464 9.24% 1.008 9.166% 1.2857 $0.5737
March 2009 $8.8317 8.60% 0.995 8.802% 1.2857 $0.6046
June 10.9846 7.05% 0.999 7.057% 1.2857 $0.6029
September 12.3462 6.03% 0.998 6.042% 1.2857 $0.5802
December 2009 10.5662 5.74% 0.981 5.851% 1.0819 $0.5714
March 2010 10.2497 6.03% 0.992 6.079% 1.0819 $0.5759
June 10.5770 5.96% 0.996 5.984% 1.0819 $0.5850
September 11.3901 5.43% 0.980 5.540% 1.0819 $0.5832
December 2010 10.7659 5.37% 0.993 5.408% 1.0000 $0.5822
March, 2011 11.0560 6.00% 0.994 5.964% 1.0000 $0.6594
June 11.1194 5.87% 1.018 5.976% 1.0000 $0.6645
July, 2011 11.0683 6.14% 0.995 6.109% 1.0000 $0.6762
NAVPU is shown after quarterly distributions of dividend income and annual distribution of capital gains.
Portfolio YTW includes cash (or margin borrowing), with an assumed interest rate of 0.00%
The Leverage Divisor indicates the level of cash in the account: if the portfolio is 1% in cash, the Leverage Divisor will be 0.99
Securities YTW divides “Portfolio YTW” by the “Leverage Divisor” to show the average YTW on the securities held; this assumes that the cash is invested in (or raised from) all securities held, in proportion to their holdings.
The Capital Gains Multiplier adjusts for the effects of Capital Gains Dividends. On 2009-12-31, there was a capital gains distribution of $1.989262 which is assumed for this purpose to have been reinvested at the final price of $10.5662. Thus, a holder of one unit pre-distribution would have held 1.1883 units post-distribution; the CG Multiplier reflects this to make the time-series comparable. Note that Dividend Distributions are not assumed to be reinvested.
Sustainable Income is the resultant estimate of the fund’s dividend income per current unit, before fees and expenses. Note that a “current unit” includes reinvestment of prior capital gains; a unitholder would have had the calculated sustainable income with only, say, 0.9 units in the past which, with reinvestment of capital gains, would become 1.0 current units.
DeemedRetractibles are comprised of all Straight Perpetuals (both PerpetualDiscount and PerpetualPremium) issued by BMO, BNS, CM, ELF, GWO, HSB, IAG, MFC, NA, RY, SLF and TD, which are not exchangable into common at the option of the company (definition refined in May). These issues are analyzed as if their prospectuses included a requirement to redeem at par on or prior to 2022-1-31, in addition to the call schedule explicitly defined. See OSFI Does Not Grandfather Extant Tier 1 Capital, CM.PR.D, CM.PR.E, CM.PR.G: Seeking NVCC Status and the January, February, March and June, 2011, editions of PrefLetter for the rationale behind this analysis.

Significant positions were held in DeemedRetractible and FixedReset issues on June 30; all of the former and most of the latter currently have their yields calculated with the presumption that they will be called by the issuers at par prior to 2022-1-31. This presents another complication in the calculation of sustainable yield. The fund also holds a position in a SplitShare (BNA.PR.C) and an OperatingRetractible Scrap (YLO.PR.B) which also have their yields calculated with the expectation of a maturity.

However, if the entire portfolio except for the PerpetualDiscounts were to be sold and reinvested in these issues, the yield of the portfolio would be the 5.67% shown in the MAPF Portfolio Composition: July 2011 analysis (which is greater than the 5.44% index yield on July 29). Given such reinvestment, the sustainable yield would be $11.0683 * 0.0567 = $0.6276, a decrease from the $11.1194 * 0.0565 = $0.6282, reported in June.

Different assumptions lead to different results from the calculation, but the overall positive trend is apparent. I’m very pleased with the results! It will be noted that if there was no trading in the portfolio, one would expect the sustainable yield to be constant (before fees and expenses). The success of the fund’s trading is showing up in

  • the very good performance against the index
  • the long term increases in sustainable income per unit

As has been noted, the fund has maintained a credit quality equal to or better than the index; outperformance is due to constant exploitation of trading anomalies.

Again, there are no predictions for the future! The fund will continue to trade between issues in an attempt to exploit market gaps in liquidity, in an effort to outperform the index and keep the sustainable income per unit – however calculated! – growing.
MAPF Portfolio Composition, July 2011

Saturday, July 30th, 2011

Turnover declined even further in July, to less than 2%.

Trades were, as ever, triggered by a desire to exploit transient mispricing in the preferred share market (which may be thought of as “selling liquidity”), rather than any particular view being taken on market direction, sectoral performance or credit anticipation.

MAPF Sectoral Analysis 2011-7-29
HIMI Indices Sector Weighting YTW ModDur
Ratchet 0% N/A N/A
FixFloat 0% N/A N/A
Floater 0% N/A N/A
OpRet 0% N/A N/A
SplitShare 9.2% (0) 6.62% 6.16
Interest Rearing 0% N/A N/A
PerpetualPremium 0.0% (0) N/A N/A
PerpetualDiscount 10.9% (-0.4) 5.67% 14.38
Fixed-Reset 10.0% (+0.6) 3.00% 2.55
Deemed-Retractible 60.8% (+1.6) 5.90% 8.08
Scraps (Various) 9.7% (+0.5) 10.60% 8.60
Cash -0.5% (-2.3) 0.00% 0.00
Total 100% 6.14% 8.13
Totals and changes will not add precisely due to rounding. Bracketted figures represent change from June month-end. Cash is included in totals with duration and yield both equal to zero.
DeemedRetractibles are comprised of all Straight Perpetuals (both PerpetualDiscount and PerpetualPremium) issued by BMO, BNS, CM, ELF, GWO, HSB, IAG, MFC, NA, RY, SLF and TD, which are not exchangable into common at the option of the company. These issues are analyzed as if their prospectuses included a requirement to redeem at par on or prior to 2022-1-31, in addition to the call schedule explicitly defined. See OSFI Does Not Grandfather Extant Tier 1 Capital, CM.PR.D, CM.PR.E, CM.PR.G: Seeking NVCC Status and the January, February, March and June, 2011, editions of PrefLetter for the rationale behind this analysis.

The “total” reflects the un-leveraged total portfolio (i.e., cash is included in the portfolio calculations and is deemed to have a duration and yield of 0.00.). MAPF will often have relatively large cash balances, both credit and debit, to facilitate trading. Figures presented in the table have been rounded to the indicated precision.

Credit distribution is:

MAPF Credit Analysis 2011-7-29
DBRS Rating Weighting
Pfd-1 0 (0)
Pfd-1(low) 50.0% (+1.5)
Pfd-2(high) 22.7% (+0.7)
Pfd-2 0 (0)
Pfd-2(low) 18.1% (-2.2)
Pfd-3(high) 6.2% (-0.2)
Pfd-3 3.5% (+0.7)
Cash -0.5% (-2.3)
Totals will not add precisely due to rounding. Bracketted figures represent change from June month-end.
A position held in ELF preferreds has been assigned to Pfd-2(low)

Liquidity Distribution is:

MAPF Liquidity Analysis 2011-7-29
Average Daily Trading Weighting
<$50,000 5.5% (0)
$50,000 – $100,000 21.1% (+1.5)
$100,000 – $200,000 22.4% (-0.9)
$200,000 – $300,000 18.5% (+1.9)
>$300,000 33.0% (-0.2)
Cash -0.5% (-2.3)
Totals will not add precisely due to rounding. Bracketted figures represent change from June month-end.

MAPF is, of course, Malachite Aggressive Preferred Fund, a “unit trust” managed by Hymas Investment Management Inc. Further information and links to performance, audited financials and subscription information are available the fund’s web page. The fund may be purchased either directly from Hymas Investment Management or through a brokerage account at Odlum Brown Limited. A “unit trust” is like a regular mutual fund, but is sold by offering memorandum rather than prospectus. This is cheaper, but means subscription is restricted to “accredited investors” (as defined by the Ontario Securities Commission) or those who subscribe for $150,000+. Fund past performances are not a guarantee of future performance. You can lose money investing in MAPF or any other fund.

A similar portfolio composition analysis has been performed on the Claymore Preferred Share ETF (symbol CPD) as of August 31, 2010, and published in the September, 2010, PrefLetter. While direct comparisons are difficult due to the introduction of the DeemedRetractible class of preferred share (see above) it is fair to say:

  • MAPF credit quality is better
  • MAPF liquidity is a higher
  • MAPF Yield is higher
  • Weightings in
    • MAPF is much more exposed to DeemedRetractibles
    • MAPF is much less exposed to Operating Retractibles
    • MAPF is slightly more exposed to SplitShares
    • MAPF is less exposed to FixFloat / Floater / Ratchet
    • MAPF weighting in FixedResets is much lower

July 29, 2011

Friday, July 29th, 2011

Moody’s put Spain on Review-Negative:

Spain faces a possible downgrade by Moody’s Investors Service as its regions struggle to cut budget deficits and last week’s Greek bailout increases the risk that bondholders will have to pay for further European rescues.

Moody’s is reviewing the nation’s Aa2 classification, the ratings company said in a statement today. A cut would probably be “limited to one notch,” Moody’s said. The euro fell. Spain has the same credit rating as Italy, which is also on review for downgrade at Moody’s.

The trouble with regulators, as a class, is their inability to think things through. Increased transparency in the public bond market has brought with it reduction of choice for public investors, as more deals are done on a private placement basis, and thinner markets for the ones that remain, as capital gets redeployed to more profitable areas. Another example of this is hedge fund regulation:

There’s a two-word explanation for closing what was once one of the world’s biggest hedge funds and consistently one of the best-performing — with returns of about 30 percent annually in its first 30 years: Dodd-Frank. The law requires hedge funds to register with the Securities and Exchange Commission and provide information about customers, employees and assets. By returning outsiders’ money, Soros Fund Management escapes that rule and the loss of privacy that goes with it.

“An unfortunate consequence of these new circumstances is that we will no longer be able to manage assets for anyone other than a family client as defined under the regulations,” the brothers wrote in a letter to investors.

Or maybe regulators do think things through – a regulator’s ideal world is one in which everybody holds only plain-vanilla investments, nobody every complains and regulators are never subjected to criticism, informed or otherwise.

I would love to offer Malachite Aggressive Preferred Fund to the general public … but the process isn’t just expensive, it’s stupid expensive. To make such an idea work, I would have to convert my firm into just another marketting and distribution firm, with investment management tacked on as an unfortunate operating expense to be minimized.

There has been lots of noise about the City of Toronto cost-cutting programme … the problem as I see it is not so much that the City is doing things it doesn’t need to do (although there’s plenty of that) as it is that it grossly overpays for what it does. Take librarians, for example. CUPE BC claims that Toronto librarians make almost $35/hr – and that report was dated June, 2007! Add pension and benefits to that and I’ll bet there’s not much change from $100,000 annually. My girlfriend tells me that when she goes to the library and uses the scanner to check out books, there are generally three – count ’em, three – librarians watching her do it.

YLO closed the Trader Corp. deal yesterday, but it didn’t do them much good on the market as three of their four preferreds were down significantly on the day (bid/bid) – the exception was the short-term retractible, YLO.PR.A.

These issues did horribly on the month, occupying four of the bottom six positions on the total returns ranking of the HIMIPref™ universe: only YLD.PR.B (worst) and BBD.PR.D (fifth worst) managed to break the hegemony. Total returns for the YLO prefs ranged from -6.4% (YLO.PR.A) to -18.4% (YLO.PR.D).

The Canadian preferred share market closed the month on a mixed note,with PerpetualDiscounts down 2bp, FixedResets down 2bp and DeemedRetractibles gaining 7bp. Volatility was low. Volume was … pretty close to non-existent!

PerpetualDiscounts now yield 5.44%, equivalent to 7.07% interest at the standard equivalency factor of 1.3x. Long Corporates now yield about 5.1% (maybe a little under) (!) so the pre-tax interest-equivalent spread is now about 200bp, a widening from the 185bp reported on July 27 as the two yields have moved in opposite directions over the past two days.

And that’s it for another month!

HIMIPref™ Preferred Indices
These values reflect the December 2008 revision of the HIMIPref™ Indices

Values are provisional and are finalized monthly
Index Mean
Current
Yield
(at bid)
Median
YTW
Median
Average
Trading
Value
Median
Mod Dur
(YTW)
Issues Day’s Perf. Index Value
Ratchet 0.00 % 0.00 % 0 0.00 0 -1.1669 % 2,420.8
FixedFloater 0.00 % 0.00 % 0 0.00 0 -1.1669 % 3,640.9
Floater 2.50 % 2.33 % 35,393 21.47 4 -1.1669 % 2,613.8
OpRet 4.85 % 2.31 % 55,997 0.17 9 -0.1322 % 2,454.5
SplitShare 5.24 % 2.15 % 52,341 0.57 6 0.0379 % 2,512.5
Interest-Bearing 0.00 % 0.00 % 0 0.00 0 -0.1322 % 2,244.4
Perpetual-Premium 5.67 % 4.89 % 130,516 0.81 13 0.0959 % 2,096.1
Perpetual-Discount 5.41 % 5.44 % 109,798 14.76 17 -0.0247 % 2,214.7
FixedReset 5.15 % 3.16 % 217,897 2.63 58 -0.0229 % 2,325.5
Deemed-Retractible 5.06 % 4.69 % 275,258 7.84 47 0.0745 % 2,179.1
Performance Highlights
Issue Index Change Notes
PWF.PR.A Floater -4.05 % YTW SCENARIO
Maturity Type : Limit Maturity
Maturity Date : 2041-07-29
Maturity Price : 22.03
Evaluated at bid price : 22.26
Bid-YTW : 2.33 %
PWF.PR.E Perpetual-Discount -1.03 % YTW SCENARIO
Maturity Type : Limit Maturity
Maturity Date : 2041-07-29
Maturity Price : 23.68
Evaluated at bid price : 24.89
Bid-YTW : 5.49 %
FTS.PR.G FixedReset 1.08 % YTW SCENARIO
Maturity Type : Call
Maturity Date : 2013-09-01
Maturity Price : 25.00
Evaluated at bid price : 26.25
Bid-YTW : 3.19 %
IAG.PR.F Deemed-Retractible 1.15 % YTW SCENARIO
Maturity Type : Hard Maturity
Maturity Date : 2022-01-31
Maturity Price : 25.00
Evaluated at bid price : 26.30
Bid-YTW : 5.34 %
Volume Highlights
Issue Index Shares
Traded
Notes
IFC.PR.A FixedReset 31,562 Recent new issue.
YTW SCENARIO
Maturity Type : Hard Maturity
Maturity Date : 2022-01-31
Maturity Price : 25.00
Evaluated at bid price : 25.01
Bid-YTW : 4.09 %
BNS.PR.Y FixedReset 26,805 National crossed 25,000 at 25.34.
YTW SCENARIO
Maturity Type : Hard Maturity
Maturity Date : 2022-01-31
Maturity Price : 25.00
Evaluated at bid price : 25.17
Bid-YTW : 3.28 %
RY.PR.W Perpetual-Discount 23,420 YTW SCENARIO
Maturity Type : Limit Maturity
Maturity Date : 2041-07-29
Maturity Price : 24.43
Evaluated at bid price : 24.75
Bid-YTW : 4.94 %
RY.PR.A Deemed-Retractible 20,811 YTW SCENARIO
Maturity Type : Hard Maturity
Maturity Date : 2022-01-31
Maturity Price : 25.00
Evaluated at bid price : 24.71
Bid-YTW : 4.58 %
MFC.PR.F FixedReset 19,524 YTW SCENARIO
Maturity Type : Hard Maturity
Maturity Date : 2022-01-31
Maturity Price : 25.00
Evaluated at bid price : 25.03
Bid-YTW : 3.88 %
TD.PR.G FixedReset 17,044 YTW SCENARIO
Maturity Type : Call
Maturity Date : 2014-04-30
Maturity Price : 25.00
Evaluated at bid price : 27.19
Bid-YTW : 2.91 %
There were 11 other index-included issues trading in excess of 10,000 shares.
Wide Spread Highlights
Issue Index Quote Data and Yield Notes
PWF.PR.A Floater Quote: 22.26 – 23.24
Spot Rate : 0.9800
Average : 0.7181

YTW SCENARIO
Maturity Type : Limit Maturity
Maturity Date : 2041-07-29
Maturity Price : 22.03
Evaluated at bid price : 22.26
Bid-YTW : 2.33 %

NEW.PR.C SplitShare Quote: 14.25 – 14.69
Spot Rate : 0.4400
Average : 0.2682

YTW SCENARIO
Maturity Type : Call
Maturity Date : 2012-06-26
Maturity Price : 13.70
Evaluated at bid price : 14.25
Bid-YTW : 2.15 %

CIU.PR.C FixedReset Quote: 25.01 – 25.81
Spot Rate : 0.8000
Average : 0.6451

YTW SCENARIO
Maturity Type : Limit Maturity
Maturity Date : 2041-07-29
Maturity Price : 23.18
Evaluated at bid price : 25.01
Bid-YTW : 3.39 %

RY.PR.Y FixedReset Quote: 27.20 – 27.64
Spot Rate : 0.4400
Average : 0.2865

YTW SCENARIO
Maturity Type : Call
Maturity Date : 2014-11-24
Maturity Price : 25.00
Evaluated at bid price : 27.20
Bid-YTW : 3.17 %

PWF.PR.E Perpetual-Discount Quote: 24.89 – 25.20
Spot Rate : 0.3100
Average : 0.1945

YTW SCENARIO
Maturity Type : Limit Maturity
Maturity Date : 2041-07-29
Maturity Price : 23.68
Evaluated at bid price : 24.89
Bid-YTW : 5.49 %

FTS.PR.E OpRet Quote: 27.08 – 27.48
Spot Rate : 0.4000
Average : 0.2979

YTW SCENARIO
Maturity Type : Call
Maturity Date : 2013-06-01
Maturity Price : 25.75
Evaluated at bid price : 27.08
Bid-YTW : 2.31 %

FTN.PR.A: 11H1 Semi-Annual Report

Friday, July 29th, 2011

Financial 15 Split Inc. has released its Semi-Annual Report to May 31, 2011.

There’s an interesting line item in the statement of expenses: Capital tax, $7,103. I can’t figure that one out, and it’s not mentioned anywhere else in the document … but it’s minor, so we’ll let it go.

Figures of interest are:

MER: 1.22% of the whole unit value.

Average Net Assets: We need this to calculate portfolio yield. [147.6-million (NAV, beginning of period) + 147.8-million (NAV, end of period)] / 2 = about 148-million.

Underlying Portfolio Yield: Dividends received (net of withholding) of 2,216,733, times two (semi-annual) divided by average net assets of 148-million is 3.00%

Income Coverage: Net Investment Income of 1,286,575 divided by Preferred Share Distributions of 2,428,897 is 53%.

FFN.PR.A 11H1 Semi-Annual Report

Friday, July 29th, 2011

Financial 15 Split Corp. II has released its Semi-Annual Report to May 31, 2011.

Figures of interest are:

MER: 1.16% of the whole unit value

Average Net Assets: We need this to calculate portfolio yield. No change in Number of Units Outstanding, so just calculate as [83.1-million (NAV at beginning of period) + 84.6-million (NAV at end of period)] / 2 = 84-million, more or less.

Underlying Portfolio Yield: Dividends received (net of withholding) of 1,203,296 times two because it’s only half a year divided by average net assets of 84-million is 2.86%

Income Coverage: Net Investment Income of 703,329 divided by Preferred Share Distributions of 1,493,166 is 47%.

July 28, 2011

Friday, July 29th, 2011

According to the chatterati, credit rating agencies are heroes this week:

At a House subcommittee hearing yesterday, U.S. financial regulators acknowledged that the rating companies lately have been doing a better job. Alarmed by Greece’s unsustainable borrowing, the companies have slashed Greek debt to below investment grade. Troubles in Ireland, Portugal and Spain aren’t as severe, but those countries are under appropriately close scrutiny by rating services. Even the U.S. has been tagged for a downgrade if it can’t sort out its debt-ceiling and spending problems — and maybe even if it does.

It was a quiet, slightly negative day for the Canadian preferred share market, with PerpetualDiscounts up 2bp, FixedResets losing 6bp and DeemedRetractibles down 3bp. Big volume continued for BNS.PR.Z, but was otherwise volume was only average.

HIMIPref™ Preferred Indices
These values reflect the December 2008 revision of the HIMIPref™ Indices

Values are provisional and are finalized monthly
Index Mean
Current
Yield
(at bid)
Median
YTW
Median
Average
Trading
Value
Median
Mod Dur
(YTW)
Issues Day’s Perf. Index Value
Ratchet 0.00 % 0.00 % 0 0.00 0 -0.0942 % 2,449.4
FixedFloater 0.00 % 0.00 % 0 0.00 0 -0.0942 % 3,683.9
Floater 2.48 % 2.24 % 35,654 21.68 4 -0.0942 % 2,644.7
OpRet 4.84 % 1.74 % 56,737 0.17 9 0.1965 % 2,457.7
SplitShare 5.24 % 2.23 % 52,602 0.58 6 0.0265 % 2,511.5
Interest-Bearing 0.00 % 0.00 % 0 0.00 0 0.1965 % 2,247.4
Perpetual-Premium 5.68 % 4.83 % 132,372 0.81 13 -0.1535 % 2,094.1
Perpetual-Discount 5.41 % 5.41 % 110,846 14.76 17 0.0222 % 2,215.2
FixedReset 5.15 % 3.11 % 217,641 2.63 58 -0.0551 % 2,326.1
Deemed-Retractible 5.06 % 4.67 % 275,572 7.82 47 -0.0271 % 2,177.5
Performance Highlights
Issue Index Change Notes
PWF.PR.O Perpetual-Premium -1.16 % YTW SCENARIO
Maturity Type : Call
Maturity Date : 2018-10-31
Maturity Price : 25.00
Evaluated at bid price : 25.50
Bid-YTW : 5.49 %
SLF.PR.G FixedReset -1.12 % YTW SCENARIO
Maturity Type : Hard Maturity
Maturity Date : 2022-01-31
Maturity Price : 25.00
Evaluated at bid price : 25.56
Bid-YTW : 3.61 %
PWF.PR.F Perpetual-Discount 1.08 % YTW SCENARIO
Maturity Type : Limit Maturity
Maturity Date : 2041-07-28
Maturity Price : 24.18
Evaluated at bid price : 24.44
Bid-YTW : 5.39 %
FTS.PR.E OpRet 1.26 % YTW SCENARIO
Maturity Type : Call
Maturity Date : 2013-06-01
Maturity Price : 25.75
Evaluated at bid price : 27.35
Bid-YTW : 1.74 %
Volume Highlights
Issue Index Shares
Traded
Notes
BNS.PR.Z FixedReset 901,885 TD crossed two blocks of 100,000 each and one of 30,000, all at 24.25. RBC crossed blocks of 500,000 shares, 112,000 and 50,000, all at 24.25.
YTW SCENARIO
Maturity Type : Hard Maturity
Maturity Date : 2022-01-31
Maturity Price : 25.00
Evaluated at bid price : 24.25
Bid-YTW : 3.90 %
BNS.PR.T FixedReset 108,993 RBC crossed 100,000 at 27.20.
YTW SCENARIO
Maturity Type : Call
Maturity Date : 2014-04-25
Maturity Price : 25.00
Evaluated at bid price : 27.17
Bid-YTW : 2.94 %
BNS.PR.P FixedReset 80,961 Nesbitt crossed blocks of 50,000 and 26,000, both at 26.05.
YTW SCENARIO
Maturity Type : Call
Maturity Date : 2013-04-25
Maturity Price : 25.00
Evaluated at bid price : 25.85
Bid-YTW : 2.99 %
CM.PR.K FixedReset 80,960 RBC crossed 18,300 at 27.00; Nesbitt crossed 50,000 at 26.95.
YTW SCENARIO
Maturity Type : Call
Maturity Date : 2014-07-31
Maturity Price : 25.00
Evaluated at bid price : 26.90
Bid-YTW : 2.70 %
TD.PR.N OpRet 80,275 Desjardins crossed blocks of 60,000 and 15,000, both at 25.55.
YTW SCENARIO
Maturity Type : Call
Maturity Date : 2011-08-27
Maturity Price : 25.50
Evaluated at bid price : 25.61
Bid-YTW : -1.18 %
SLF.PR.C Deemed-Retractible 78,904 Desjardins crossed 75,000 at 22.10.
YTW SCENARIO
Maturity Type : Hard Maturity
Maturity Date : 2022-01-31
Maturity Price : 25.00
Evaluated at bid price : 22.09
Bid-YTW : 6.04 %
There were 34 other index-included issues trading in excess of 10,000 shares.
Wide Spread Highlights
Issue Index Quote Data and Yield Notes
IAG.PR.C FixedReset Quote: 26.95 – 27.27
Spot Rate : 0.3200
Average : 0.2020

YTW SCENARIO
Maturity Type : Call
Maturity Date : 2013-12-31
Maturity Price : 25.00
Evaluated at bid price : 26.95
Bid-YTW : 3.06 %

CIU.PR.C FixedReset Quote: 24.90 – 25.49
Spot Rate : 0.5900
Average : 0.4754

YTW SCENARIO
Maturity Type : Limit Maturity
Maturity Date : 2041-07-28
Maturity Price : 23.14
Evaluated at bid price : 24.90
Bid-YTW : 3.41 %

POW.PR.C Perpetual-Discount Quote: 25.06 – 25.43
Spot Rate : 0.3700
Average : 0.2581

YTW SCENARIO
Maturity Type : Call
Maturity Date : 2011-12-06
Maturity Price : 25.00
Evaluated at bid price : 25.06
Bid-YTW : 5.72 %

POW.PR.D Perpetual-Discount Quote: 23.87 – 24.24
Spot Rate : 0.3700
Average : 0.2691

YTW SCENARIO
Maturity Type : Limit Maturity
Maturity Date : 2041-07-28
Maturity Price : 23.59
Evaluated at bid price : 23.87
Bid-YTW : 5.27 %

IAG.PR.E Deemed-Retractible Quote: 25.92 – 26.25
Spot Rate : 0.3300
Average : 0.2353

YTW SCENARIO
Maturity Type : Call
Maturity Date : 2018-12-31
Maturity Price : 25.00
Evaluated at bid price : 25.92
Bid-YTW : 5.50 %

FTS.PR.H FixedReset Quote: 25.35 – 25.80
Spot Rate : 0.4500
Average : 0.3671

YTW SCENARIO
Maturity Type : Limit Maturity
Maturity Date : 2041-07-28
Maturity Price : 23.38
Evaluated at bid price : 25.35
Bid-YTW : 3.48 %

YLO Closes Trader Corporation Sale

Thursday, July 28th, 2011

Yellow Media has announced:

the successful completion of the sale of Trader Corporation’s automotive segment to Funds advised by Apax Partners. The transaction, previously announced on March 25, 2011, was completed for a net purchase consideration of $708 million, net of expenses and estimated working capital, fees and other adjustments.

This divestiture will enable the Company to strengthen its capital structure and focus all of its efforts on YPG’s digital transformation and organic execution in its core business. The proceeds from the sale will be largely used to reduce indebtedness and for general corporate purposes.

I’ve been checking every day since the Trader Corp. debt issue closed on July 22! As noted on July 27, their 11Q2 financials will be released on August 4.

This is not the kind of thing I usually report on PrefBlog … but the YLO issues have been … somewhat volatile in recent months. YLO has four issues outstanding, the retractibles YLO.PR.A and YLO.PR.B; and the FixedResets YLO.PR.C and YLO.PR.D. All are tracked by HIMIPref™; all are relegated to the Scraps index on credit concerns.

The June edition of PrefLetter contained a short appendix on YLO; I won’t decide until I look at the financials, but I suspect that the August edition will have another.

July 27, 2011

Wednesday, July 27th, 2011

The Bank of America takes wealth destruction seriously:

Bank of America Corp. (BAC), faced with a glut of foreclosed and abandoned houses it can’t sell, has a new tool to get rid of the most decrepit ones: a bulldozer.

The biggest U.S. mortgage servicer will donate 100 foreclosed houses in the Cleveland area and in some cases contribute to their demolition in partnership with a local agency that manages blighted property. The bank has similar plans in Detroit and Chicago, with more cities to come, and Wells Fargo & Co. (WFC), Citigroup Inc. (C), JPMorgan Chase & Co. (JPM) and Fannie Mae are conducting or considering their own programs.

The lender will pay as much as $7,500 for demolition or $3,500 in areas eligible to receive funds through the federal Neighborhood Stabilization Program. Uses for the land include development, open space and urban farming, according to the statement

Speaking of wealth destruction, S&P downgraded Greece:

Greece will partially default on its debt once European officials push through a plan that will see bondholders foot part of the bill of a second bailout agreed to last week in Brussels, Standard & Poor’s said.

The rating company also cut its ranking for Greece to CC, two steps above default, from CCC, according to a statement published in London today. The outlook on the debt is negative.

“The proposed restructuring of Greek government debt would amount to a selective default under our rating methodology,” S&P said. “We view the proposed restructuring as a ‘distressed exchange’ because, based on public statements by European policy makers, it is likely to result in losses for commercial creditors.”

But stupid people can relax – the authorities are taking steps to ensure that nobody will ever lose money in the PPN market:

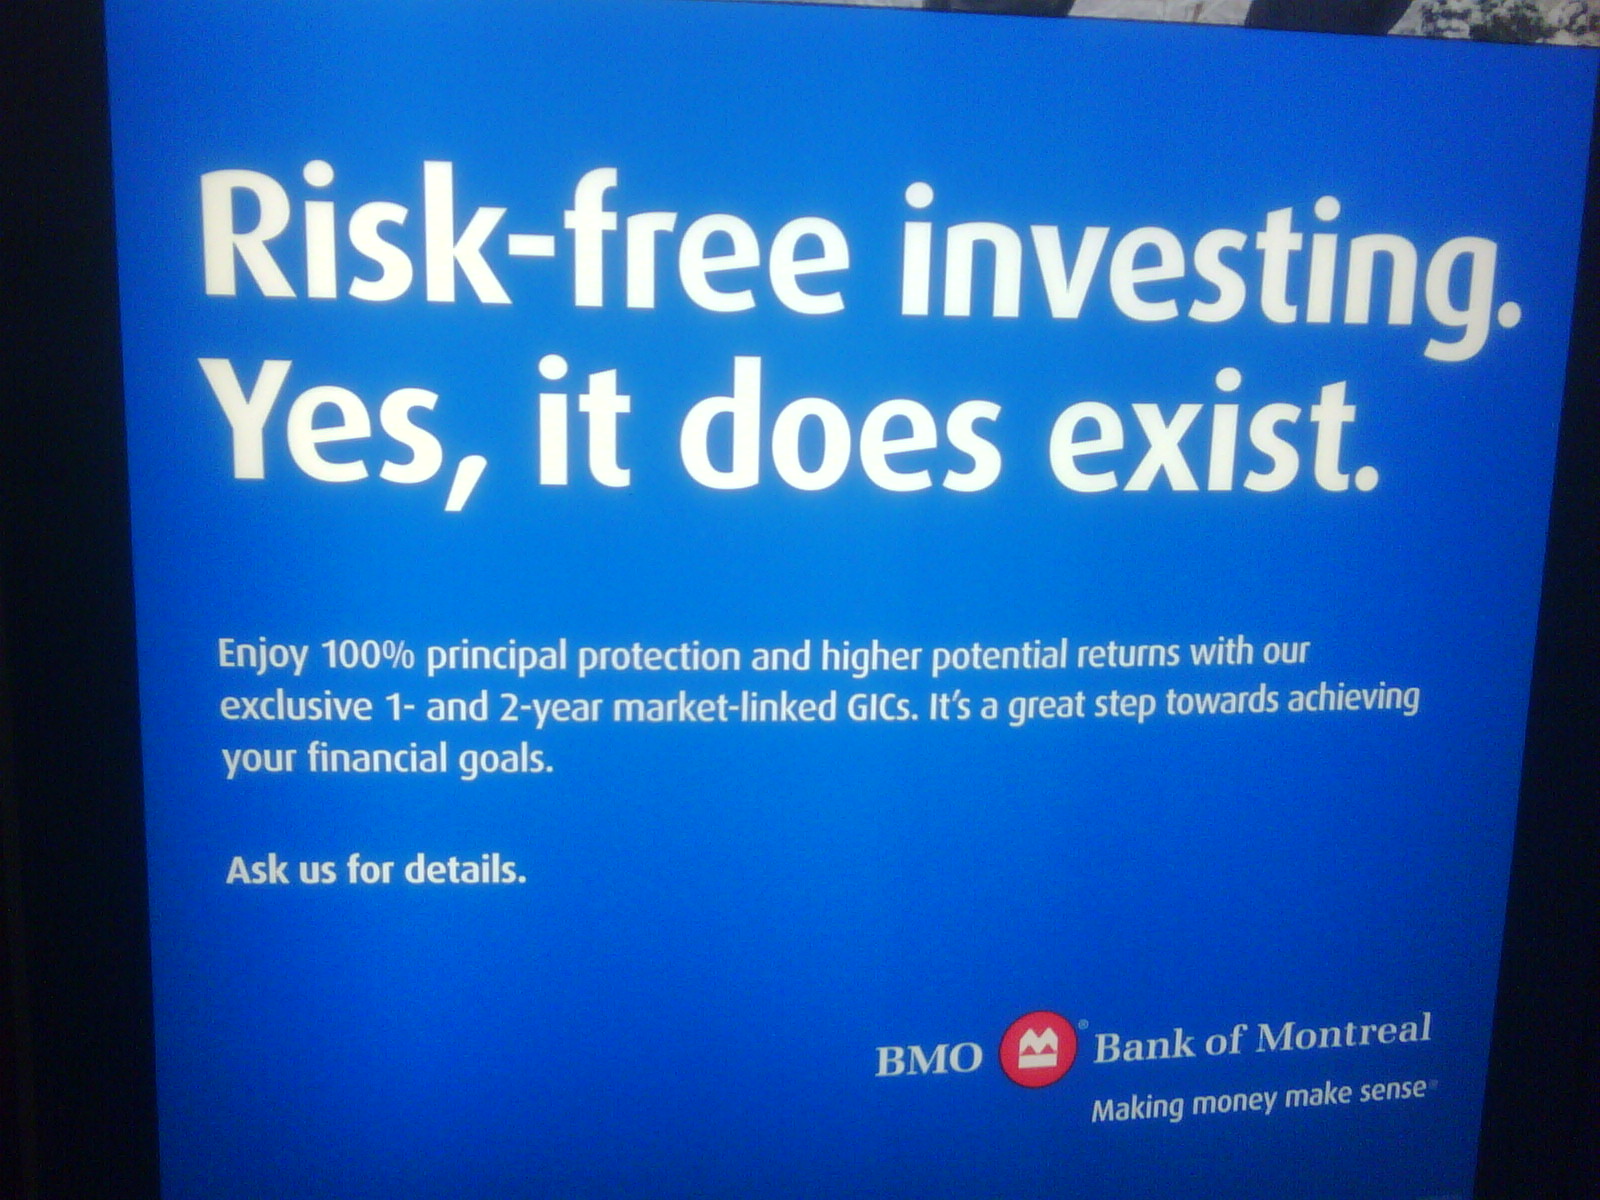
These are a way for banks to get cheap funding by packaging an unsecured debt security with an equity/credit/commodity/whatever derivative and selling it to customers who don’t have ISDAs or otherwise aren’t down with OTC derivatives. They’re called “principal protected” because even if the linked index goes down, you still get all your money back (albeit at zero yield). But that only happens if the issuer doesn’t go bankrupt – if they go bankrupt, you’re hosed just like other noteholders.

Which, duh, or so we thought. The notes after all said that they were Lehman’s unsecured obligations and that “an investment in the Notes will be subject to the credit risk of Lehman Brothers Holdings Inc, and the actual and perceived creditworthiness of Lehman Brothers Holdings Inc. may affect the market value of the Notes.” But that wasn’t enough for these plaintiffs, or for the judge, who is going to let the structured notes claims go to trial:

So the advice to structured notes desks is (1) put everything on the first page and (2) don’t assume that your customers are “careful and intelligent readers.”

Canadians, on the other hand, are indeed “careful and intelligent readers.”. I proved this on January 5:


Click for Big

In the States, though the SEC must be vigilant:

Among other things, the staff observed that broker-dealers might have:

  • recommended unsuitable structured securities products to retail investors;
  • traded at prices disadvantageous to retail investors;
  • omitted material facts about structured securities products offered to retail investors;
  • engaged in questionable sales practices with customers.

YLO will release 11Q2 results on August 4.

It was a mixed day for the Canadian preferred share market, with PerpetualDiscounts losing 6bp, FixedResets off 2bp and DeemedRetractibles up 10bp. Volatility was muted (but all negative); volume was average, but with massive volume in BNS.PR.Z (which had a “last” quote with a gigantic spread) on the back of some very nice tickets by RBC.

PerpetualDiscounts now yield 5.38%, equivalent to 6.99% interest at the standard equivalency factor of 1.3x. Long corporates now yield 5.15% (!!) so the pre-tax interest-equivalent spread is now about 185bp, a tightening from the 200bp reported on July 20 as the PerpetualDiscounts played catch-up to the prior downward move in bond yields.

HIMIPref™ Preferred Indices
These values reflect the December 2008 revision of the HIMIPref™ Indices

Values are provisional and are finalized monthly
Index Mean
Current
Yield
(at bid)
Median
YTW
Median
Average
Trading
Value
Median
Mod Dur
(YTW)
Issues Day’s Perf. Index Value
Ratchet 0.00 % 0.00 % 0 0.00 0 -0.3871 % 2,451.7
FixedFloater 0.00 % 0.00 % 0 0.00 0 -0.3871 % 3,687.3
Floater 2.47 % 2.24 % 36,117 21.68 4 -0.3871 % 2,647.2
OpRet 4.85 % 2.28 % 56,903 0.18 9 -0.0512 % 2,452.9
SplitShare 5.25 % 2.14 % 52,709 0.58 6 -0.0800 % 2,510.9
Interest-Bearing 0.00 % 0.00 % 0 0.00 0 -0.0512 % 2,243.0
Perpetual-Premium 5.67 % 4.94 % 133,387 0.82 13 0.0791 % 2,097.3
Perpetual-Discount 5.41 % 5.38 % 111,636 14.77 17 -0.0617 % 2,214.7
FixedReset 5.14 % 3.11 % 210,351 2.63 58 -0.0196 % 2,327.3
Deemed-Retractible 5.05 % 4.65 % 269,754 7.82 47 0.0951 % 2,178.1
Performance Highlights
Issue Index Change Notes
NA.PR.P FixedReset -1.15 % YTW SCENARIO
Maturity Type : Call
Maturity Date : 2014-02-15
Maturity Price : 25.00
Evaluated at bid price : 26.69
Bid-YTW : 3.69 %
FTS.PR.F Perpetual-Discount -1.09 % YTW SCENARIO
Maturity Type : Limit Maturity
Maturity Date : 2041-07-27
Maturity Price : 24.17
Evaluated at bid price : 24.46
Bid-YTW : 5.07 %
BAM.PR.N Perpetual-Discount -1.07 % YTW SCENARIO
Maturity Type : Limit Maturity
Maturity Date : 2041-07-27
Maturity Price : 21.84
Evaluated at bid price : 22.14
Bid-YTW : 5.41 %
TRI.PR.B Floater -1.06 % YTW SCENARIO
Maturity Type : Limit Maturity
Maturity Date : 2041-07-27
Maturity Price : 22.98
Evaluated at bid price : 23.25
Bid-YTW : 2.24 %
Volume Highlights
Issue Index Shares
Traded
Notes
BNS.PR.Z FixedReset 1,402,675 RBC crossed blocks of 575,000 shares, 100,000 and 413,300, all at 24.25. TD crossed 300,000 at the same price.
YTW SCENARIO
Maturity Type : Hard Maturity
Maturity Date : 2022-01-31
Maturity Price : 25.00
Evaluated at bid price : 24.26
Bid-YTW : 3.89 %
BNS.PR.Q FixedReset 81,413 RBC crossed 65,000 at 26.05.
YTW SCENARIO
Maturity Type : Call
Maturity Date : 2013-10-25
Maturity Price : 25.00
Evaluated at bid price : 26.01
Bid-YTW : 3.13 %
TD.PR.I FixedReset 71,667 RBC crossed blocks of 25,000 and 40,000, both at 27.39.
YTW SCENARIO
Maturity Type : Call
Maturity Date : 2014-07-31
Maturity Price : 25.00
Evaluated at bid price : 27.37
Bid-YTW : 2.93 %
TD.PR.O Deemed-Retractible 49,737 Desjardins crossed 27,000 at 25.45.
YTW SCENARIO
Maturity Type : Call
Maturity Date : 2013-10-31
Maturity Price : 25.25
Evaluated at bid price : 25.45
Bid-YTW : 4.42 %
RY.PR.R FixedReset 41,243 Scotia crossed 35,000 at 27.05.
YTW SCENARIO
Maturity Type : Call
Maturity Date : 2014-02-24
Maturity Price : 25.00
Evaluated at bid price : 26.85
Bid-YTW : 3.07 %
BMO.PR.L Deemed-Retractible 34,356 YTW SCENARIO
Maturity Type : Call
Maturity Date : 2013-05-25
Maturity Price : 26.00
Evaluated at bid price : 27.02
Bid-YTW : 3.89 %
There were 33 other index-included issues trading in excess of 10,000 shares.
Wide Spread Highlights
Issue Index Quote Data and Yield Notes
BNS.PR.Z FixedReset Quote: 24.26 – 25.50
Spot Rate : 1.2400
Average : 0.7346

YTW SCENARIO
Maturity Type : Hard Maturity
Maturity Date : 2022-01-31
Maturity Price : 25.00
Evaluated at bid price : 24.26
Bid-YTW : 3.89 %

CIU.PR.C FixedReset Quote: 25.00 – 25.49
Spot Rate : 0.4900
Average : 0.3497

YTW SCENARIO
Maturity Type : Limit Maturity
Maturity Date : 2041-07-27
Maturity Price : 23.17
Evaluated at bid price : 25.00
Bid-YTW : 3.39 %

TRI.PR.B Floater Quote: 23.25 – 23.70
Spot Rate : 0.4500
Average : 0.3322

YTW SCENARIO
Maturity Type : Limit Maturity
Maturity Date : 2041-07-27
Maturity Price : 22.98
Evaluated at bid price : 23.25
Bid-YTW : 2.24 %

PWF.PR.H Perpetual-Premium Quote: 25.05 – 25.41
Spot Rate : 0.3600
Average : 0.2449

YTW SCENARIO
Maturity Type : Call
Maturity Date : 2011-12-10
Maturity Price : 25.00
Evaluated at bid price : 25.05
Bid-YTW : 5.04 %

BAM.PR.T FixedReset Quote: 24.87 – 25.20
Spot Rate : 0.3300
Average : 0.2177

YTW SCENARIO
Maturity Type : Limit Maturity
Maturity Date : 2041-07-27
Maturity Price : 23.08
Evaluated at bid price : 24.87
Bid-YTW : 4.34 %

BAM.PR.N Perpetual-Discount Quote: 22.14 – 22.47
Spot Rate : 0.3300
Average : 0.2216

YTW SCENARIO
Maturity Type : Limit Maturity
Maturity Date : 2041-07-27
Maturity Price : 21.84
Evaluated at bid price : 22.14
Bid-YTW : 5.41 %

DW.PR.A to Vote on Redemption

Wednesday, July 27th, 2011

DundeeWealth Inc. has announced:

that it has called a special meeting of shareholders of DundeeWealth for September 7, 2011 to consider a special resolution authorizing an amendment to the Company’s articles to permit the Company to redeem all of the issued and outstanding first preference shares, series 1 (the “Series 1 Shares”) at a price of $26.50 plus accrued and unpaid dividends up to but excluding the redemption date. If the proposed amendment is approved, the redemption will occur on September 8, 2011 (or, if the special meeting is adjourned or postponed, on the business day immediately following any such adjourned or postponed meeting).

The Series 1 Shares are currently redeemable by DundeeWealth at a price of $26.25 per Series 1 Share plus accrued and unpaid dividends thereon up to but excluding the redemption date, provided that circumstances exist where holders of the Series 1 Shares are entitled to vote separately as a class or series by law. Commencing on March 13, 2012, DundeeWealth will have the right to redeem the Series 1 Shares at a price of $26.00 per Series 1 Share plus accrued and unpaid dividends thereon, without any requirement for a vote.

The proposal provides holders of Series 1 Shares with an opportunity to realize on their investment in DundeeWealth at a premium of $0.25 over the current redemption price and a premium of $0.50 over the redemption price that will apply commencing on March 13, 2012. In addition, the redemption price contemplated by the proposal represents a premium of $0.50 over the 20-day volume weighted average trading price for the Series 1 Shares for the period ended July 26, 2011.

The Series 1 Shares are listed for trading on the Toronto Stock Exchange under the symbol “DW.PR.A”. If the special resolution is approved by shareholders, DundeeWealth intends to apply to delist the Series 1 Shares from trading on the Toronto Stock Exchange and to exercise its right to redeem its $200 million 5.10% series 1 notes due September 25, 2014. Upon the redemption of the Series 1 Shares and the series 1 notes, DundeeWealth will apply to cease to be a reporting issuer under the securities laws of each province of Canada in which it is currently a reporting issuer.

In order to become effective, the special resolution must be approved by: (i) two-thirds of the votes cast together by all holders of common shares, special shares, series C and first preference shares, series X present in person or represented by proxy at the meeting; and (ii) two-thirds of the votes cast by the holders of Series 1 Shares present in person or represented by proxy at the meeting voting as a class. The Bank of Nova Scotia owns all of the outstanding common shares, special shares, series C and first preference shares, series X as well as approximately 1.6% of the outstanding Series 1 Shares and has indicated that it intends to vote in favour of the special resolution. Accordingly, the approval referred to in (i) above is assured.

Details of the proposal will be outlined in an information circular to be sent to shareholders in connection with the special meeting. Copies of the information circular will be available on the SEDAR website at www.sedar.com.

DW.PR.A was last mentioned on PrefBlog when it was upgraded to P-2(high) by S&P.

The proposed redemption price of $26.50 to be paid 2011-9-8 implies a yield of 3.52% (quarterly compounding) until the par call date of 2016-3-13. Note that:

Any redemption before March 13, 2012 is limited to circumstances where the Series 1 Shares are entitled to vote separately as a class or series by law.

If redeemed 2012-3-13 at 26.00, the yield to par call would be 3.92%.

So basically, although 3.52% seems like a fat yield for the company (compared to, say, the 1.98% that National got on its tender offer) or the YTWs on investment grade operating retractibles, it’s probably as good as you’re gonna get. I recommend voting ‘Yes’.

Financial Stability Oversight Council Publishes 2011 Report

Wednesday, July 27th, 2011

The Financial Stability Oversight Council (comprised of an alphabet soup of US financial regulators) has released its 2011 Annual Report.

There are many items of interest in this excellent report; one issue that I find interesting is the regulation of money market funds:

The stable, rounded $1 NAV fosters an expectation that MMF share prices will not fluctuate. However, when shareholders perceive that a fund may suffer losses, each shareholder has an incentive to redeem shares before other shareholders, causing a run on the fund. Such redemptions can accelerate the likelihood of a break-the-buck event to the extent that the fund’s asset sales to meet redemptions significantly depress the market value of the fund’s remaining assets. In such a scenario, the ability of early redeemers to receive the full $1 NAV is essentially subsidized by the losses absorbed by remaining shareholders.


Click for Big

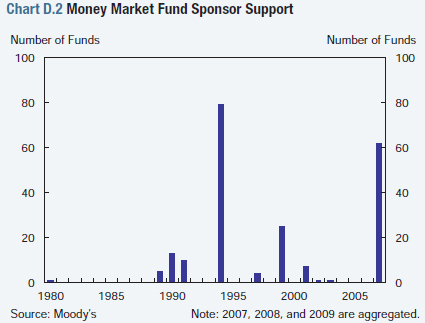
MMFs invest in assets that may lose value, but funds have no formal capital buffers or insurance to absorb loss and maintain their stable NAV. When losses do occur, MMFs have historically relied on discretionary sponsor support to maintain a stable NAV and preserve the franchise value of fund management businesses (Chart D.2). That support may come in the form of capital contributions or the purchase of assets that have lost value, for example.

Sponsors do not commit to support an MMF in advance, however, because an explicit commitment may require the sponsor to consolidate the fund on its balance sheet. Thus, although investors ostensibly bear the risk of an MMF breaking the buck, sponsors have in the past borne that risk themselves, fostering the perceived safety of MMF investments. Moreover, the uncertainty about the availability and sufficiency of such support during crises, and the fact that many MMFs lack deep-pocketed sponsors, contribute to their susceptibility to runs.

Expectation of Government Support

Given the unprecedented government support of MMFs during the crisis in 2008 and 2009, even sophisticated institutional investors and fund managers may have the impression that the government would be ready to support the industry again with the same tools.

Although these new rules are a positive first step, the SEC recognizes that they address only some of the features that make MMFs susceptible to runs, and that more should be done to address systemic risks posed by MMFs and their structural vulnerabilities.

The report takes a much more reasonable view of the Flash Crash than did the highly politicized SEC report:

During periods of violent price movements, market liquidity can evaporate as hedging strategies to protect against market risk become strained or directly amplify the price movements. For example, in the October 1987 equity market crash, portfolio insurance programs were designed to sell when prices declined; in fact, they were set to sell at an increasing rate, thereby accelerating the market decline. Similarly, in the flash crash of May 6, 2010, liquidity evaporated and market functioning deteriorated rapidly. Regulators have added circuit breakers in equity markets to mitigate such dynamics (see Section 5.3.4), but this event illustrated the potential fragility of market liquidity, particularly in areas characterized by rapid innovation and change in market behaviors.

The role of exchange traded funds (ETFs) during the flash crash has focused attention on these products. The rapid rise of ETFs has been driven by the attraction of gaining liquid exposure to less liquid asset classes—such as commodities and certain emerging markets—without having to execute trades directly in less liquid markets (Chart E.1). However, the liquidity of ETFs depends heavily on the support of market makers and on market functioning in the underlying asset. The relationship between ETF turnover and market volatility bears further analysis, and regulators must continue to monitor the development of more complex products in both U.S. and foreign-domiciled funds that might heighten liquidity concerns.

One item of great interest to me was developments in the idea that insurance companies should be regulated at the consolidated level – there is not a single mention of this in the report, so for the moment I will assume that this highly desirable reform has been dropped. Instead, the report discusses the new Federal Insurance Office (FIO), which is just another micromanaging job-creation scheme.