The Economist has a good piece on income inequality:
Mr Piketty argues that over the long run the rate of return on wealth exceeds economic growth. Over time, this relationship increases inequality as the share of national income going to those who own capital (the rich) rises, while the portion going to labour (everyone else) falls. He also argues that the return on capital in recent history has been remarkably stable, even as economic growth has fallen, and that this trend will continue in the future.
Mr Rognlie has three main criticisms of all this. Several commentators have pointed out that the rate of return from capital should decline in the long run, rather than remaining high as Mr Piketty maintains, owing to the law of diminishing returns. Mr Rognlie expands on this, arguing that Mr Piketty has an inflated idea of the current return. Modern forms of capital, such as software, depreciate faster in value than equipment did in the past: a giant metal press might have a working life of decades whereas a new piece of database-management software will be obsolete in a few years at most. This means that returns from wealth may not necessarily be growing in net terms, since a rising share of the gains that flow to the owners of capital must be reinvested.
Second, Mr Rognlie finds that higher returns to wealth have not been distributed equally across all investments. The return on assets other than housing has been remarkably stable since 1970. In fact, surging house prices are almost entirely responsible for growing returns on capital.
Third, the idea that workers’ share of wealth can continue to decline rests on the assumption that it is easy to substitute capital (ie, robots) for workers. But if lots of the capital in question is tied up in houses, then this switch would be far harder than Mr Piketty suggests.
I don’t find these arguments particularly convincing. With respect to the first point, once capital invested in software depreciates fast enough, it becomes a labour cost in capital clothing: if you need a permanent staff of programmers on hand to keep your business running (whether they are in-house or external), then that’s a labour cost.
The second and third points are interesting, but I suggest that people are spending more on housing because the return on capital is relatively low and relatively volatile – should returns on actual capital increase, then people will stop buying second houses for rental purposes and put their money into the stock market.
It was a mixed day for the Canadian preferred share market, with PerpetualDiscounts gaining 11bp, FixedResets down 31bp and DeemedRetractibles off 19bp. The Performance Highlights table is relatively length and almost all losers, with Enbridge issues again being prominent on the bad side. Volume was on the high side of average.
For as long as the FixedReset market is so violently unsettled, I’ll keep publishing updates of the more interesting and meaningful series of FixedResets’ Implied Volatilities. This doesn’t include Enbridge because although Enbridge has a large number of issues outstanding, all of which are quite liquid, the range of Issue Reset Spreads is too small for decent conclusions. The low is 212bp (ENB.PR.H; second-lowest is ENB.PR.D at 237bp) and the high is a mere 268 for ENB.PF.G.
Remember that all rich /cheap assessments are:
» based on Implied Volatility Theory only
» are relative only to other FixedResets from the same issuer
» assume constant GOC-5 yield
» assume constant Implied Volatility
» assume constant spread
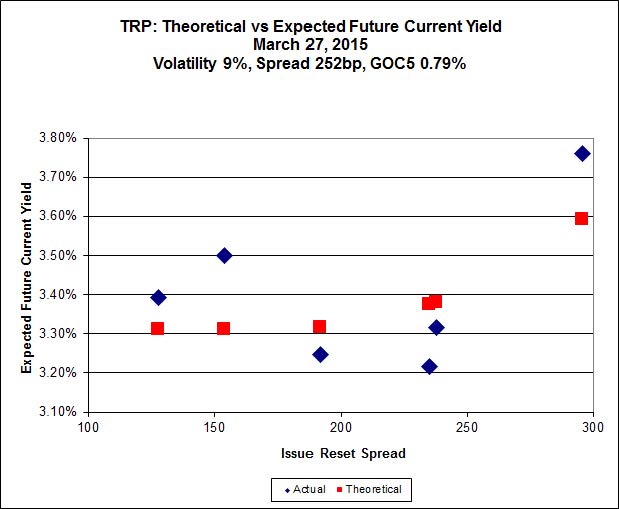
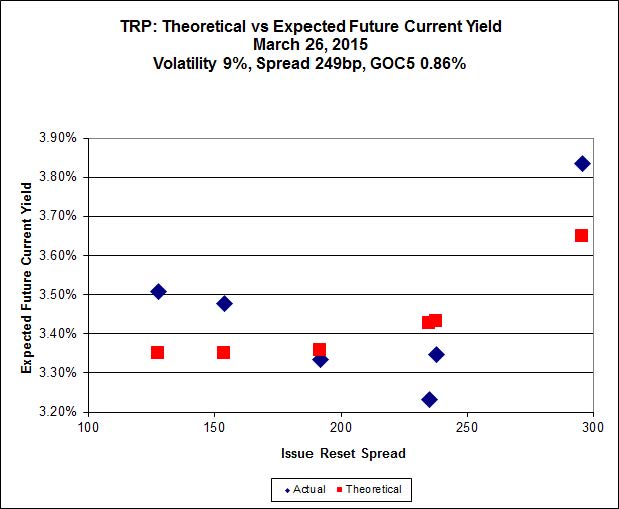
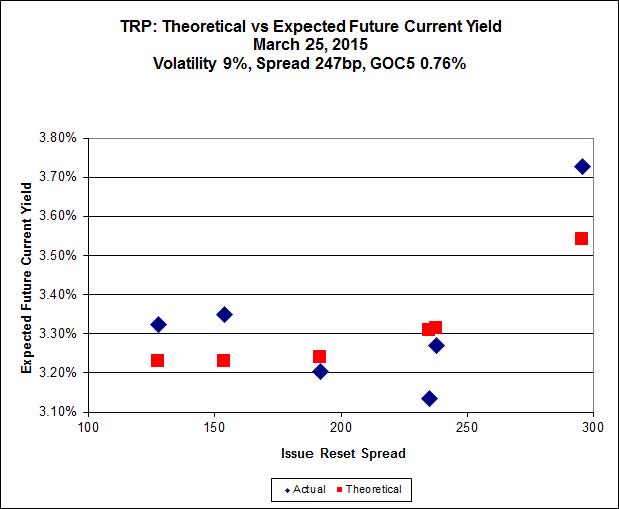
Here’s TRP:

Click for Big
TRP.PR.E, which resets 2019-10-30 at +235, is bid at 24.26 to be $1.12 rich, while TRP.PR.G, resetting 2020-11-30 at +296, is $1.13 cheap at its bid price of 24.90.
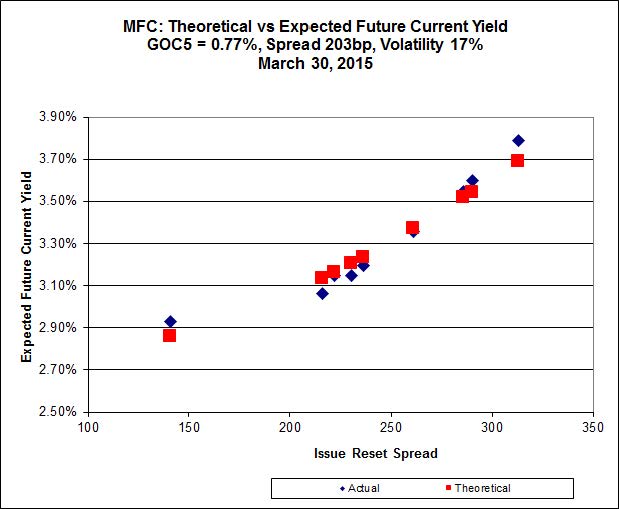
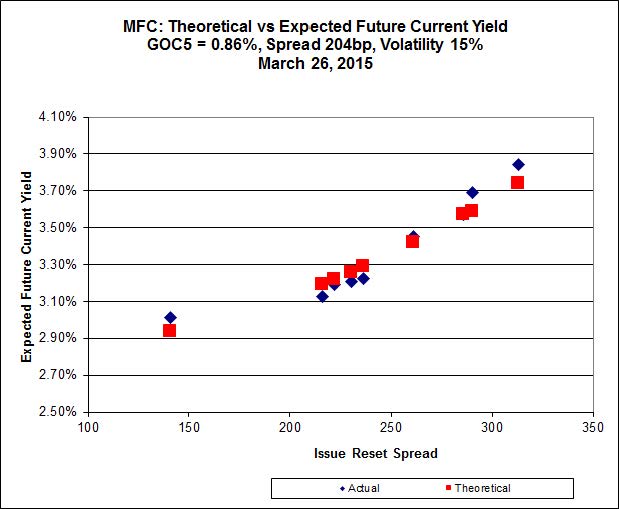
Click for Big
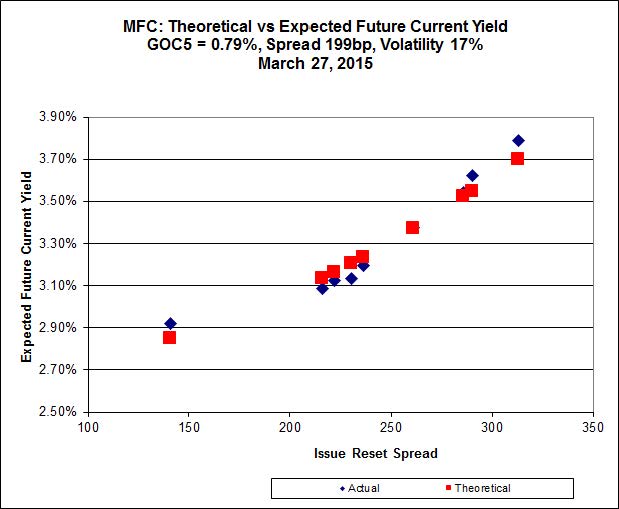
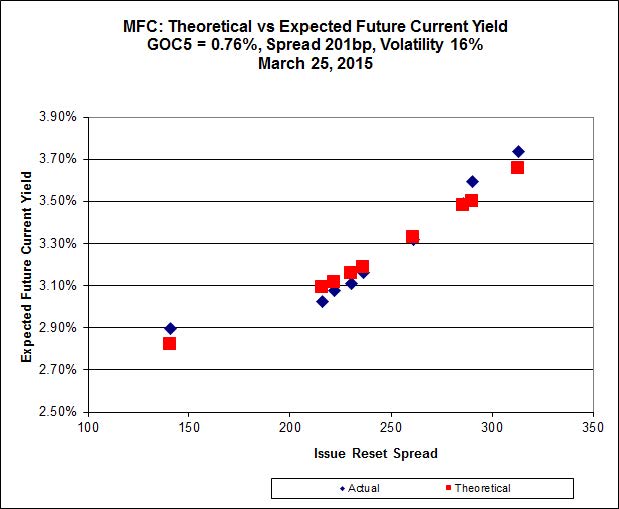
Another excellent fit, but the numbers are perplexing. Implied Volatility for MFC continues to be a conundrum, although it declined substantially today. It is still too high if we consider that NVCC rules will never apply to these issues; it is still too low if we consider them to be NVCC non-compliant issues (and therefore with Deemed Maturities in the call schedule).
Most expensive is MFC.PR.L, resetting at +216 on 2019-6-19, bid at 23.93 to be $0.56 rich, while MFC.PR.H, resetting at +313bp on 2017-3-19, is bid at 25.75 to be $0.69 cheap.
Click for Big
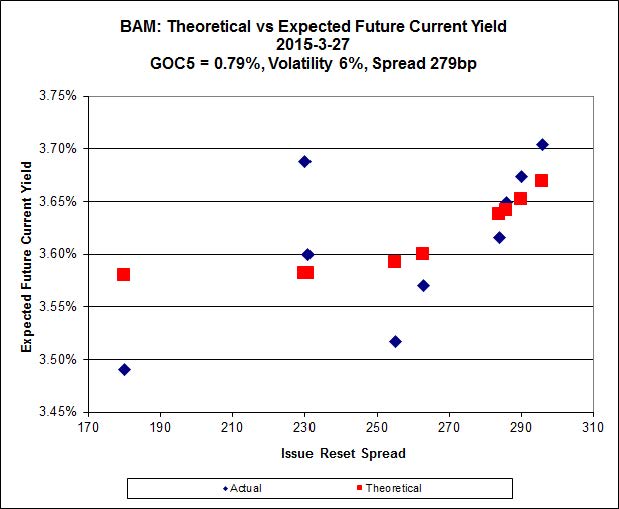
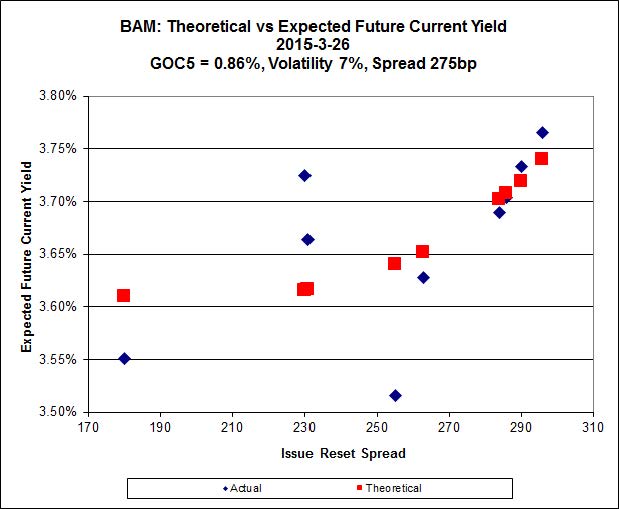
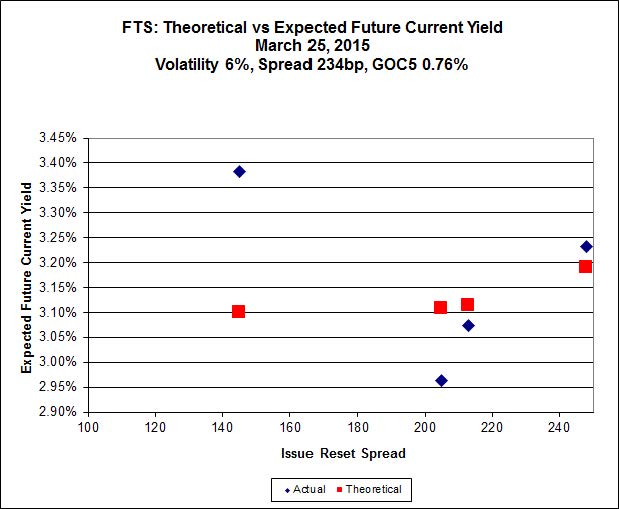
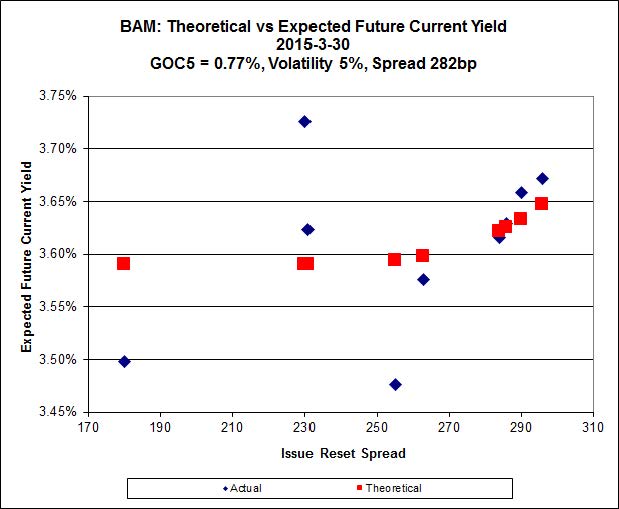
The fit on this series is actually quite reasonable – it’s the scale that makes it look so weird.
The cheapest issue relative to its peers is BAM.PR.R, resetting at +230bp on 2016-6-30, bid at 20.60 to be $0.78 cheap. BAM.PF.E, resetting at +255bp 2020-3-31 is bid at 23.88 and appears to be $0.78 rich.
Click for Big
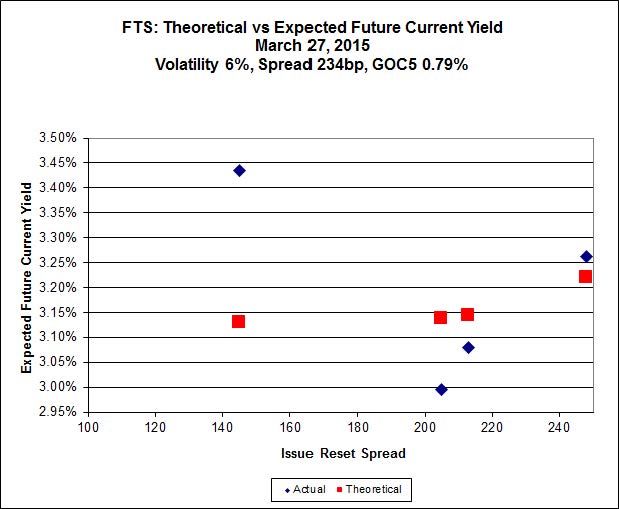
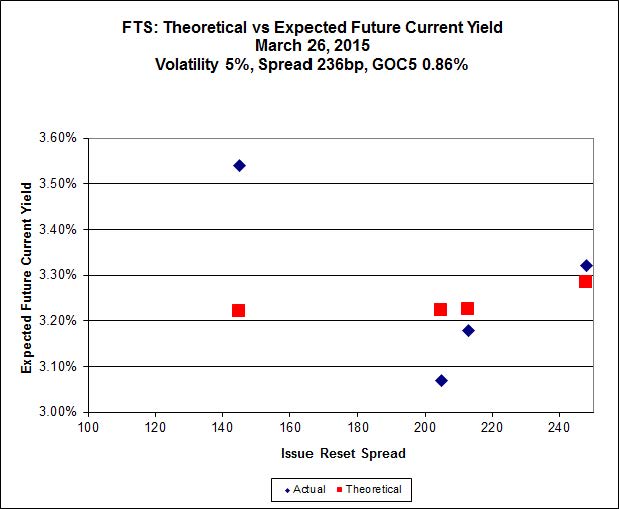
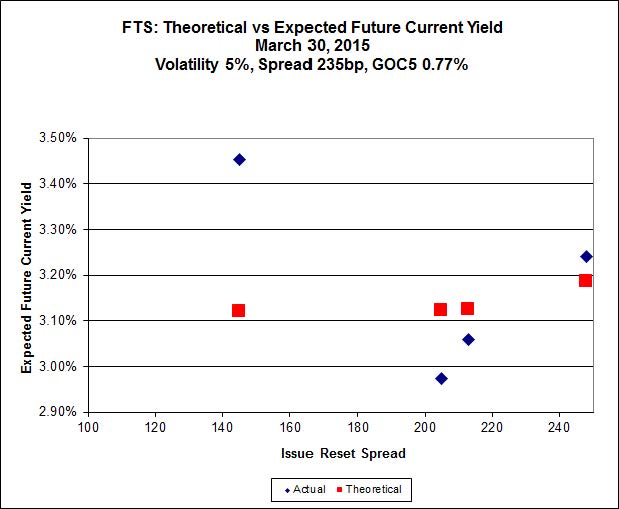
This is just weird because the middle is expensive and the ends are cheap but anyway … FTS.PR.H, with a spread of +145bp, and bid at 16.07, looks $1.72 cheap and resets 2015-6-1. FTS.PR.K, with a spread of +205bp and resetting 2019-3-1, is bid at 23.71 and is $1.13 rich.
Click for Big
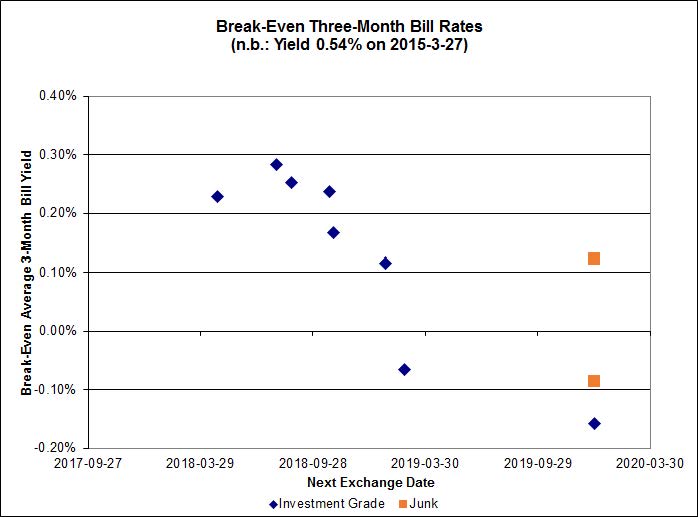
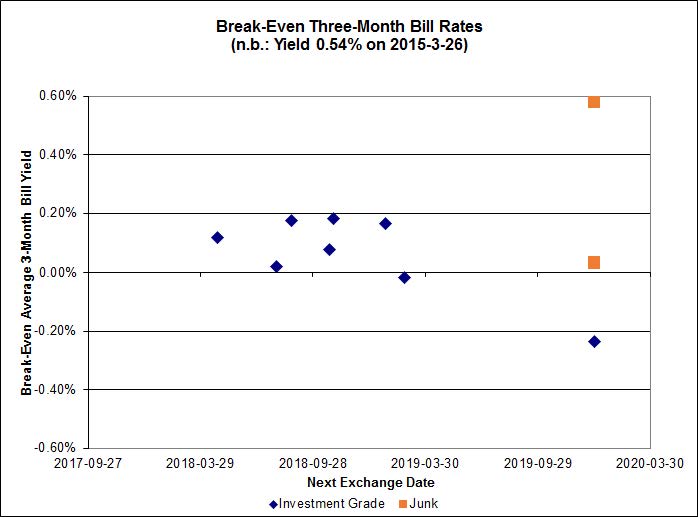
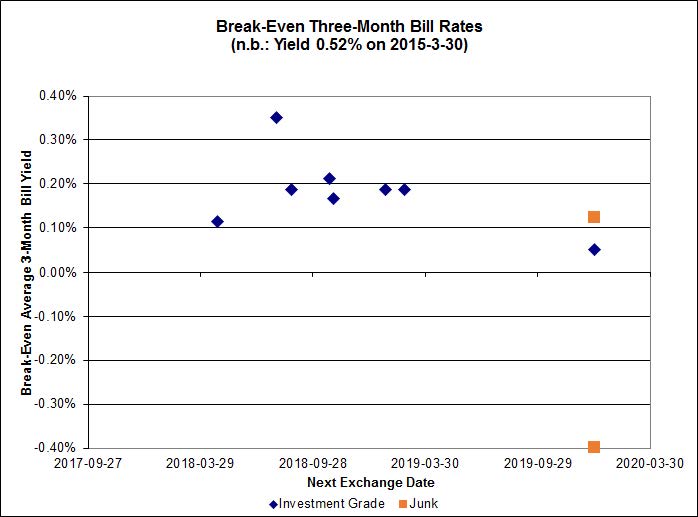
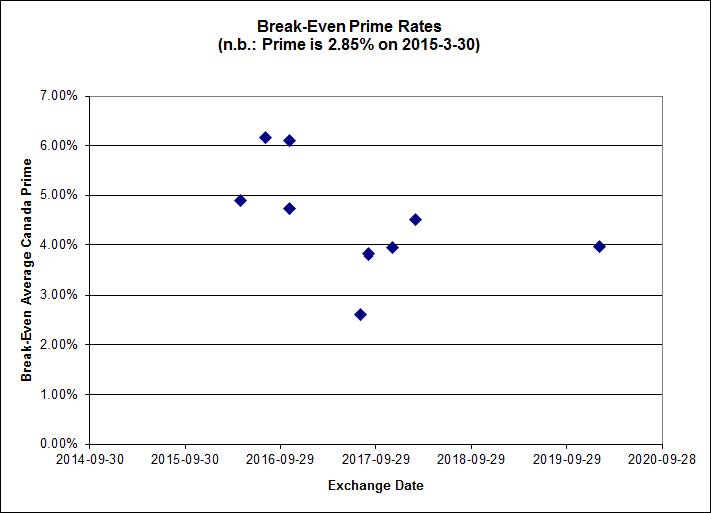
Investment-grade pairs predict an average over the next five years of about 0.20%. TRP.PR.A / TRP.PR.F has almost normalized, but remains an outlier at +0.05%. The DC.PR.B / DC.PR.D pair is still off the charts and now predicts an average bill rate over the next 4 3/4 years of -2.87%.
Tomorrow we’ll get two more data points for junk: AIM.PR.A / AIM.PR.B and FFH.PR.E / FFH.PR.F.
Click for Big
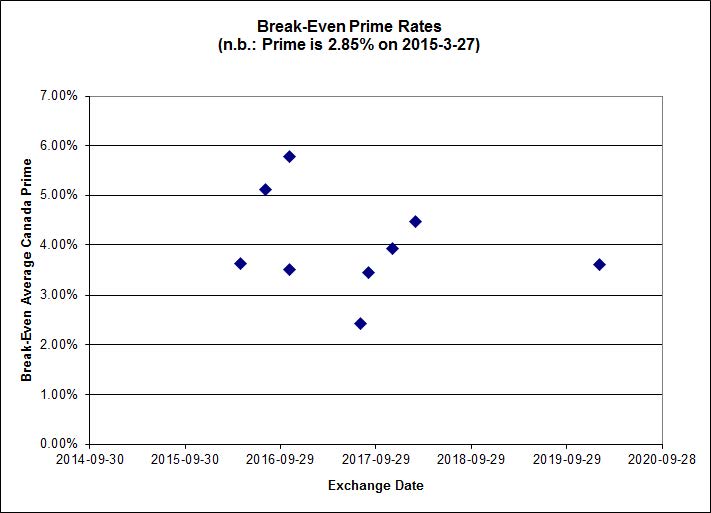
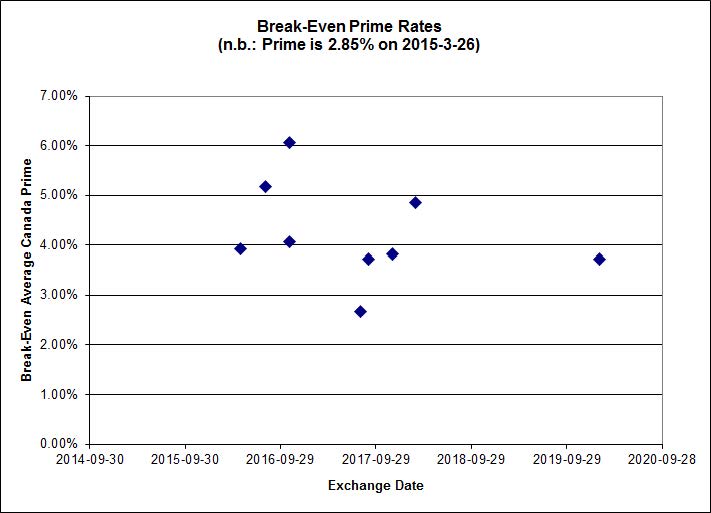
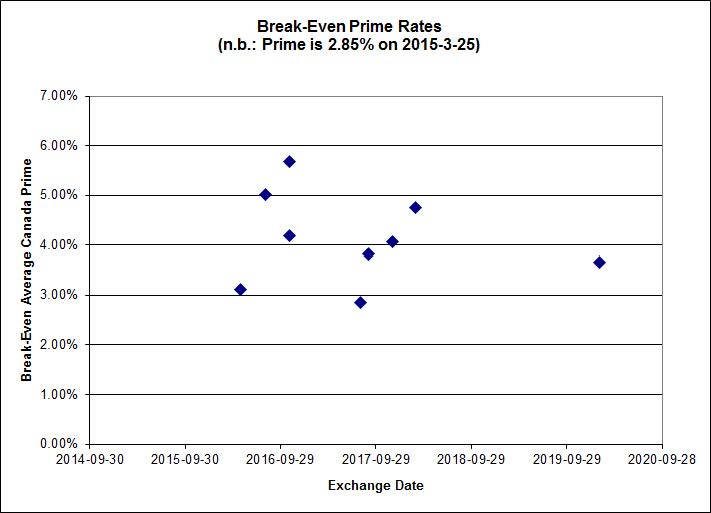
Shall we just say that this exhibits a high level of confidence in the continued rapacity of Canadian banks?
| HIMIPref™ Preferred Indices These values reflect the December 2008 revision of the HIMIPref™ Indices Values are provisional and are finalized monthly |
|||||||
| Index | Mean Current Yield (at bid) |
Median YTW |
Median Average Trading Value |
Median Mod Dur (YTW) |
Issues | Day’s Perf. | Index Value |
| Ratchet | 0.00 % | 0.00 % | 0 | 0.00 | 0 | -1.3085 % | 2,332.0 |
| FixedFloater | 0.00 % | 0.00 % | 0 | 0.00 | 0 | -1.3085 % | 4,077.5 |
| Floater | 3.25 % | 3.25 % | 64,608 | 19.09 | 3 | -1.3085 % | 2,479.1 |
| OpRet | 4.07 % | 1.40 % | 108,400 | 0.22 | 1 | -0.0794 % | 2,763.7 |
| SplitShare | 4.35 % | 4.21 % | 33,378 | 3.46 | 4 | 0.1198 % | 3,217.2 |
| Interest-Bearing | 0.00 % | 0.00 % | 0 | 0.00 | 0 | -0.0794 % | 2,527.1 |
| Perpetual-Premium | 5.31 % | -0.80 % | 57,957 | 0.08 | 25 | 0.0892 % | 2,525.9 |
| Perpetual-Discount | 4.97 % | 4.95 % | 158,734 | 15.22 | 9 | 0.1103 % | 2,818.5 |
| FixedReset | 4.41 % | 3.46 % | 250,790 | 16.54 | 85 | -0.3141 % | 2,415.4 |
| Deemed-Retractible | 4.90 % | 1.25 % | 110,100 | 0.15 | 37 | -0.1874 % | 2,657.9 |
| FloatingReset | 2.46 % | 2.84 % | 82,221 | 6.29 | 8 | 0.0688 % | 2,358.3 |
| Performance Highlights | |||
| Issue | Index | Change | Notes |
| ENB.PR.N | FixedReset | -2.42 % | YTW SCENARIO Maturity Type : Limit Maturity Maturity Date : 2045-03-30 Maturity Price : 20.17 Evaluated at bid price : 20.17 Bid-YTW : 4.43 % |
| TRP.PR.C | FixedReset | -2.34 % | YTW SCENARIO Maturity Type : Limit Maturity Maturity Date : 2045-03-30 Maturity Price : 16.25 Evaluated at bid price : 16.25 Bid-YTW : 3.67 % |
| ENB.PF.E | FixedReset | -1.71 % | YTW SCENARIO Maturity Type : Limit Maturity Maturity Date : 2045-03-30 Maturity Price : 21.29 Evaluated at bid price : 21.29 Bid-YTW : 4.39 % |
| BAM.PR.R | FixedReset | -1.67 % | YTW SCENARIO Maturity Type : Limit Maturity Maturity Date : 2045-03-30 Maturity Price : 20.60 Evaluated at bid price : 20.60 Bid-YTW : 3.92 % |
| BAM.PR.K | Floater | -1.55 % | YTW SCENARIO Maturity Type : Limit Maturity Maturity Date : 2045-03-30 Maturity Price : 15.25 Evaluated at bid price : 15.25 Bid-YTW : 3.27 % |
| ENB.PF.A | FixedReset | -1.49 % | YTW SCENARIO Maturity Type : Limit Maturity Maturity Date : 2045-03-30 Maturity Price : 21.20 Evaluated at bid price : 21.20 Bid-YTW : 4.38 % |
| BNS.PR.Y | FixedReset | -1.44 % | YTW SCENARIO Maturity Type : Hard Maturity Maturity Date : 2022-01-31 Maturity Price : 25.00 Evaluated at bid price : 21.85 Bid-YTW : 3.96 % |
| FTS.PR.H | FixedReset | -1.41 % | YTW SCENARIO Maturity Type : Limit Maturity Maturity Date : 2045-03-30 Maturity Price : 16.07 Evaluated at bid price : 16.07 Bid-YTW : 3.50 % |
| MFC.PR.K | FixedReset | -1.41 % | YTW SCENARIO Maturity Type : Hard Maturity Maturity Date : 2025-01-31 Maturity Price : 25.00 Evaluated at bid price : 23.76 Bid-YTW : 3.95 % |
| ENB.PR.J | FixedReset | -1.36 % | YTW SCENARIO Maturity Type : Limit Maturity Maturity Date : 2045-03-30 Maturity Price : 21.11 Evaluated at bid price : 21.11 Bid-YTW : 4.26 % |
| BAM.PR.T | FixedReset | -1.30 % | YTW SCENARIO Maturity Type : Limit Maturity Maturity Date : 2045-03-30 Maturity Price : 21.25 Evaluated at bid price : 21.25 Bid-YTW : 3.82 % |
| BAM.PR.B | Floater | -1.28 % | YTW SCENARIO Maturity Type : Limit Maturity Maturity Date : 2045-03-30 Maturity Price : 15.45 Evaluated at bid price : 15.45 Bid-YTW : 3.22 % |
| MFC.PR.F | FixedReset | -1.27 % | YTW SCENARIO Maturity Type : Hard Maturity Maturity Date : 2025-01-31 Maturity Price : 25.00 Evaluated at bid price : 18.61 Bid-YTW : 5.97 % |
| ENB.PF.G | FixedReset | -1.16 % | YTW SCENARIO Maturity Type : Limit Maturity Maturity Date : 2045-03-30 Maturity Price : 21.35 Evaluated at bid price : 21.35 Bid-YTW : 4.41 % |
| CIU.PR.C | FixedReset | -1.13 % | YTW SCENARIO Maturity Type : Limit Maturity Maturity Date : 2045-03-30 Maturity Price : 17.50 Evaluated at bid price : 17.50 Bid-YTW : 3.21 % |
| MFC.PR.C | Deemed-Retractible | -1.12 % | YTW SCENARIO Maturity Type : Hard Maturity Maturity Date : 2025-01-31 Maturity Price : 25.00 Evaluated at bid price : 23.93 Bid-YTW : 5.10 % |
| BAM.PR.C | Floater | -1.10 % | YTW SCENARIO Maturity Type : Limit Maturity Maturity Date : 2045-03-30 Maturity Price : 15.31 Evaluated at bid price : 15.31 Bid-YTW : 3.25 % |
| ENB.PR.T | FixedReset | -1.00 % | YTW SCENARIO Maturity Type : Limit Maturity Maturity Date : 2045-03-30 Maturity Price : 19.80 Evaluated at bid price : 19.80 Bid-YTW : 4.39 % |
| ENB.PR.F | FixedReset | 1.03 % | YTW SCENARIO Maturity Type : Limit Maturity Maturity Date : 2045-03-30 Maturity Price : 19.70 Evaluated at bid price : 19.70 Bid-YTW : 4.37 % |
| CGI.PR.D | SplitShare | 1.23 % | YTW SCENARIO Maturity Type : Soft Maturity Maturity Date : 2023-06-14 Maturity Price : 25.00 Evaluated at bid price : 25.61 Bid-YTW : 3.44 % |
| Volume Highlights | |||
| Issue | Index | Shares Traded |
Notes |
| ENB.PR.P | FixedReset | 138,628 | Desjardins crossed 126,000 at 20.00. YTW SCENARIO Maturity Type : Limit Maturity Maturity Date : 2045-03-30 Maturity Price : 19.91 Evaluated at bid price : 19.91 Bid-YTW : 4.35 % |
| BNS.PR.Z | FixedReset | 110,872 | Nesbitt crossed 100,000 at 23.70. YTW SCENARIO Maturity Type : Hard Maturity Maturity Date : 2022-01-31 Maturity Price : 25.00 Evaluated at bid price : 23.58 Bid-YTW : 3.38 % |
| CM.PR.Q | FixedReset | 101,360 | Recent new issue. YTW SCENARIO Maturity Type : Limit Maturity Maturity Date : 2045-03-30 Maturity Price : 23.09 Evaluated at bid price : 24.84 Bid-YTW : 3.49 % |
| TD.PF.D | FixedReset | 90,353 | Recent new issue. YTW SCENARIO Maturity Type : Limit Maturity Maturity Date : 2045-03-30 Maturity Price : 23.14 Evaluated at bid price : 25.00 Bid-YTW : 3.46 % |
| CM.PR.O | FixedReset | 88,715 | Scotia crossed two blocks of 40,000 each, both at 24.65. YTW SCENARIO Maturity Type : Limit Maturity Maturity Date : 2045-03-30 Maturity Price : 23.05 Evaluated at bid price : 24.55 Bid-YTW : 3.20 % |
| TRP.PR.G | FixedReset | 64,710 | Recent new issue. YTW SCENARIO Maturity Type : Limit Maturity Maturity Date : 2045-03-30 Maturity Price : 23.09 Evaluated at bid price : 24.90 Bid-YTW : 3.67 % |
| There were 36 other index-included issues trading in excess of 10,000 shares. | |||
| Wide Spread Highlights | ||
| Issue | Index | Quote Data and Yield Notes |
| ENB.PR.T | FixedReset | Quote: 19.80 – 20.30 Spot Rate : 0.5000 Average : 0.3640 YTW SCENARIO |
| ENB.PF.G | FixedReset | Quote: 21.35 – 21.73 Spot Rate : 0.3800 Average : 0.2516 YTW SCENARIO |
| BAM.PR.R | FixedReset | Quote: 20.60 – 20.90 Spot Rate : 0.3000 Average : 0.1799 YTW SCENARIO |
| MFC.PR.N | FixedReset | Quote: 24.40 – 24.69 Spot Rate : 0.2900 Average : 0.1720 YTW SCENARIO |
| MFC.PR.C | Deemed-Retractible | Quote: 23.93 – 24.25 Spot Rate : 0.3200 Average : 0.2138 YTW SCENARIO |
| BAM.PR.K | Floater | Quote: 15.25 – 15.73 Spot Rate : 0.4800 Average : 0.3827 YTW SCENARIO |
And finally, it seems to me that housing prices is related to wealth, whereas income inequality has increased and is measurable.