European deflation is significant:
Spanish consumer prices plunged for a second month in February, encapsulating the threat facing Mario Draghi as the European Central Bank prepares to unleash quantitative easing.
Prices fell 1.2 percent from a year earlier after a 1.5 percent decline in January, which was the biggest since 1997. The inflation rate was probably also negative in Italy and Germany, economists said before data due later on Friday.
Plunging oil costs have damped inflation across the globe, including in the U.S., where consumer prices posted their first annual decline in more than five years last month. In a positive sign, Spain’s February decline was less than economists had forecast and, with oil rising from its recent low, may indicate the worst of the inflation slump is passing.
However, some some parts of some economies are doing well:
Shares of South Korea’s leading condom maker soared for a second day after the country’s Constitutional Court decriminalized adultery in a ruling that ended a decades-old anti-cheating law.
Unidus Corp. was up 11 percent to 3,475 won at 12:55 p.m. Friday in Seoul. The stock rose 15 percent yesterday, leaving it up almost 30 percent since the ruling. Hyundai Pharmaceutical Co., a maker of morning-after pills, rose 10 percent yesterday to the highest in more than five years. The shares slid 7 percent Friday.
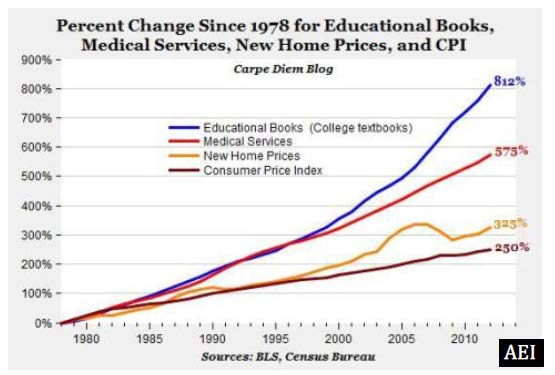
It has been a while since I complained about the ridiculous and economically counter-productive cost of education in the States (especially), so why don’t I complain about the ridiculous and economically counter-productive cost of education in the States (especially)?
Switching one of their dead-tree texts out for an open-source one—a book available for free online or to print at a minimal cost—saves students an average of $128 per course every semester, said the Student Public Interest Research Groups in a report (pdf) published Tuesday.
The Student PIRGs, a group of state student advocacy organizations, crunched data from five colleges that have introduced open textbook programs to estimate how much students save by using open books. With more than 11 million full-time undergraduates in the U.S., and upwards of 160 open textbooks on the market, the group says students would save $1 billion a year if they all replaced a single book with its open-source alternative.
The report, titled OPEN TEXTBOOKS: THE BILLION-DOLLAR SOLUTION, makes an interesting point:
With oft-exceeding $200 price tags, the cost of textbooks has become a serious barrier to college access and a negative impact on student success. A 2014 Student PIRGs studyiv found that 65% of students had skipped buying or renting a textbook because it was too expensive, and 94% of those students felt that doing so would hurt their grade in a course. Additionally, nearly half of students said the cost of textbooks impacted how many courses they were able to take.
 Click for Big
Now, I think the analysis regarding potential savings is optimistic to the point of being simplistic. The proposed replacement is ‘Open Textbooks’, which are described as:
Open textbooks are faculty-written, peer-reviewed textbooks that are published under an open license – meaning that they are available free online, they are free to download, and print copies are available at $10-40, or approximately the cost of printing.
So they’re not including any allowance for paying the authors or the reviewers or the editors; there’s also no accounting made for kickbacks to administrators, professors or the institution for choosing and approving the book; there’s no accounting for elegant dinner parties with hot saleschicks from the publisher; and there’s no accounting for the creation and maintenance of the very popular ‘test-banks’, whereby questions and answers for tests are maintained by the publisher so that lazy instructors don’t have to do any work. All these things are vital to the education of young minds, who represent our hope for the future, and regrettably these things require significant investment if they’re going to be done right. So it’s an optimistic analysis, but I find it very difficult to believe that more than a fraction of the charted increase in price since my day is due to quality improvements in second-year organic chemistry or first year calculus texts!
Pembina Pipelines, proud issuer of PPL.PR.A, PPL.PR.C, PPL.PR.E and PPL.PR.G, was confirmed at Pfd-3 by DBRS:
DBRS Limited (DBRS) has today confirmed the Issuer Rating and Senior Unsecured Notes of Pembina Pipeline Corporation (Pembina or the Company) at BBB, and the Preferred Shares at Pfd-3. The trends remain Stable. The confirmation largely reflects DBRS’s view that the Company’s exposure to fractionation (frac) spreads and seasonal pricing differentials has lowered since the closing of the Provident acquisition (the Acquisition) in 2012 and has been maintained at a manageable level. The confirmation also reflects DBRS’s expectation that Pembina will continue to prudently manage its project expansion risk and to finance its expansion with appropriate debt and equity to maintain its debt-to-capital ratio at around 40% and cash flow-to-debt ratio at or above 25%. However, the rating trends could be changed to Positive if the Company successfully and substantially completes its current major expansion projects (backed by long-term take-or-pay or fee for service (FFS) contracts) while maintaining its credit metrics at or near the current level.
Allbanc Split Corp. II, proud issuer of ALB.PR.B, was confirmed at Pfd-2 by DBRS:
Since the last rating action in February 2014, the performance of the Company has been volatile. The trend seen in the net asset value, however, is in line with the movement seen in the volatile share prices of Canadian banks. Downside protection increased steadily to 64.1% on February 12, 2015, from 60.9% on February 13, 2014, while increases in dividend distributions from underlying banks helped boost the dividend coverage ratio.
It was a positive day for the Canadian preferred share market, with PerpetualDiscounts winning 25bp, FixedResets gaining 5bp and DeemedRetractibles up 6bp. The Performance Highlights table was quite lengthy with the credit-dubious ENB issues prominent on the winning side. Volume was very high.
For as long as the FixedReset market is so violently unsettled, I’ll keep publishing updates of the more interesting and meaningful series of FixedResets’ Implied Volatilities. This doesn’t include Enbridge because although Enbridge has a large number of issues outstanding, all of which are quite liquid, the range of Issue Reset Spreads is too small for decent conclusions. The low is 212bp (ENB.PR.H; second-lowest is ENB.PR.D at 237bp) and the high is a mere 268 for ENB.PF.G.
Remember that all rich /cheap assessments are:
» based on Implied Volatility Theory only
» are relative only to other FixedResets from the same issuer
» assume constant GOC-5 yield
» assume constant Implied Volatility
» assume constant spread
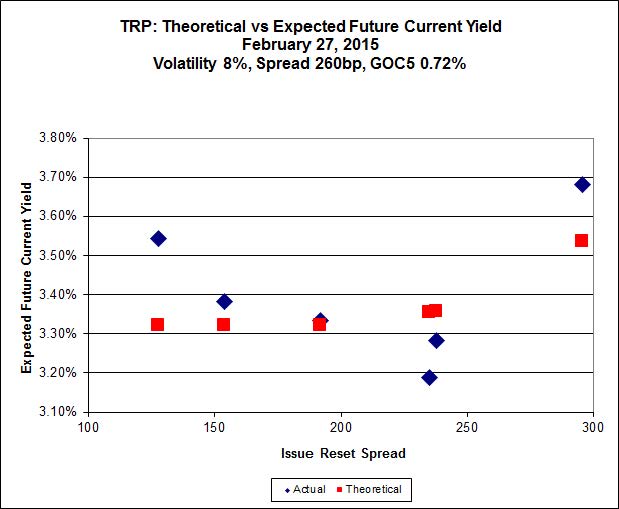
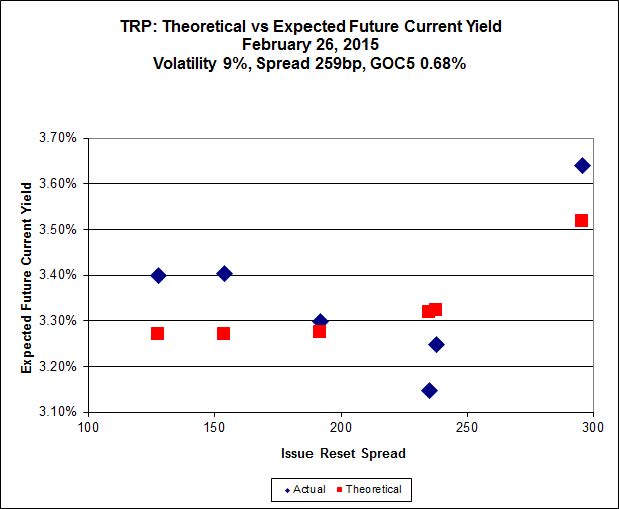
Here’s TRP:
 Click for Big
The new issue has caused a large change in the curve-fitting for the TRP series of FixedResets, which is discussed at greater length on the post announcing the new issue. TRP.PR.E, which resets 2019-10-30 at +235, is bid at 24.07 to be $1.18 rich, while the new issue, resetting 2020-11-30 at +296, is $1.02 cheap at its issue price of 25.00.
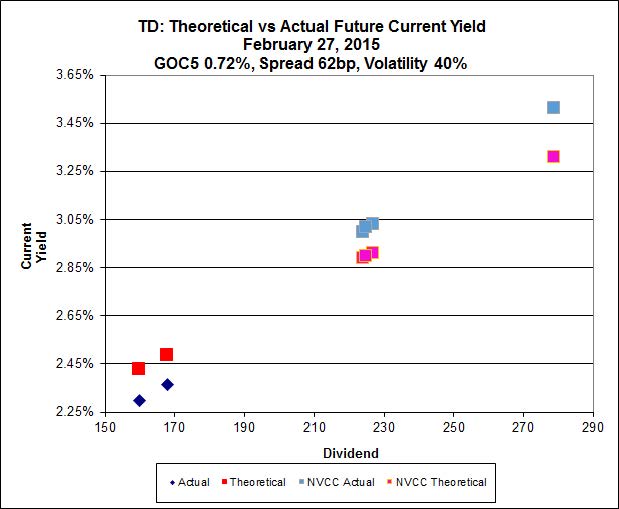
 Click for Big
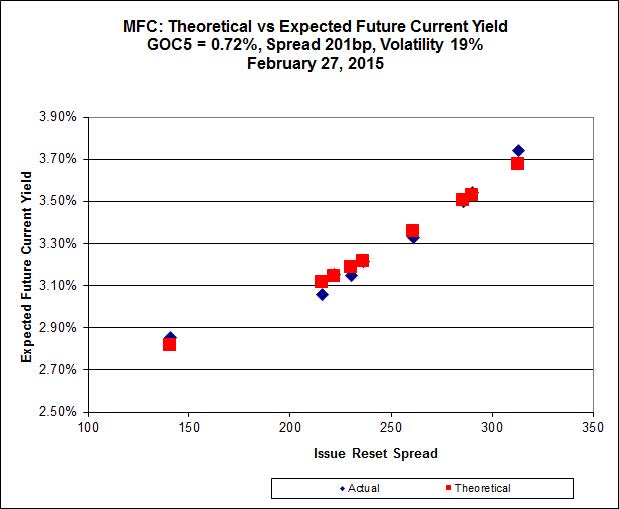
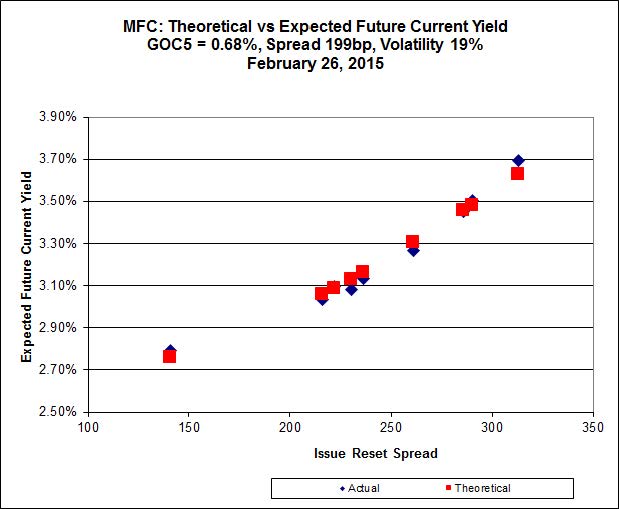
Another excellent fit, but the numbers are perplexing. Implied Volatility for MFC continues to be a conundrum, although it declined substantially today. It is still too high if we consider that NVCC rules will never apply to these issues; it is still too low if we consider them to be NVCC non-compliant issues (and therefore with Deemed Maturities in the call schedule).
Most expensive is MFC.PR.L, resetting at +216 on 2019-6-19, bid at 23.55 to be $0.43 rich, while MFC.PR.H, resetting at +313bp on 2017-3-19, is bid at 25.73 to be $0.47 cheap.
 Click for Big
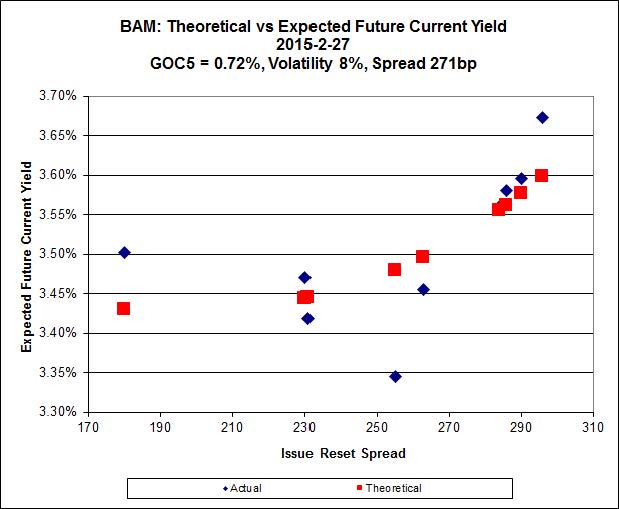
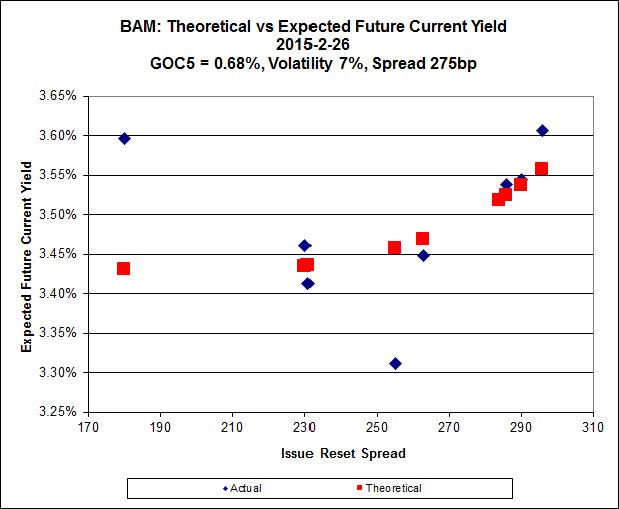
The fit on this series is actually quite reasonable – it’s the scale that makes it look so weird.
The cheapest issue relative to its peers is BAM.PR.Z, resetting at +296bp on 2017-12-31, bid at 25.05 to be $0.52 cheap. BAM.PF.E, resetting at +255bp 2020-3-31 is bid at 24.44 and appears to be $0.95 rich.
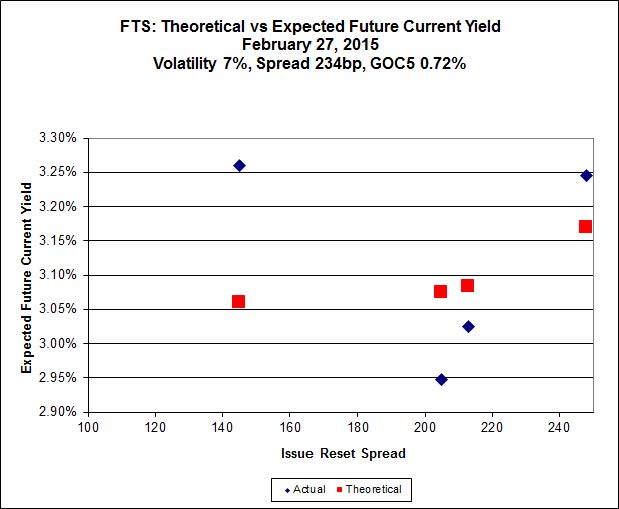
 Click for Big
This is just weird because the middle is expensive and the ends are cheap but anyway … FTS.PR.H, with a spread of +145bp, and bid at 16.64, looks $1.09 cheap and resets 2015-6-1. FTS.PR.K, with a spread of +205bp and resetting 2019-3-1, is bid at 23.50 and is $0.97 rich.
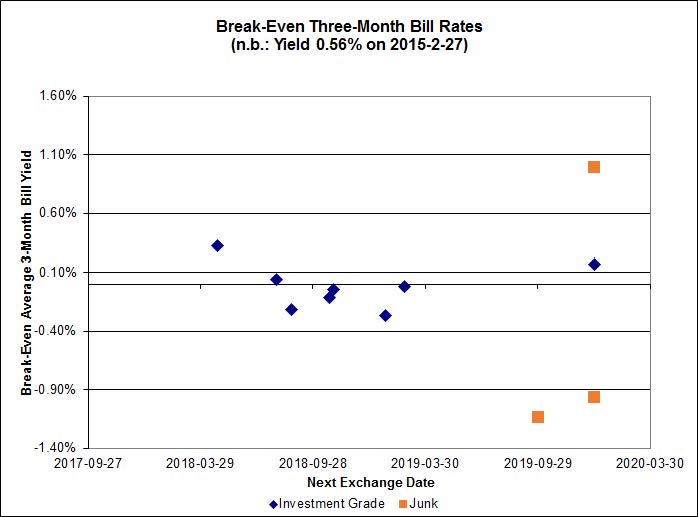
 Click for Big
The investment grade break-even rates average close to zero.
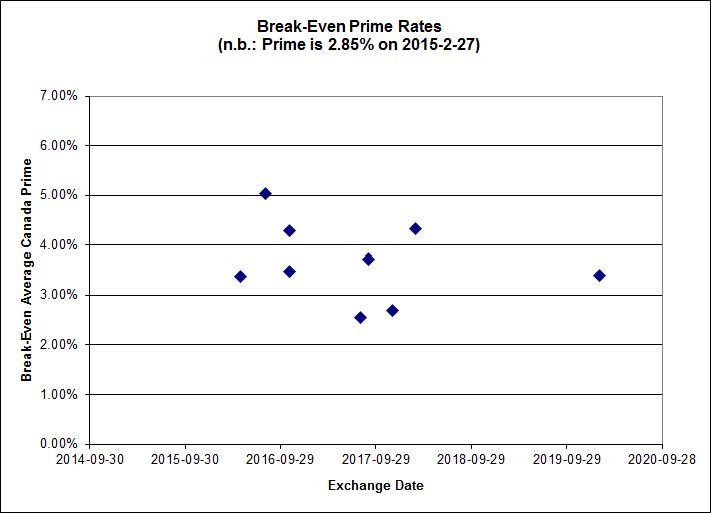
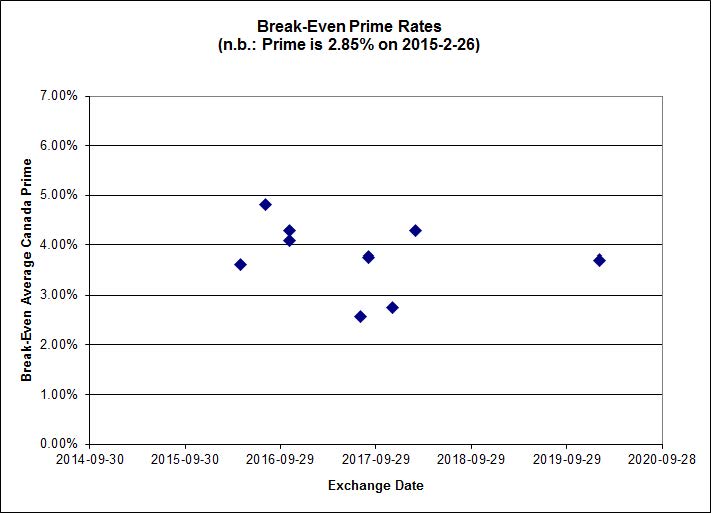
On the other hand, the market’s distaste for product linked to Money Market rates does not extend to prime, as shown by the FixedFloater/RatchetRate pairs:
 Click for Big
Shall we just say that this exhibits a high level of confidence in the continued rapacity of Canadian banks?
One way or another, that’s it for another month!
HIMIPref™ Preferred Indices
These values reflect the December 2008 revision of the HIMIPref™ Indices
Values are provisional and are finalized monthly |
| Index |
Mean
Current
Yield
(at bid) |
Median
YTW |
Median
Average
Trading
Value |
Median
Mod Dur
(YTW) |
Issues |
Day’s Perf. |
Index Value |
| Ratchet |
0.00 % |
0.00 % |
0 |
0.00 |
0 |
0.3781 % |
2,302.6 |
| FixedFloater |
4.39 % |
3.53 % |
18,581 |
18.35 |
1 |
-0.3683 % |
4,026.1 |
| Floater |
3.13 % |
3.27 % |
63,901 |
19.01 |
4 |
0.3781 % |
2,447.9 |
| OpRet |
4.08 % |
1.80 % |
110,194 |
0.31 |
1 |
-0.1193 % |
2,757.1 |
| SplitShare |
4.41 % |
4.29 % |
28,777 |
3.55 |
6 |
-0.2581 % |
3,211.7 |
| Interest-Bearing |
0.00 % |
0.00 % |
0 |
0.00 |
0 |
-0.1193 % |
2,521.1 |
| Perpetual-Premium |
5.32 % |
-2.66 % |
56,585 |
0.08 |
24 |
0.0359 % |
2,516.2 |
| Perpetual-Discount |
4.94 % |
4.87 % |
106,451 |
15.13 |
10 |
0.2546 % |
2,802.9 |
| FixedReset |
4.45 % |
3.44 % |
219,731 |
16.91 |
78 |
0.0453 % |
2,402.9 |
| Deemed-Retractible |
4.93 % |
0.18 % |
104,873 |
0.16 |
39 |
0.0567 % |
2,651.5 |
| FloatingReset |
2.43 % |
2.85 % |
96,501 |
6.38 |
7 |
0.0062 % |
2,326.8 |
| Performance Highlights |
| Issue |
Index |
Change |
Notes |
| SLF.PR.H |
FixedReset |
-4.90 % |
YTW SCENARIO
Maturity Type : Hard Maturity
Maturity Date : 2025-01-31
Maturity Price : 25.00
Evaluated at bid price : 22.50
Bid-YTW : 4.21 % |
| TRP.PR.B |
FixedReset |
-2.15 % |
YTW SCENARIO
Maturity Type : Limit Maturity
Maturity Date : 2045-02-27
Maturity Price : 14.11
Evaluated at bid price : 14.11
Bid-YTW : 3.43 % |
| CGI.PR.D |
SplitShare |
-1.52 % |
YTW SCENARIO
Maturity Type : Soft Maturity
Maturity Date : 2023-06-14
Maturity Price : 25.00
Evaluated at bid price : 25.31
Bid-YTW : 3.57 % |
| FTS.PR.H |
FixedReset |
-1.30 % |
YTW SCENARIO
Maturity Type : Limit Maturity
Maturity Date : 2045-02-27
Maturity Price : 16.64
Evaluated at bid price : 16.64
Bid-YTW : 3.18 % |
| MFC.PR.M |
FixedReset |
-1.28 % |
YTW SCENARIO
Maturity Type : Hard Maturity
Maturity Date : 2025-01-31
Maturity Price : 25.00
Evaluated at bid price : 23.95
Bid-YTW : 3.98 % |
| PWF.PR.T |
FixedReset |
-1.20 % |
YTW SCENARIO
Maturity Type : Limit Maturity
Maturity Date : 2045-02-27
Maturity Price : 23.15
Evaluated at bid price : 24.70
Bid-YTW : 3.17 % |
| SLF.PR.G |
FixedReset |
-1.14 % |
YTW SCENARIO
Maturity Type : Hard Maturity
Maturity Date : 2025-01-31
Maturity Price : 25.00
Evaluated at bid price : 17.30
Bid-YTW : 6.28 % |
| VNR.PR.A |
FixedReset |
-1.05 % |
YTW SCENARIO
Maturity Type : Limit Maturity
Maturity Date : 2045-02-27
Maturity Price : 23.23
Evaluated at bid price : 24.44
Bid-YTW : 3.61 % |
| BAM.PF.B |
FixedReset |
1.00 % |
YTW SCENARIO
Maturity Type : Limit Maturity
Maturity Date : 2045-02-27
Maturity Price : 22.95
Evaluated at bid price : 24.24
Bid-YTW : 3.52 % |
| ENB.PR.T |
FixedReset |
1.00 % |
YTW SCENARIO
Maturity Type : Limit Maturity
Maturity Date : 2045-02-27
Maturity Price : 20.20
Evaluated at bid price : 20.20
Bid-YTW : 4.15 % |
| BAM.PR.R |
FixedReset |
1.07 % |
YTW SCENARIO
Maturity Type : Limit Maturity
Maturity Date : 2045-02-27
Maturity Price : 21.43
Evaluated at bid price : 21.76
Bid-YTW : 3.60 % |
| FTS.PR.G |
FixedReset |
1.07 % |
YTW SCENARIO
Maturity Type : Limit Maturity
Maturity Date : 2045-02-27
Maturity Price : 22.69
Evaluated at bid price : 23.55
Bid-YTW : 3.08 % |
| BAM.PR.T |
FixedReset |
1.19 % |
YTW SCENARIO
Maturity Type : Limit Maturity
Maturity Date : 2045-02-27
Maturity Price : 21.70
Evaluated at bid price : 22.16
Bid-YTW : 3.53 % |
| ENB.PR.B |
FixedReset |
1.28 % |
YTW SCENARIO
Maturity Type : Limit Maturity
Maturity Date : 2045-02-27
Maturity Price : 18.92
Evaluated at bid price : 18.92
Bid-YTW : 4.20 % |
| ENB.PR.P |
FixedReset |
1.30 % |
YTW SCENARIO
Maturity Type : Limit Maturity
Maturity Date : 2045-02-27
Maturity Price : 20.26
Evaluated at bid price : 20.26
Bid-YTW : 4.12 % |
| ENB.PR.D |
FixedReset |
1.33 % |
YTW SCENARIO
Maturity Type : Limit Maturity
Maturity Date : 2045-02-27
Maturity Price : 19.05
Evaluated at bid price : 19.05
Bid-YTW : 4.18 % |
| ENB.PR.N |
FixedReset |
1.38 % |
YTW SCENARIO
Maturity Type : Limit Maturity
Maturity Date : 2045-02-27
Maturity Price : 20.62
Evaluated at bid price : 20.62
Bid-YTW : 4.19 % |
| MFC.PR.C |
Deemed-Retractible |
1.40 % |
YTW SCENARIO
Maturity Type : Hard Maturity
Maturity Date : 2025-01-31
Maturity Price : 25.00
Evaluated at bid price : 23.94
Bid-YTW : 5.04 % |
| ENB.PF.G |
FixedReset |
1.56 % |
YTW SCENARIO
Maturity Type : Limit Maturity
Maturity Date : 2045-02-27
Maturity Price : 22.11
Evaluated at bid price : 22.75
Bid-YTW : 3.95 % |
| ENB.PR.Y |
FixedReset |
1.66 % |
YTW SCENARIO
Maturity Type : Limit Maturity
Maturity Date : 2045-02-27
Maturity Price : 19.57
Evaluated at bid price : 19.57
Bid-YTW : 4.18 % |
| ENB.PR.F |
FixedReset |
2.11 % |
YTW SCENARIO
Maturity Type : Limit Maturity
Maturity Date : 2045-02-27
Maturity Price : 19.81
Evaluated at bid price : 19.81
Bid-YTW : 4.19 % |
| TRP.PR.C |
FixedReset |
2.39 % |
YTW SCENARIO
Maturity Type : Limit Maturity
Maturity Date : 2045-02-27
Maturity Price : 16.70
Evaluated at bid price : 16.70
Bid-YTW : 3.44 % |
| ENB.PF.E |
FixedReset |
2.63 % |
YTW SCENARIO
Maturity Type : Limit Maturity
Maturity Date : 2045-02-27
Maturity Price : 22.03
Evaluated at bid price : 22.60
Bid-YTW : 3.95 % |
| BAM.PR.X |
FixedReset |
4.35 % |
YTW SCENARIO
Maturity Type : Limit Maturity
Maturity Date : 2045-02-27
Maturity Price : 17.99
Evaluated at bid price : 17.99
Bid-YTW : 3.82 % |
| Volume Highlights |
| Issue |
Index |
Shares
Traded |
Notes |
| TD.PR.S |
FixedReset |
110,811 |
YTW SCENARIO
Maturity Type : Hard Maturity
Maturity Date : 2022-01-31
Maturity Price : 25.00
Evaluated at bid price : 25.20
Bid-YTW : 2.75 % |
| ENB.PR.N |
FixedReset |
86,411 |
YTW SCENARIO
Maturity Type : Limit Maturity
Maturity Date : 2045-02-27
Maturity Price : 20.62
Evaluated at bid price : 20.62
Bid-YTW : 4.19 % |
| RY.PR.J |
FixedReset |
83,900 |
YTW SCENARIO
Maturity Type : Limit Maturity
Maturity Date : 2045-02-27
Maturity Price : 23.13
Evaluated at bid price : 24.95
Bid-YTW : 3.33 % |
| TD.PF.A |
FixedReset |
64,674 |
YTW SCENARIO
Maturity Type : Limit Maturity
Maturity Date : 2045-02-27
Maturity Price : 23.04
Evaluated at bid price : 24.59
Bid-YTW : 3.05 % |
| BMO.PR.S |
FixedReset |
58,669 |
YTW SCENARIO
Maturity Type : Limit Maturity
Maturity Date : 2045-02-27
Maturity Price : 23.17
Evaluated at bid price : 24.85
Bid-YTW : 3.07 % |
| NA.PR.W |
FixedReset |
57,425 |
YTW SCENARIO
Maturity Type : Limit Maturity
Maturity Date : 2045-02-27
Maturity Price : 23.06
Evaluated at bid price : 24.70
Bid-YTW : 3.04 % |
| There were 51 other index-included issues trading in excess of 10,000 shares. |
| Wide Spread Highlights |
| Issue |
Index |
Quote Data and Yield Notes |
| SLF.PR.H |
FixedReset |
Quote: 22.50 – 23.24
Spot Rate : 0.7400
Average : 0.4519
YTW SCENARIO
Maturity Type : Hard Maturity
Maturity Date : 2025-01-31
Maturity Price : 25.00
Evaluated at bid price : 22.50
Bid-YTW : 4.21 % |
| TRP.PR.E |
FixedReset |
Quote: 24.07 – 24.50
Spot Rate : 0.4300
Average : 0.2757
YTW SCENARIO
Maturity Type : Limit Maturity
Maturity Date : 2045-02-27
Maturity Price : 22.83
Evaluated at bid price : 24.07
Bid-YTW : 3.33 % |
| TRP.PR.F |
FloatingReset |
Quote: 18.60 – 19.25
Spot Rate : 0.6500
Average : 0.5039
YTW SCENARIO
Maturity Type : Limit Maturity
Maturity Date : 2045-02-27
Maturity Price : 18.60
Evaluated at bid price : 18.60
Bid-YTW : 3.20 % |
| BNS.PR.C |
FloatingReset |
Quote: 23.83 – 24.14
Spot Rate : 0.3100
Average : 0.1960
YTW SCENARIO
Maturity Type : Hard Maturity
Maturity Date : 2022-01-31
Maturity Price : 25.00
Evaluated at bid price : 23.83
Bid-YTW : 3.07 % |
| HSE.PR.A |
FixedReset |
Quote: 17.56 – 17.99
Spot Rate : 0.4300
Average : 0.3274
YTW SCENARIO
Maturity Type : Limit Maturity
Maturity Date : 2045-02-27
Maturity Price : 17.56
Evaluated at bid price : 17.56
Bid-YTW : 3.60 % |
| ENB.PF.A |
FixedReset |
Quote: 22.25 – 22.59
Spot Rate : 0.3400
Average : 0.2452
YTW SCENARIO
Maturity Type : Limit Maturity
Maturity Date : 2045-02-27
Maturity Price : 21.82
Evaluated at bid price : 22.25
Bid-YTW : 4.00 % |


