Archive for December, 2009

HIMIPref™ Index Rebalancing: December 2009

Thursday, December 31st, 2009
HIMI Index Changes, December 31, 2009
Issue From To Because
TD.PR.Q PerpetualDiscount PerpetualPremium Price
TD.PR.R PerpetualDiscount PerpetualPremium Price
RY.PR.H PerpetualDiscount PerpetualPremium Price
NA.PR.K PerpetualDiscount PerpetualPremium Price
PWF.PR.I PerpetualDiscount PerpetualPremium Price
BMO.PR.L PerpetualDiscount PerpetualPremium Price
IAG.PR.E PerpetualDiscount PerpetualPremium Price
GWO.PR.F PerpetualPremium PerpetualDiscount Price
PWF.PR.G PerpetualPremium PerpetualDiscount Price

There were the following intra-month changes:

HIMI Index Changes during December 2009
Issue Action Index Because
STW.PR.A Delete Scraps Matured
IGM.PR.B Add PerpetualDiscount New Issue
YPG.PR.D Add Scraps New Issue

December 31, 2009

Thursday, December 31st, 2009

James Hamilton of Econbrowser has an excellent post on the Fed and the proposed term deposit facility:

We sometimes describe fiscal policy as determining the overall level of the public debt, while monetary policy determines the composition of that debt between money and interest-bearing federal obligations. By that definition, the Fed has clearly now entered the realm of implementing fiscal policy, by issuing debt directly in the form of interest-bearing reserves, reverse repos, and now term deposits.

But I fear that as this marriage between fiscal and monetary policy becomes consummated, an amicable divorce is not the most likely outcome.

My advice would be the sooner the Fed can return to plain vanilla central banking, the better.

I have heard reports that driving in the country has become a process of counting windmills … but I have my own way of counting. Say a standard wind farm has the following specifications:

The facility is expected to be completed in one year at a cost of CA$285 million, and will generate 300 GWh of wind energy a year from 43 Siemens 2.3 MW turbines.

So each turbine costs about $7-million bucks and generates about 7.5 GWh electricity per year. Ontario will pay 13.5 cents per kWh for on-shore wind. A profligate energy user (i.e., somebody who uses a toaster while the kitchen light is on) will pay 6.7 cents per kWh. So the loss to Smitherman’s ex-ministry is … call it 7 cents per kWh … and remember, we have assumed that transmission and administration is free, never mind the fact that wind power needs back-up plants built, and will accrue extra costs as this back-up switches on and off.

So, a loss of 7 cents per kWh on 7.5GWh annually is … um … carry three … 52.5 megacents per annum; in more familiar units, over half a million bucks. Enjoy the view! And remember – it’s not just empty-headed feel-goodism … it’s also an exciting new class of parasitic pseudo-industry creating jobs for pseudo-entrepreneurs!

The US Municipal Bond Insurance market is still trying to find its feet:

Insured bonds reached a peak of 57.1% of new issuance in 2005, but as most insurers were downgraded after they unsuccessfully ventured into the hazardous territory of structured finance, that number dwindled to just 8.7% this month, according to Thomson Reuters.

But responding to claims that the insurance market has a much-diminished future, Dominic Frederico, chief executive officer of Assured Guaranty Ltd., has a pretty simple reply.

“If there are naysayers, I would say, ‘Okay, then: explain my third quarter,’ ” he told investors in a conference call last month.

Assured, which operates the only two legacy insurers to have made it through the recession with investment-grade ratings, saw operating earnings — excluding net-realized investment gains and losses — jump to $70 million last quarter, compared to $26 million in the third quarter of 2008.

Preferred shares closed the year strongly on light volume, with PerpetualDiscounts up 26bp and FixedResets gaining 13bp.

PereptualDiscounts closed yielding 5.85%, equivalent to 8.19% interest at the standard equivalency factor of 1.4x. Long Corporates closed yielding 6.0% – maybe just a hair over – so the pre-tax interest-equivalent spread (also called the Seniority Spread) is about 220bp, a slight tightening from the December 16 and November 30 figures of 225bp.

HIMIPref™ Preferred Indices
These values reflect the December 2008 revision of the HIMIPref™ Indices

Values are provisional and are finalized monthly
Index Mean
Current
Yield
(at bid)
Median
YTW
Median
Average
Trading
Value
Median
Mod Dur
(YTW)
Issues Day’s Perf. Index Value
Ratchet 0.00 % 0.00 % 0 0.00 0 0.3484 % 1,626.4
FixedFloater 5.69 % 3.84 % 37,404 18.97 1 -0.4690 % 2,736.4
Floater 2.41 % 2.82 % 106,796 20.16 3 0.3484 % 2,031.8
OpRet 4.83 % -1.09 % 115,458 0.09 15 0.0406 % 2,333.8
SplitShare 6.40 % -6.01 % 189,048 0.08 2 0.6219 % 2,098.6
Interest-Bearing 0.00 % 0.00 % 0 0.00 0 0.0406 % 2,134.0
Perpetual-Premium 5.83 % 5.71 % 73,799 2.30 7 0.2659 % 1,891.1
Perpetual-Discount 5.79 % 5.85 % 188,197 14.11 68 0.2613 % 1,804.6
FixedReset 5.39 % 3.59 % 312,272 3.85 41 0.1268 % 2,177.5
Performance Highlights
Issue Index Change Notes
BMO.PR.K Perpetual-Discount -1.06 % YTW SCENARIO
Maturity Type : Limit Maturity
Maturity Date : 2039-12-31
Maturity Price : 23.22
Evaluated at bid price : 23.40
Bid-YTW : 5.68 %
CL.PR.B Perpetual-Premium 1.01 % YTW SCENARIO
Maturity Type : Call
Maturity Date : 2010-01-30
Maturity Price : 25.25
Evaluated at bid price : 26.10
Bid-YTW : -31.38 %
BNS.PR.T FixedReset 1.07 % YTW SCENARIO
Maturity Type : Call
Maturity Date : 2014-05-25
Maturity Price : 25.00
Evaluated at bid price : 28.05
Bid-YTW : 3.20 %
BAM.PR.K Floater 1.10 % YTW SCENARIO
Maturity Type : Limit Maturity
Maturity Date : 2039-12-31
Maturity Price : 13.80
Evaluated at bid price : 13.80
Bid-YTW : 2.85 %
RY.PR.C Perpetual-Discount 1.12 % YTW SCENARIO
Maturity Type : Limit Maturity
Maturity Date : 2039-12-31
Maturity Price : 20.85
Evaluated at bid price : 20.85
Bid-YTW : 5.59 %
SLF.PR.C Perpetual-Discount 1.27 % YTW SCENARIO
Maturity Type : Limit Maturity
Maturity Date : 2039-12-31
Maturity Price : 19.10
Evaluated at bid price : 19.10
Bid-YTW : 5.87 %
BNS.PR.J Perpetual-Discount 1.46 % YTW SCENARIO
Maturity Type : Limit Maturity
Maturity Date : 2039-12-31
Maturity Price : 22.80
Evaluated at bid price : 23.86
Bid-YTW : 5.45 %
BNA.PR.C SplitShare 1.50 % YTW SCENARIO
Maturity Type : Hard Maturity
Maturity Date : 2019-01-10
Maturity Price : 25.00
Evaluated at bid price : 18.90
Bid-YTW : 8.34 %
SLF.PR.B Perpetual-Discount 1.52 % YTW SCENARIO
Maturity Type : Limit Maturity
Maturity Date : 2039-12-31
Maturity Price : 20.65
Evaluated at bid price : 20.65
Bid-YTW : 5.85 %
HSB.PR.C Perpetual-Discount 1.83 % YTW SCENARIO
Maturity Type : Limit Maturity
Maturity Date : 2039-12-31
Maturity Price : 22.11
Evaluated at bid price : 22.25
Bid-YTW : 5.76 %
Volume Highlights
Issue Index Shares
Traded
Notes
GWO.PR.F Perpetual-Premium 84,426 RBC crossed 83,100 at 24.55.
YTW SCENARIO
Maturity Type : Limit Maturity
Maturity Date : 2039-12-31
Maturity Price : 24.24
Evaluated at bid price : 24.55
Bid-YTW : 6.04 %
CM.PR.E Perpetual-Discount 47,540 RBC crossed 40,100 at 23.93.
YTW SCENARIO
Maturity Type : Limit Maturity
Maturity Date : 2039-12-31
Maturity Price : 23.61
Evaluated at bid price : 23.90
Bid-YTW : 5.85 %
BMO.PR.L Perpetual-Discount 29,930 CIBC sold 15,000 to RBC at 25.15 and 10,800 to Desjardins at the same price.
YTW SCENARIO
Maturity Type : Limit Maturity
Maturity Date : 2039-12-31
Maturity Price : 24.82
Evaluated at bid price : 25.05
Bid-YTW : 5.86 %
PWF.PR.I Perpetual-Discount 25,500 TD crossed 18,900 at 25.12.
YTW SCENARIO
Maturity Type : Limit Maturity
Maturity Date : 2039-12-31
Maturity Price : 24.75
Evaluated at bid price : 25.07
Bid-YTW : 6.09 %
GWO.PR.G Perpetual-Discount 22,900 RBC crossed 15,000 at 21.90.
YTW SCENARIO
Maturity Type : Limit Maturity
Maturity Date : 2039-12-31
Maturity Price : 21.61
Evaluated at bid price : 21.90
Bid-YTW : 5.96 %
RY.PR.T FixedReset 17,700 YTW SCENARIO
Maturity Type : Call
Maturity Date : 2014-09-23
Maturity Price : 25.00
Evaluated at bid price : 28.10
Bid-YTW : 3.58 %
There were 10 other index-included issues trading in excess of 10,000 shares.

December 30, 2009

Wednesday, December 30th, 2009

Pop quiz! What do the securities and airline industries have in common?:

If these customers can’t use laptops or wi-fi and have to waste half their day going through security, they may abandon airlines at a faster rate than they are already, turning instead to modern business tools such as the web and teleconferencing, Kokonis said. Over the past year, he added, international premium flights were down 30 to 35 per cent.

What makes this even worse, [Robert] Mann [president of R.W. Mann & Company Inc., a consultancy in Port Washington, N.Y.] said, is that most in the industry realize new security measures are essentially political moves aimed at assuaging the public.

“It’s security theatre,” Mann said, noting that “there are a lot of us in the business that roll our eyes when these things happen.”

CIBC has issued covered bonds:

Series CB3 (CHF 375 million) covered bonds have a coupon rate of 1.75% and a maturity date of January 30, 2015. Series CB4 (CHF 300 million) covered bonds have a coupon rate of three-month CHF LIBOR plus 0.1% and a maturity date of December 30, 2011.

Swiss Government 5-years (there must be a cool name for them!) are now yielding 0.16%. Three month CHF LIBOR is 0.25%.

The last Canadian 5-Year NHA MBS auction was on October 16 with an average yield of 3.268%, as part of the Insured Mortgage Purchase Plan. Five year Canadas averaged 2.71% in October.

Preferred shares got on the up escalator today, although volume remained seasonably light. PerpetualDiscounts were up 31bp, while FixedResets gained 22bp, taking yields down to … 3.59%!

PerpetualDiscounts now yield 5.86%, equivalent to 8.20% interest at the standard equivalency factor of 1.4x. Long Corporates are now a hair over 6.0%, with a total return of -1.63% on the month-to-date, so the pre-tax interest-equivalent spread is now about 220bp, slightly tighter than the 225bp reported on December 16, but still wider than “Credit Crunch Normal” of 200bp and far above the long-term range of 100-150bp.

HIMIPref™ Preferred Indices
These values reflect the December 2008 revision of the HIMIPref™ Indices

Values are provisional and are finalized monthly
Index Mean
Current
Yield
(at bid)
Median
YTW
Median
Average
Trading
Value
Median
Mod Dur
(YTW)
Issues Day’s Perf. Index Value
Ratchet 0.00 % 0.00 % 0 0.00 0 0.5149 % 1,620.7
FixedFloater 5.67 % 3.82 % 37,670 19.00 1 0.5238 % 2,749.3
Floater 2.42 % 2.83 % 107,699 20.15 3 0.5149 % 2,024.7
OpRet 4.84 % -1.69 % 120,224 0.10 15 0.4590 % 2,332.8
SplitShare 6.44 % -6.24 % 195,292 0.08 2 0.0222 % 2,085.6
Interest-Bearing 0.00 % 0.00 % 0 0.00 0 0.4590 % 2,133.1
Perpetual-Premium 5.85 % 5.69 % 73,882 2.30 7 -0.0113 % 1,886.1
Perpetual-Discount 5.80 % 5.86 % 192,709 14.12 68 0.3133 % 1,799.9
FixedReset 5.39 % 3.59 % 324,259 3.84 41 0.2250 % 2,174.7
Performance Highlights
Issue Index Change Notes
CIU.PR.A Perpetual-Discount -1.25 % YTW SCENARIO
Maturity Type : Limit Maturity
Maturity Date : 2039-12-30
Maturity Price : 19.71
Evaluated at bid price : 19.71
Bid-YTW : 5.91 %
MFC.PR.A OpRet 1.02 % YTW SCENARIO
Maturity Type : Call
Maturity Date : 2010-07-19
Maturity Price : 26.25
Evaluated at bid price : 26.72
Bid-YTW : 0.87 %
POW.PR.D Perpetual-Discount 1.12 % YTW SCENARIO
Maturity Type : Limit Maturity
Maturity Date : 2039-12-30
Maturity Price : 20.78
Evaluated at bid price : 20.78
Bid-YTW : 6.04 %
TD.PR.Q Perpetual-Discount 1.13 % YTW SCENARIO
Maturity Type : Limit Maturity
Maturity Date : 2039-12-30
Maturity Price : 24.87
Evaluated at bid price : 25.10
Bid-YTW : 5.67 %
TRI.PR.B Floater 1.14 % YTW SCENARIO
Maturity Type : Limit Maturity
Maturity Date : 2039-12-30
Maturity Price : 21.25
Evaluated at bid price : 21.25
Bid-YTW : 1.85 %
SLF.PR.A Perpetual-Discount 1.19 % YTW SCENARIO
Maturity Type : Limit Maturity
Maturity Date : 2039-12-30
Maturity Price : 20.35
Evaluated at bid price : 20.35
Bid-YTW : 5.88 %
ELF.PR.G Perpetual-Discount 1.42 % YTW SCENARIO
Maturity Type : Limit Maturity
Maturity Date : 2039-12-30
Maturity Price : 18.06
Evaluated at bid price : 18.06
Bid-YTW : 6.61 %
NA.PR.N FixedReset 1.51 % YTW SCENARIO
Maturity Type : Call
Maturity Date : 2013-09-14
Maturity Price : 25.00
Evaluated at bid price : 26.94
Bid-YTW : 3.31 %
CIU.PR.B FixedReset 2.00 % YTW SCENARIO
Maturity Type : Call
Maturity Date : 2014-07-01
Maturity Price : 25.00
Evaluated at bid price : 28.62
Bid-YTW : 3.40 %
BAM.PR.H OpRet 2.06 % YTW SCENARIO
Maturity Type : Call
Maturity Date : 2010-01-29
Maturity Price : 25.50
Evaluated at bid price : 26.30
Bid-YTW : -29.72 %
BAM.PR.J OpRet 2.19 % YTW SCENARIO
Maturity Type : Call
Maturity Date : 2014-04-30
Maturity Price : 26.00
Evaluated at bid price : 27.03
Bid-YTW : 4.21 %
Volume Highlights
Issue Index Shares
Traded
Notes
CM.PR.K FixedReset 65,650 Nesbitt crossed 60,800 at 26.65.
YTW SCENARIO
Maturity Type : Call
Maturity Date : 2014-08-30
Maturity Price : 25.00
Evaluated at bid price : 26.60
Bid-YTW : 3.74 %
BMO.PR.M FixedReset 40,400 Nesbitt crossed 10,700 at 26.85, then another 28,500 at the same price.
YTW SCENARIO
Maturity Type : Call
Maturity Date : 2013-09-24
Maturity Price : 25.00
Evaluated at bid price : 26.80
Bid-YTW : 3.06 %
IGM.PR.B Perpetual-Discount 32,915 Recent Inventory Blow-out.
YTW SCENARIO
Maturity Type : Limit Maturity
Maturity Date : 2039-12-30
Maturity Price : 24.13
Evaluated at bid price : 24.33
Bid-YTW : 6.12 %
BNS.PR.T FixedReset 32,400 CIBC bought 18,500 from National at 28.15.
YTW SCENARIO
Maturity Type : Call
Maturity Date : 2014-05-25
Maturity Price : 25.00
Evaluated at bid price : 28.14
Bid-YTW : 3.47 %
CM.PR.H Perpetual-Discount 28,096 YTW SCENARIO
Maturity Type : Limit Maturity
Maturity Date : 2039-12-30
Maturity Price : 20.60
Evaluated at bid price : 20.60
Bid-YTW : 5.83 %
MFC.PR.D FixedReset 27,667 YTW SCENARIO
Maturity Type : Call
Maturity Date : 2014-07-19
Maturity Price : 25.00
Evaluated at bid price : 28.15
Bid-YTW : 3.68 %
There were 21 other index-included issues trading in excess of 10,000 shares.

CBU.PR.A Announces Normal Course Issuer Bid

Wednesday, December 30th, 2009

First Asset CanBanc Split Corp. has announced:

acceptance by the Toronto Stock Exchange (the “TSX”) of the Corporation’s Notice of Intention to make a Normal Course Issuer Bid (the “NCIB”) to permit the Corporation to acquire its Preferred Shares and Class A Shares (collectively, the “Securities”).

Pursuant to the NCIB, the Corporation proposes to purchase through the facilities of the TSX, from time to time, if it is considered advisable, up to 122,735 Preferred Shares and up to 122,735 Class A Shares of the Corporation, representing approximately 10% of the public float which is the same number as the Corporation’s issued and outstanding Securities, being 1,227,358 Preferred Shares and 1,227,358 Class A Shares as of the date hereof. The Corporation will not purchase in any given 30-day period, in the aggregate, more than 24,547 Preferred Shares and 24,547 Class A Shares, being 2% of the issued and outstanding Securities as of the date hereof. Purchases of Securities under the NCIB may commence on January 5, 2010. The Board of Directors of First Asset Investment Management Inc., the manager of the Corporation, believes that such purchases are in the best interests of the Corporation and are a desirable use of the Corporation’s funds. All purchases will be made through the facilities of the TSX in accordance with its rules and policies. All Securities purchased by the Corporation pursuant to the NCIB will not be cancelled and will be held for resale. The NCIB will expire on January 4, 2011.

On December 31, 2008, the Trust announced that it was making a Normal Course Issuer Bid, which commenced January 5, 2009, to purchase up to 132,000 Preferred Shares and up to 132,000 Class A Shares through the facilities of the TSX. Under the bid, which expires on January 4, 2010, an aggregate of 72,600 Class A Shares were repurchased at an average price of $14.90 per Class A Share including commissions. No Preferred Shares were repurchased.

I see lots of announcements of NCIBs, but not so many announcements of actual purchases!

It’s not entirely clear to me how the bookkeeping works. According to the June 2009 Financials:

A unit represents one Class A Share and one Preferred Share. The issued and outstanding units as at June 30, 2009 consists of 1,281,758 Class A Shares and 1,286,958 Preferred Shares. The Fund will ensure that an equal number of Class A Shares and Preferred Shares continue to be outstanding.

Now there are, according to the press release, 1,227,358 each, a decline of 54,400 Capital and 59,600 preferred in the past six months. And there was nothing on the books in June about the fund holding “treasury shares” or anything like that. However the prospectus (on SEDAR, dated October 31, 2008) states:

Preferred Shares may be surrendered at any time for retraction by the Company but will be retracted only on the second last Business Day of a month (the “Retraction Date”). Preferred Shares surrendered for retraction by a Preferred Shareholder at least ten Business Days prior to a Retraction Date will be retracted on such Retraction Date and such Preferred Shareholder will be paid on or before the 15th Business Day of the following month. Holders whose Preferred Shares are retracted on a Retraction Date will be entitled to receive a retraction price per share equal to the lesser of (i) 95% of the NAV per Unit determined as of the relevant Retraction Date less the pro rata portion of the Note then outstanding and less the cost to the Company of the purchase of a Class A Share for cancellation, and (ii) $10.00. The cost of the purchase of a Class A Share will include the purchase price of the Class A Share, commission and such other costs, if any, related to the liquidation of any portion of the Portfolio required to fund such purchase. If the Manager is unable to acquire sufficient Class A Shares for cancellation, the Preferred Shares will be redeemed on a pro rata basis based on the number of Class A Shares acquired or surrendered prior to the Retraction Date. If on any Retraction Date, Class A Shares are not required to be purchased in the market for cancellation in connection with the retraction of some or all of the Preferred Shares to be retracted, then the amount of the cost of a purchase of a Class A Share shall be such amount as the Manager determines is fair in the circumstances.

So it may be that the shares under this issuer bid are not cancelled immediately upon purchase, but are held for a few days and then cancelled to offset preferred share redemptions. But … it’s not clear.

Bookkeeping aside, the timing on this issue was excellent. They invested the proceeds at far better prices than anticipated in the prospectus and have benefitted to the point where a unit sold at $25 last fall is now worth $35.65 and the capital units are trading at a big fat discount to intrinsic value.

CBU.PR.A was last mentioned on PrefBlog when it was upgraded to Pfd-2 by DBRS. CBU.PR.A is not tracked by HIMIPref™.

December 29, 2009

Tuesday, December 29th, 2009

The boo-hoo-hoo crowd was in full cry December 24, with Dealbook exposing the revelation that Goldman Sachs occasionally trades as principal:

Mr. Egol, a Princeton graduate, had risen to prominence inside the bank by creating mortgage-related securities, named Abacus, that were at first intended to protect Goldman from investment losses if the housing market collapsed. As the market soured, Goldman created even more of these securities, enabling it to pocket huge profits.

Goldman’s own clients who bought them, however, were less fortunate, Gretchen Morgenson and Louise Story write in The New York Times.

Pension funds and insurance companies lost billions of dollars on securities that they believed were solid investments, according to former Goldman employees with direct knowledge of the deals who asked not to be identified because they have confidentiality agreements with the firm.

While the investigations are in the early phases, authorities appear to be looking at whether securities laws or rules of fair dealing were violated by firms that created and sold these mortgage-linked debt instruments and then bet against the clients who purchased them, people briefed on the matter say.

Michael DuVally, a Goldman Sachs spokesman, declined to make Mr. Egol available for comment. But Mr. DuVally said many of the C.D.O.’s created by Wall Street were made to satisfy client demand for such products, which the clients thought would produce profits because they had an optimistic view of the housing market. In addition, he said that clients knew Goldman might be betting against mortgages linked to the securities, and that the buyers of synthetic mortgage C.D.O.’s were large, sophisticated investors, he said.

The last paragraph says it all, really, and Goldman’s response was not necessary. Who are the investors? Were they prudent? Did they do due diligence? Did they merely have the misfortune to have A SMALL PART OF THEIR PORTFOLIO caught up in the train wreck? The ever-so-diligent reporter at the New York Times doesn’t bother even to ask such questions. It’s simply boo-hoo-hoo, a client bought something and it went down, it must be the seller’s fault.

The biggest danger the capital markets now face is over-regulation (as alluded to in a speech by John Taylor). Until performance becomes a serious consideration when placing assets for management (with risk firmly in mind at all times) and Portfolio Managers as a group start taking responsibility for their performance (which they certainly don’t want to do), we will keep seeing this friction … which basically means, until human nature changes.

There are some complaints that the Financial Crisis Inquiry Commission is making it stretch. I have no doubt but that there will be a star-studded roll of witnesses and some first-rate data collected … just how objectively that data is turned into recommendations will be another thing entirely! I think it entirely likely that regulation will become so stifling that a huge wave of hedge funds forms to compete with the banks at the margins, taking the old-style merchant-banking partnerships and trading houses as their models.

There is, surprisingly, some difference of opinion on the future course of 10-Year Treasury yields:

Yields on benchmark 10-year notes will climb about 40 percent to 5.5 percent, the biggest annual increase since 1999, according to David Greenlaw, chief fixed-income economist at Morgan Stanley in New York.

Ten-year notes will end 2010 at 3.97 percent, according to the average of 60 estimates in a Bloomberg News survey that gives greater weight to the most-recent forecasts.

Edward McKelvey, senior economist in New York at Goldman Sachs Group Inc., the top-ranked U.S. economic forecasters in 2009, according to data compiled by Bloomberg, expects yields to drop to 3.25 percent.

Forecasting is a mug’s game.

A massive financial industry investment in the UK may be reconsidered:

Jamie Dimon, chief executive, made the coded warning to Alistair Darling in an angry phone call after the Government revealed its 50pc super-tax on bonuses in the pre-Budget report. Although Mr Dimon did not explicitly threaten to can the 1.9m square foot Docklands development, he pointedly used it to demonstrate the bank’s commitment to London.

When JP Morgan bought the land for £237m in November last year, it wrote into its contract with Songbird Estates, the owner of Canary Wharf, an option to pull out. A decision has to be made before the option expires by the end of 2010.

Bankers say regulatory pressure and the shifting tax regime have made Britain a far less attractive place to do business. International banks, which assess where to place their capital at the end of every financial year, now plan to scale back investment in the UK. Even Paris, which has introduced a watered-down version of the super-tax on cash bonuses alone, is stealing a march over its traditionally superior rival, London.

It was a quiet day for preferreds, with not much volume or price volatility. PerpetualDiscounts gained 7bp, while FixedResets gained just under 5bp.

HIMIPref™ Preferred Indices
These values reflect the December 2008 revision of the HIMIPref™ Indices

Values are provisional and are finalized monthly
Index Mean
Current
Yield
(at bid)
Median
YTW
Median
Average
Trading
Value
Median
Mod Dur
(YTW)
Issues Day’s Perf. Index Value
Ratchet 0.00 % 0.00 % 0 0.00 0 -0.1440 % 1,612.4
FixedFloater 5.70 % 3.84 % 38,153 18.97 1 1.7591 % 2,734.9
Floater 2.43 % 2.82 % 111,929 20.18 3 -0.1440 % 2,014.4
OpRet 4.86 % -0.92 % 125,186 0.09 15 0.0536 % 2,322.1
SplitShare 6.44 % -4.21 % 203,292 0.08 2 -0.1996 % 2,085.2
Interest-Bearing 0.00 % 0.00 % 0 0.00 0 0.0536 % 2,123.4
Perpetual-Premium 5.85 % 5.73 % 76,623 2.30 7 0.1473 % 1,886.3
Perpetual-Discount 5.82 % 5.87 % 195,472 14.11 68 0.0724 % 1,794.2
FixedReset 5.40 % 3.68 % 334,233 3.84 41 0.0454 % 2,169.8
Performance Highlights
Issue Index Change Notes
TD.PR.Q Perpetual-Discount -1.74 % YTW SCENARIO
Maturity Type : Limit Maturity
Maturity Date : 2039-12-29
Maturity Price : 24.59
Evaluated at bid price : 24.82
Bid-YTW : 5.73 %
PWF.PR.H Perpetual-Discount -1.02 % YTW SCENARIO
Maturity Type : Limit Maturity
Maturity Date : 2039-12-29
Maturity Price : 23.92
Evaluated at bid price : 24.30
Bid-YTW : 6.01 %
BAM.PR.G FixedFloater 1.76 % YTW SCENARIO
Maturity Type : Limit Maturity
Maturity Date : 2039-12-29
Maturity Price : 25.00
Evaluated at bid price : 19.09
Bid-YTW : 3.84 %
Volume Highlights
Issue Index Shares
Traded
Notes
TD.PR.C FixedReset 77,322 Scotia crossed 73,600 at 27.15.
YTW SCENARIO
Maturity Type : Call
Maturity Date : 2014-03-02
Maturity Price : 25.00
Evaluated at bid price : 27.02
Bid-YTW : 3.74 %
CM.PR.K FixedReset 40,950 Nesbitt crossed 29,400 at 26.65.
YTW SCENARIO
Maturity Type : Call
Maturity Date : 2014-08-30
Maturity Price : 25.00
Evaluated at bid price : 26.60
Bid-YTW : 3.73 %
TD.PR.K FixedReset 22,411 TD crossed 21,400 at 28.05.
YTW SCENARIO
Maturity Type : Call
Maturity Date : 2014-08-30
Maturity Price : 25.00
Evaluated at bid price : 28.06
Bid-YTW : 3.68 %
BNS.PR.M Perpetual-Discount 20,572 YTW SCENARIO
Maturity Type : Limit Maturity
Maturity Date : 2039-12-29
Maturity Price : 20.55
Evaluated at bid price : 20.55
Bid-YTW : 5.58 %
CM.PR.J Perpetual-Discount 20,273 YTW SCENARIO
Maturity Type : Limit Maturity
Maturity Date : 2039-12-29
Maturity Price : 19.33
Evaluated at bid price : 19.33
Bid-YTW : 5.83 %
BNS.PR.L Perpetual-Discount 18,020 YTW SCENARIO
Maturity Type : Limit Maturity
Maturity Date : 2039-12-29
Maturity Price : 20.57
Evaluated at bid price : 20.57
Bid-YTW : 5.57 %
There were 15 other index-included issues trading in excess of 10,000 shares.

RPQ.PR.A Wound Up Early

Tuesday, December 29th, 2009

Connor, Clark & Lunn has announced:

that its shareholders have approved the proposal to change the redemption date of the Preferred Shares from June 30, 2011 to December 22, 2009 (the “Proposal”). As a result of the Proposal, Shareholders will have their Preferred Shares redeemed by the Company on December 22, 2009 and will be paid the net asset value per Preferred Share as of December 18, 2009.

Trading of the Preferred Shares will be halted at the opening of market on December 22, 2009 and the Preferred Shares will be delisted at the close of business on that day.

The redemption price was $12.98 per share compared with $25.00 par value.

RPQ.PR.A was last discussed on PrefBlog at the time that the wind-up was proposed

RPQ.PR.A was not tracked by HIMIPref™.

RPB.PR.A Wound Up Early

Tuesday, December 29th, 2009

Connor Clark & Lunn has announced:

that its shareholders have approved a proposal to change the redemption date of the Preferred Shares from March 23, 2012 to December 22, 2009 (the “Proposal”). As a result of the Proposal, Shareholders will have their Preferred Shares redeemed by the Company on December 22, 2009 and will be paid the net asset value redemption price per Preferred Share as of December 18, 2009 plus a redemption premium of $1.00 per Preferred Share.

Trading of the Preferred Shares will be halted at the opening of market on December 22, 2009 and the Preferred Shares will be delisted at the close of business on that day.

The redemption price was $6.55 including the $1 premium to NAV, on shares with a $25.00 par value.

RPB.PR.A was last discussed on PrefBlog at the time of the release of the Information Circular.

The issue was not tracked by HIMIPref™.

December 24, 2009

Thursday, December 24th, 2009

California’s in trouble:

The state also has struggled to implement cost-cutting measures that were part of the $85 billion spending plan approved in July. Courts blocked part of the budget that cut funding for home care for the disabled and another part that borrowed $800 million from an account that sets aside money for local transportation agencies.

An accounting error means the state has to spend almost $1 billion more on schools than budgeted. Officials also underestimated the cost of health care for the poor by $900 million, and lawmakers failed to pass legislation to realize $1 billion less in anticipated prison spending.

Combined, the state faces a $6.3 billion gap in the current year and another $14.4 billion in the next.

Democrats, who control both chambers of the Legislature, are expected to oppose wholesale cuts to health and welfare programs. Such resistance, along with Republican opposition to tax increases, will be exacerbated as election-year politics heightens the partisan divide. Half of the state’s 120 Assembly and Senate seats go before voters in November.

The basic problem is gerrymandering:

I’d place California’s ridiculous two-thirds majority vote requirement for budget passage higher on the list of culprits that create gridlock. But I wouldn’t argue with Schwarzenegger’s thesis: Gerrymandering tends to reward extremism in both parties and punish compromise, locking lawmakers into ideological corners.

Districts were shaped to be “safe” for either a Democrat or a Republican. As a result, the real election battles have been waged in the party primaries. And since low-turnout primaries normally are dominated by party purists, the contests usually have been won by candidates who run the furthest to the left or the right.

Republicans pledge not to raise taxes. Democrats promise a laundry list of social programs the state can’t afford.

Then they come to Sacramento and can’t compromise.

Without wishing to be overly dramatic, it is this sort of legislative impasse that has enabled many dictators in the past to come to power – most famously, Julius Caesar.

The markets closed early today, in order that members of the most highly paid profession on the planet will have additional opportunity to bark at counter-clerks and restaurant personnel who have to work. Me, I’m just going to put my feet up and sneer at the unemployed.

In the spirit of Christmas, the TSX has not yet made closing data available, despite the fact that the market closed three hours ago. I will update the indices … later.

…later: A quiet day, with PerpetualDiscounts basically flat at FixedResets losing (yes, losing!) 4bp.

HIMIPref™ Preferred Indices
These values reflect the December 2008 revision of the HIMIPref™ Indices

Values are provisional and are finalized monthly
Index Mean
Current
Yield
(at bid)
Median
YTW
Median
Average
Trading
Value
Median
Mod Dur
(YTW)
Issues Day’s Perf. Index Value
Ratchet 0.00 % 0.00 % 0 0.00 0 0.9761 % 1,614.7
FixedFloater 5.80 % 3.93 % 39,441 18.86 1 0.9688 % 2,687.7
Floater 2.43 % 2.81 % 113,511 20.21 3 0.9761 % 2,017.3
OpRet 4.86 % -1.64 % 126,708 0.09 15 0.0306 % 2,320.9
SplitShare 6.43 % -7.57 % 211,093 0.08 2 -0.0443 % 2,089.3
Interest-Bearing 0.00 % 0.00 % 0 0.00 0 0.0306 % 2,122.2
Perpetual-Premium 5.86 % 5.83 % 76,456 2.31 7 0.0000 % 1,883.5
Perpetual-Discount 5.82 % 5.85 % 197,157 14.10 68 -0.0023 % 1,792.9
FixedReset 5.40 % 3.65 % 337,146 3.86 41 -0.0356 % 2,168.8
Performance Highlights
Issue Index Change Notes
POW.PR.D Perpetual-Discount 1.18 % YTW SCENARIO
Maturity Type : Limit Maturity
Maturity Date : 2039-12-24
Maturity Price : 20.50
Evaluated at bid price : 20.50
Bid-YTW : 6.12 %
TRI.PR.B Floater 1.25 % YTW SCENARIO
Maturity Type : Limit Maturity
Maturity Date : 2039-12-24
Maturity Price : 21.01
Evaluated at bid price : 21.01
Bid-YTW : 1.87 %
Volume Highlights
Issue Index Shares
Traded
Notes
GWO.PR.L Perpetual-Discount 40,350 Nesbitt crossed 10,000 at 23.30.
YTW SCENARIO
Maturity Type : Limit Maturity
Maturity Date : 2039-12-24
Maturity Price : 23.12
Evaluated at bid price : 23.26
Bid-YTW : 6.10 %
RY.PR.R FixedReset 33,735 RBC crossed 29,100 at 27.97.
YTW SCENARIO
Maturity Type : Call
Maturity Date : 2014-03-26
Maturity Price : 25.00
Evaluated at bid price : 27.95
Bid-YTW : 3.44 %
IGM.PR.B Perpetual-Discount 28,200 Inventory Blow-out Sale
YTW SCENARIO
Maturity Type : Limit Maturity
Maturity Date : 2039-12-24
Maturity Price : 24.11
Evaluated at bid price : 24.30
Bid-YTW : 6.13 %
GWO.PR.X OpRet 27,447 Called for redemption. CIBC bought 17,500 from Desjardins at 26.01.
YTW SCENARIO
Maturity Type : Call
Maturity Date : 2010-10-30
Maturity Price : 25.67
Evaluated at bid price : 25.98
Bid-YTW : 3.13 %
BNA.PR.C SplitShare 17,550 National crossed 15,100 at 18.80.
YTW SCENARIO
Maturity Type : Hard Maturity
Maturity Date : 2019-01-10
Maturity Price : 25.00
Evaluated at bid price : 18.70
Bid-YTW : 8.47 %
POW.PR.D Perpetual-Discount 15,551 YTW SCENARIO
Maturity Type : Limit Maturity
Maturity Date : 2039-12-24
Maturity Price : 20.50
Evaluated at bid price : 20.50
Bid-YTW : 6.12 %
There were 10 other index-included issues trading in excess of 10,000 shares.

Redefault on Modified Mortgages

Thursday, December 24th, 2009

The Federal Reserve Bank of New York has released a staff report by Andrew Haughwout, Ebiere Okah and Joseph Tracy titled Second Chances: Subprime Mortgage Modification and Re-Default:

Mortgage modifications have become an important component of public interventions designed to reduce foreclosures. In this paper, we examine how the structure of a mortgage modification affects the likelihood of the modified mortgage re-defaulting over the next year. Using data on subprime modifications that precede the government’s Home Affordable Modification Program, we focus our attention on those modifications in which the borrower was seriously delinquent and the monthly payment was reduced as part of the modification. The data indicate that the re-default rate declines with the magnitude of the reduction in the monthly payment, but also that the re-default rate declines relatively more when the payment reduction is achieved through principal forgiveness as opposed to lower interest rates.

More specifically:

After reviewing relevant previous studies and describing our data, we turn to an analysis of the effectiveness of the modifications we observe. We find that delinquent borrowers whose mortgages receive some kind of modification have a strong tendency to redefault, but that different kinds of modifications have diverse effects on outcomes. In particular, while HAMP focuses on reducing payment burdens, our results indicate the importance of borrower equity — the relationship between the mortgage balance and the home value — a factor that has been stressed in the previous literature on mortgage defaults. We conclude with a discussion of the implications of our results for modification policy.

The authors conclude, in part:

Our findings have potentially important implications for the design of modification programs going forward. The Administration’s HAMP program is focused on increasing borrowers’ ability to make their monthly payments, as measured by the DTI. Under HAMP, reductions in payments are primarily achieved by subsidizing lenders to reduce interest rates and extend mortgage term. While such interventions can reduce re-default rates, an alternative scheme would simultaneously enhance the borrower’s ability and willingness to pay the debt, by writing down principal in order to restore the borrower’s equity position. We estimate that restoring the borrower’s incentive to pay in this way can double the reduction in re-default rates achieved by payment reductions alone.

Another distinction between modifications that reduce the monthly payment by cutting the interest rate as compared to reducing the principal is the likely impact on household mobility. Ferreira et al (2010) using over two decades of data from the American Housing Survey estimate that each $1,000 in subsidized interest to a borrower reduces the two-year mobility rate by 1.4 percentage points. Modifying the interest rate to a below market rate creates an in-place subsidy to the borrower leading to a lock-in effect. That is, the borrower receives the subsidy only if he or she does not move.

Seems to me that HAMP is poorly designed – just another piece of poorly thought out feel-goodism.

One thing the authors did not address that interests me greatly is the accounting treatment for modifications which are wholly and directly owned by a single bank – as is the general rule in Canada – and how a choice between interest rate reduction and principal reduction might be reflected on the books of the firm. I suspect – but am not certain – that principal reduction will affect current profit, while interest rate reduction will merely affect future profit and be amortized over the length of the loan, despite the fact that it may be presumed that the choices are equivalent on a present value basis.

Given all the current fooferaw over the pending apocalypse in Canada when the current crop of 90%+ LTV mortgages comes due and needs to be refinanced at a higher rate, it might be prudent to start examining – and, perhaps, changing – the bookkeeping implications now, rather than being surprised later.

But then – who cares? Interest rate reductions are easy to understand and get more votes – so why should our glorious leaders do anything?

Update, 2012-7-31: Rebuttal from FHFA.

Update, 2013-5-13: Redesign of HAMP in 2010:

The US Treasury Department, as it continues to revamp the Home Affordable Modification Program (HAMP), announced today an initiative to encourage principal write-downs.

The principal reduction plan is one of the changes to HAMP, to be implemented in coming months.

The changes will encourage servicers to write-down a portion of mortgage debt as part of a HAMP modification, allow more borrowers to qualify for modification and help borrowers move into more affordable housing when modification is not possible, according to a fact sheet on the improvements provided to HousingWire.

S&P Commentary 2013-4-26:

In June of last year, Standard & Poor’s Ratings Services contended that principal forgiveness was more likely to keep U.S. mortgage borrowers current than more commonly used modification tools (see “The Best Way to Limit U.S. Mortgage Redefaults May Be Principal Forgiveness,” June 15, 2012). Data gathered since then not only support this view but also demonstrate servicers’ growing adoption of this form of loss mitigation. (Watch the related CreditMatters TV segment titled, “Principal Forgiveness Remains The Best Way To Limit U.S. Mortgage Redefaults,” dated May 7, 2013.)

As of February of this year, more than 1.5 million homeowners have received a permanent modification through the U.S. federal government’s Home Affordable Modification Program (HAMP). Since the publication of our June 2012 article, there have been more than 400,000 additional modifications on outstanding mortgages (as of March 2013). This translates to roughly a 22% rate of growth in the number of modifications on an additional $2.4 billion in mortgage debt.

Under the HAMP Principal Reduction Alternative (PRA) program, which provides monetary incentives to servicers that reduce principal, borrowers have received approximately $9.6 billion in principal forgiveness as of March 2013. Interestingly, servicers have ramped up their use of principal forgiveness on loans that don’t necessarily qualify for PRA assistance. Indeed, among the top five servicers for non-agency loans, we’ve noted that principal forgiveness, as a percentage of average modifications performed on a monthly basis, has increased by about 200% since the latter half of 2011 (see Chart 1). We attribute part of this to the $25 billion settlement in February 2012 with 49 state attorneys general and these same five servicers: Ally/GMAC, Bank of America, Citi, JPMorgan Chase, and Wells Fargo). In fact, although principal reduction remains the least common type of loan modification among servicers, the percentage of non-agency modified loans that have received principal forgiveness has increased by 3% since June 2012 (see Chart 2). Since 2009, servicers have forgiven principal on approximately $45 billion of outstanding non-agency mortgages.
Excess Reserves at Fed

Thursday, December 24th, 2009

The Federal Reserve Bank of New York has released a paper by Todd Keister and James J. McAndrews titled Why Are Banks Holding So Many Excess Reserves?:

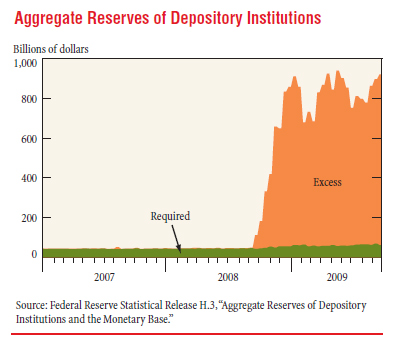
The buildup of reserves in the U.S. banking system during the financial crisis has fueled concerns that the Federal Reserve’s policies may have failed to stimulate the flow of credit in the economy: banks, it appears, are amassing funds rather than lending them out. However, a careful examination of the balance sheet effects of central bank actions shows that the high level of reserves is simply a by-product of the Fed’s new lending facilities and asset purchase programs. The total quantity of reserves in the banking system reflects the scale of the Fed’s policy initiatives, but conveys no information about the initiatives’ effects on bank lending or on the economy more broadly.

They quote a lot of commentary decrying the build-up of reserves, but state:

In this edition of Current Issues, we argue that the concerns about high levels of reserves are largely unwarranted. Using a series of simple examples, we show how central bank liquidity facilities and other credit programs create—essentially as a by-product—a large quantity of reserves. While the level of required reserves may change modestly with changes in bank lending behavior, the vast majority of the newly created reserves will end up being held as excess reserves regardless of how banks react to the new programs. In other words, the substantial buildup of reserves depicted in the chart reflects the large scale of the Federal Reserve’s policy initiatives, but says little or nothing about the programs’ effects on bank lending or on the economy more broadly.

One casual comment of interest is:

Note the important economic role of interbank lending in this example: it allows funds to flow to their most productive uses, regardless of which bank received the initial deposits.

This, presumably, is a justification for encouraging interbank lending in the BIS Capital Ratios (which allow one bank’s holdings of another bank’s paper to be risk-weighted according to the credit rating of the borrowing bank’s sovereign authority. I would dearly love to see this issue thoroughly discussed; to me, it seems to have had the effect of increasing contagion.

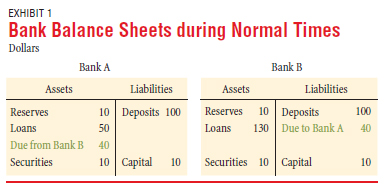
Anyway: in normal times, Bank A has lent to Bank B:

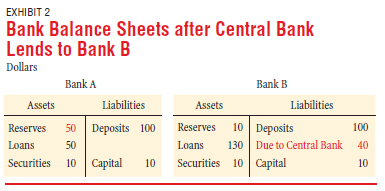
But in stressed times, the inter-bank market fails and the Fed lends to Bank B (via a credit to their reserve account), which repays Bank A by transfer of reserves:

The authors explain:

This simple example illustrates how a central bank’s extension of credit to banks during a financial crisis creates, as a by-product, a large quantity of excess reserves. Merely looking at the aggregate data on bank reserves might lead one to conclude that the central bank’s policy did nothing to promote bank lending, since all of the $40 lent by the central bank ended up being held as excess reserves. The example shows that this conclusion would be unwarranted. In fact, the central bank’s action was highly effective: it prevented Bank B from having to reduce its lending to firms and households by $40.

There are, as always, knock-on effects:

Actions by a central bank that change the quantity of reserves in the banking system also tend to change the level of interest rates. Traditionally, bank reserves did not earn any interest. If Bank A earns no interest on the reserves it is holding in Exhibit 2, it will have an incentive to lend out its excess reserves or to use them to buy other short-term assets. These activities will, in turn, decrease short-term market interest rates and hence may lead to an increase in inflationary pressures.

The Central Bank may therefore choose to sterilize its market action by selling interest-bearing bonds from its holdings to Bank A – or it can achieve a similar policy objective by paying interest on excess reserves.

The authors conclude:

We began this article by asking, Why are banks holding so many excess reserves? We then used a series of simple examples to answer this question in two steps. First, we showed that the liquidity facilities and other credit programs introduced by the Federal Reserve in response to the crisis have created, as a by-product, a large quantity of reserves in the banking system. Second, we showed that while the lending decisions and other activities of banks may result in small changes in the level of required reserves, the vast majority of the newly created reserves will end up being held as excess reserves. The dramatic buildup of excess reserves reflects the large scale of the Federal Reserve’s policy initiatives; it conveys no information about the effects of these initiatives on bank lending or on the level of economic activity.

We also discussed the importance of paying interest on reserves when the level of excess reserves is unusually high, as the Federal Reserve began to do in October 2008. Paying interest on reserves allows a central bank to maintain its influence over market interest rates irrespective of the quantity of reserves in the banking system. The central bank can then scale its policy initiatives according to conditions in the financial sector, while setting its target for the short-term interest rate in response to macroeconomic conditions. This ability to separate short-term interest rates from the quantity of reserves is particularly important during the recovery from a financial crisis. If inflationary pressures begin to appear while the crisis-related programs are still in place, the central bank can use its interest-on-reserves policy to raise interest rates without necessarily removing all of the newly created reserves.