Archive for January, 2010

Best & Worst Performers: January 2010

Saturday, January 30th, 2010

These are total returns, with dividends presumed to have been reinvested at the bid price on the ex-date. The list has been restricted to issues in the HIMIPref™ indices.

January 2010
Issue Index DBRS Rating Monthly Performance Notes (“Now” means “January 29”)
BAM.PR.J OpRet Pfd-2(low) -4.30% Now with a pre-tax bid-YTW of 4.88% based on a bid of 26.02 and a softMaturity 2018-3-30 at 25.00.
W.PR.J PerpetualDiscount Pfd-2(low) -3.71% Now with a pre-tax bid-YTW of 6.18% based on a bid of 22.84 and a limitMaturity.
BAM.PR.O OpRet Pfd-2(low) -3.09% Now with a pre-tax bid-YTW of 4.29% based on a bid of 25.68 and a optionCertainty 2013-6-30 at 25.00.
IAG.PR.C FixedReset Pfd-2(high) -3.09% Now with a pre-tax bid-YTW of 4.51% based on a bid of 26.66 and a call 2014-1-30 at 25.00.
W.PR.H PerpetualDiscount Pfd-2(low) -3.05% Now with a pre-tax bid-YTW of 6.14% based on a bid of 22.56 and a limitMaturity.
ELF.PR.G PerpetualDiscount Pfd-2(low) +4.57% Now with a pre-tax bid-YTW of 6.40% based on a bid of 18.75 and a limitMaturity.
ELF.PR.F PerpetualDiscount Pfd-2(low) +4.94% The fifth-worst performer in December, so this is a bounce-back. Now with a pre-tax bid-YTW of 6.50% based on a bid of 20.60 and a limitMaturity.
CIU.PR.A PerpetualDiscount Pfd-2(high) +6.70% The third-worst performer in December, so this is largely a bounce-back. Now with a pre-tax bid-YTW of 5.57% based on a bid of 21.01 and a limitMaturity.
BAM.PR.K Floater Pfd-2(low) +8.62% The fourth best performer in December.
BAM.PR.B Floater Pfd-2(low) +9.20% The second-best performer in December. Momentum rules!

HIMIPref™ Index Rebalancing: January 2010

Saturday, January 30th, 2010
HIMI Index Changes, January 29, 2009
Issue From To Because
BMO.PR.L PerpetualPremium PerpetualDiscount Price
IAG.PR.E PerpetualPremium PerpetualDiscount Price
NA.PR.K PerpetualPremium PerpetualDiscount Price
PWF.PR.I PerpetualPremium PerpetualDiscount Price
TD.PR.Q PerpetualPremium PerpetualDiscount Price
TD.PR.R PerpetualPremium PerpetualDiscount Price
PWF.PR.A Scraps Floater Volume
BAM.PR.E Scraps Ratchet Volume
GWL.PR.O Scraps PerpetualPremium Volume

There were the following intra-month changes:

HIMI Index Changes during January 2010
Issue Action Index Because
GWO.PR.X Delete OpRet Called
IGM.PR.A Delete OpRet Called
BAM.PR.R Add FixedReset New Issue
BPO.PR.N Add Scraps New Issue
AER.PR.A Add Scraps New Issue
FTS.PR.H Add Scraps New Issue

SPL.A Rating Discontinued by DBRS

Friday, January 29th, 2010

Dominion Bond Rating Service has announced that it:

has today discontinued its rating on the Class A Shares issued by Mulvihill Pro-AMS RSP Split Share Corp. at the request of Mulvihill Capital Management Inc. (the Promoter).

The fund’s 1H09 Financials noted:

No distributions were made to Class A and Class B shareholders.

In October 2008, the Managed Portfolio funded additional amounts for the Class A Share Forward Agreement to a future value of $10.00 per Class A Share. The Managed Portfolio was reduced significantly in size with this funding. The Class A Shares have residual risk now, since the decrease in the size of the Managed Portfolio may mean that the Class A Shareholders will be expected to cover expenses of the Fund in future years. As a result, the expected redemption value of the Class A Shares to be received in December of 2013 is less than $10.00 per Class A Share.

SPL.A was last mentioned on PrefBlog when it was downgraded to D by DBRS. SPL.A is tracked by HIMIPref™ but is relegated to the Scraps subindex on credit concerns.

January 29, 2010

Friday, January 29th, 2010

That’s a wrap!

The Canadian preferred share market closed the month on a sour note, with PerpetualDiscounts down 13bp and FixedResets losing 6bp on a well-behaved day with only one entry in the performance highlights – POW.PR.B, oddly enough, which I have used as a gauge of the market impact of the stupid trading in POW.PR.C. Volume was subdued and dominated by FixedResets.

PerpetualDiscounts closed the month yielding 5.81%, equivalent to 8.13% interest at the standard equivalency factor of 1.4x. Long Corporates returned 4.02% on the month to close with a yield of about 5.8%, so the pre-tax interest-equivalent spread (also called the Seniority Spread) is now about 235bp, a little wider than the 230bp reported on January 27.

HIMIPref™ Preferred Indices
These values reflect the December 2008 revision of the HIMIPref™ Indices

Values are provisional and are finalized monthly
Index Mean
Current
Yield
(at bid)
Median
YTW
Median
Average
Trading
Value
Median
Mod Dur
(YTW)
Issues Day’s Perf. Index Value
Ratchet 0.00 % 0.00 % 0 0.00 0 0.6556 % 1,733.6
FixedFloater 5.63 % 3.72 % 36,675 19.36 1 -0.9231 % 2,808.8
Floater 2.26 % 2.60 % 113,138 20.75 3 0.6556 % 2,165.8
OpRet 4.84 % -3.92 % 110,558 0.09 13 -0.0118 % 2,319.1
SplitShare 6.34 % 0.08 % 148,734 0.08 2 0.3069 % 2,119.9
Interest-Bearing 0.00 % 0.00 % 0 0.00 0 -0.0118 % 2,120.6
Perpetual-Premium 5.82 % 5.67 % 151,594 13.74 12 -0.0498 % 1,887.9
Perpetual-Discount 5.76 % 5.81 % 172,362 14.17 63 -0.1285 % 1,826.6
FixedReset 5.43 % 3.61 % 321,361 3.81 42 -0.0568 % 2,177.5
Performance Highlights
Issue Index Change Notes
POW.PR.B Perpetual-Discount -1.50 % YTW SCENARIO
Maturity Type : Limit Maturity
Maturity Date : 2040-01-29
Maturity Price : 21.93
Evaluated at bid price : 22.26
Bid-YTW : 6.05 %
Volume Highlights
Issue Index Shares
Traded
Notes
BAM.PR.B Floater 70,951 Nesbitt crossed 50,000 at 15.05.
YTW SCENARIO
Maturity Type : Limit Maturity
Maturity Date : 2040-01-29
Maturity Price : 15.20
Evaluated at bid price : 15.20
Bid-YTW : 2.60 %
TD.PR.K FixedReset 69,750 RBC crossed 12,000 at 27.80, then three blocks at 27.82: two of 10,000 and one of 30,000 shares.
YTW SCENARIO
Maturity Type : Call
Maturity Date : 2014-08-30
Maturity Price : 25.00
Evaluated at bid price : 27.81
Bid-YTW : 3.61 %
RY.PR.T FixedReset 49,658 Desjardins crosse 15,000 at 27.70, then Nesbitt crossed 25,000 at 27.65.
YTW SCENARIO
Maturity Type : Call
Maturity Date : 2014-09-23
Maturity Price : 25.00
Evaluated at bid price : 27.64
Bid-YTW : 3.70 %
TD.PR.G FixedReset 48,220 RBC crossed blocks of 10,000 and 30,000 shares, both at 27.85.
YTW SCENARIO
Maturity Type : Call
Maturity Date : 2014-05-30
Maturity Price : 25.00
Evaluated at bid price : 27.83
Bid-YTW : 3.46 %
BNS.PR.T FixedReset 37,725 Nesbitt crossed 20,000 at 27.89.
YTW SCENARIO
Maturity Type : Call
Maturity Date : 2014-05-25
Maturity Price : 25.00
Evaluated at bid price : 27.79
Bid-YTW : 3.49 %
RY.PR.X FixedReset 37,474 RBC bought 11,900 from anonymous at 27.80.
YTW SCENARIO
Maturity Type : Call
Maturity Date : 2014-09-23
Maturity Price : 25.00
Evaluated at bid price : 27.75
Bid-YTW : 3.61 %
There were 26 other index-included issues trading in excess of 10,000 shares.

BoC Paper on Systemic Capital Requirements

Friday, January 29th, 2010

The Bank of Canada has released a working paper by Céline Gauthier, Alfred Lehar, and Moez Souissi titled Macroprudential Regulation and
Systemic Capital Requirements
:

In the aftermath of the financial crisis, there is interest in reforming bank regulation such that capital requirements are more closely linked to a bank’s contribution to the overall risk of the financial system. In our paper we compare alternative mechanisms for allocating the overall risk of a banking system to its member banks. Overall risk is estimated using a model that explicitly incorporates contagion externalities present in the financial system. We have access to a unique data set of the Canadian banking system, which includes individual banks’ risk exposures as well as detailed information on interbank linkages including OTC derivatives. We find that systemic capital allocations can differ by as much as 50% from 2008Q2 capital levels and are not related in a simple way to bank size or individual bank default probability. Systemic capital allocation mechanisms reduce default probabilities of individual banks as well as the probability of a systemic crisis by about 25%. Our results suggest that financial stability can be enhanced substantially by implementing a systemic perspective on bank regulation.

To be frank, I found this paper rather difficult to follow – I suspect that the authors had to agree to severe restrictions on what they could publish as a condition of getting the data:

Data on exposures related to derivatives come from a survey initiated by OSFI at the end of 2007. In that survey, banks are asked to report their 100 largest mark-to-market counterparty exposures that were larger than $25 million. These exposures were related to both OTC and exchange traded derivatives. They are reported after netting and before collateral and guarantees.

The interbank exposures were enormous:

The aggregate size of interbank exposures was approximately $21.6 billion for the Six major
Canadian banks. As summarized in Table 3, total exposures between banks accounted for around 25 per cent of bank capital on average. The available data suggest that exposures related to traditional lending (deposits and unsecured loans) were the largest ones compared with mark-to-market derivatives and cross-shareholdings exposures. Indeed, in May 2008, exposures related to traditional lending represented around $12.7 billion on aggregate, and 16.3 percent of banks’ Tier 1 capital on average. Together, mark-to-market derivatives and cross-shareholdings represented 10 per cent of banks’ Tier 1 capital on average.

Banks can affect each other’s probability of default (PD) in a number of ways:

A default is called fundamental when credit losses are sufficient to wipe out all the capital of the bank as defined in Equation (19). Column three in Table 4 summarizes the PD from defaults due to interbank contagion without asset fire sales, i.e. when a bank has sufficient capital to absorb the credit losses in the non-bank sectors but is pushed to bankruptcy because of losses on its exposures to other banks (as defined in Equation (21) with p = 1). The third category of default is the contagion due to asset fire sales as defined in Equation (20). In these cases a bank has enough capital to withstand both the credit losses in the non-banking sector and the writedown on other banks’ exposures but, conditional on the other losses having reduced capital, not enough to withstand the mark-to-market losses due to its own asset fire sale and/or the asset fire sale of the other banks.

The Canadian banking system is very stable without the consideration of asset fire sales. Both fundamental and contagious PDs are well below 20 basis points, even though we assume increased loan losses due to an adverse macro scenario throughout the paper. In the asset fire sale scenario, troubled banks want to maintain regulatory capital requirements by selling off assets, which causes externalities for all other banks as asset prices fall. PDs increase and as banks get weaker because of writedowns they also become more susceptible for contagion.

By me, one of the more important results discussed in the paper is:

The number of bankruptcies jumps dramatically as market liquidity decreases. In columns two to four of table 5 we allow asset prices to drop 50 percent more than in the base scenario. We immediately see that our analysis is very sensitive to the minimum asset price, which defines our demand function for the illiquid asset. Allowing fire sale discounts of three percent increases banks’ PDs significantly All banks default almost in two out of three cases. Default correlation is almost one (not shown), which explains why the total PDs are almost identical. While banks 2 and 4 are very likely to default because of writedowns in the value of their illiquid assets, banks 3, 6 and especially bank 5 are more likely to be affected by contagion. Two possible reasons could explain why these results are so sensitive to asset fire sale discounts. First, high Tier 1 capital requirements of 7%, compared to the 4% under Basel rules, trigger asset fire sales early, causing other banks to follow. Second the small number of banks causes each bank to have a huge price impact when selling off illiquid securities, creating negative externalities for the whole system.

… and the authors reflect:

Two policy insights stand out from the latter results. First, in the last financial crisis, regulators were criticized for helping banks to offload assets from their balance sheets at subsidized prices, and for relaxing accounting rules on the basis that market prices did not reflect fundamental values, which allowed banks to avoid mark-to-market writedowns of their assets. While our analysis cannot show the long-term costs associated with these measures, we can at least document that there is a significant immediate benefit for financial stability by preventing asset fire sale induced writedowns. Second, a countercyclical reduction in the minimum Tier 1 capital requirements triggering asset fire sales (or a higher capital buffer built in good time) would reduce dramatically the risk of default triggered by AFS.

Further:

We can see again that the Canadian banking system is interdependent. The default of any one bank is correlated with the default of any other bank with a probability of more than 50%. Consistent with the results in table 7, the defaults of banks one and five (two and six) are correlated the most (less) with other banks default.

Footnote: 36The results in this section are based on correlations and do not reflect causality

I’m rather disappointed that the various capital allocation schemes tested did not include a straightforward approach based on changing the risk weight of interbank exposures. There’s not much that can be done about the decline of asset values in a fire-sale situation; but contagion via direct markdown/default on interbank loans is very easy to restrict. There’s a trade-off against banking system efficiency (interbank loans allow, effectively, Bank A to lend to Bank B’s customers when there are differing investment opportunities), but I’m not sure how important that might be in Canada, where all but one of the Big 6 is national in scope.

Tax Impact on FixedResetPremium Yields

Friday, January 29th, 2010

Assiduous Reader pugwash asked on another thread:

The discussion ten days ago on this excellent blog about the impact of tax on premium bonds led me to consider if there is there a tax downside to owning premium resets.

How is the capital loss between the purchase price of say $28 in todays market and the call price of $25 dealt with?

Not many of us have capital gains to use as an offset!

He was referring to a comment by prefhound on my essay The Bond Portfolio Jigsaw Puzzle. And, naturally enough, his use of the phrase “excellent blog” virtually guaranteed a response!

In order to investigate the problem of tax effects, we need:

The last two requirements are permanently linked on the right-hand panel of this blog under the heading “On-Line Resources”. Note that we don’t really need the “FixedResets” version of the calculator; since we’re only going to be calculating yield to the first call, the regular version (broken link redirected 2024-2-1) will do the same job; but we’ll use the souped-up version anyway. Why not?

Calculations will be performed for an Ontario resident with taxable income of $150,000. Ernst & Young claims the marginal rate on capital gains is 23.21% and the marginal rate on dividends is 23.06% (compare to the marginal rate on income of 46.41%, which is not used in this calculation).

pugwash specified a price of $28 for discussion, so for discussion purposes we’ll examine HSB.PR.E, which closed last night at 28.01-15. It pays 1.65 p.a. unitl the first Exchange Date 2014-6-30, when it resets to GOC5+485, or is called at 25.00.

The dividend rate of 1.65 implies quarterly payments of 0.4125. For taxable accounts, we will assume that this is reduced by 23.06% to 0.3173775. Dividends are paid at the end of June/Sept/Dec/Mar and the next ex-date is March 11 (estimated) so we’ll get the next dividend.

It should be noted that a horrifyingly precise calculation will not pay the tax on day of receipt, as assumed in the above paragraph, but pay annual taxes in the following calendar year. HIMIPref™ does this calculation, but the current calculation using the spreadsheet software doesn’t.

The maturity price is 25.00, which is all we need for the non-taxable calculation, but taxable accounts with capital gains will be able to claim the 3.01 capital loss until maturity. The tax rate of 23.21% on capital gains implies that this deduction will be worth 0.698621, so a taxable account with capital gains to offset the loss may use a maturity price of 25.698621.

Having accumulated the data, we can fill in the calculation spreadsheet:

HSB.PR.E Yield-to-Call Calculations
Data Non-Taxable Taxable with Capital Gains to offset loss Taxable without Capital Gains to offset loss
Current Price 28.01
Call Price 25.00 25.698621 25.00
Settlement Date 2010-1-28
Call Date 2014-6-30
Quarterly Dividend 0.4125 0.3173775 0.3173775
Cycle 3
Pay Date 31
Include First Dividend 1
First Dividend Value (if different) [blank]
Reset Date 2014-6-30 (irrelevant)
Quarterly Dividend After Reset 0.4125 0.3173775 0.3173775
(irrelevant)
 
Annualized Quarterly Yield to Call 3.43% 2.61% 2.04%
Effective Tax Rate 0% 23.91% 40.52%

Note that the calculated yield on the taxable account with no capital gains (2.04%) is a little harsh, because it does not reflect the fact that the investor will have a capital loss of 3.01 that may be used at some time to offset future capital gains. However, if he never makes any capital gains, this asset will be worth zero.

Note also that the effective tax rate for a taxable account with capital gains (yield of 2.61%, effective tax rate of 23.91%) is in excess of both the capital gains rate and the dividend rate. This is because the investor is paying tax up-front (when the dividends are received) and receiving the benefit of the capital loss later.
January 28, 2010

Thursday, January 28th, 2010

The first exception to Comrade Peace-Prize’s vengeful tax on banks will probably be short-term funding through repos:

The administration wants to recover government fees spent during the financial crisis through a levy on banks, which is projected to recoup at least $90 billion over 10 years. The fee, proposed as a 15-basis-point tax on liabilities other than insured deposits, could make repo transactions money losers for firms because profit margins on trades may be less than the fee.

“One of the modifications I expect would be to exclude Treasury repo, in part because the Fed wants to drain reserves using the repo market,” said Joseph Abate, a money market strategist in New York at Barclays Plc, one of the 18 primary dealers that trade with the central bank. “The 15 basis points fee would obviously make the banks less willing to participate in those transactions.”

Government policy makers have acted to shield the repo market in the past. The House of Representatives passed a financial overhaul bill in December that would penalize fully secured creditors if a systemically important financial firm failed, after carving out an exemption for trades involving Treasury securities.

Bernanke’s appointment to a second term was confirmed by the senate, 70-30.

As a public service, The Toronto Star and the Toronto Police came together this week to illustrate for the man in the street the realities of regulation:

  • A statistical blip is dressed up as a trend in order to sell newspapers
  • Regulators take stern action to Show Who’s Boss
  • Things get back to normal

I know one ETF that’s going to show a rather large tracking error this month …. on the month-to-date, the TXPR Total Return Index Value is -0.32%, while CPD is -0.53%. Allowing 4bp for their fees, that means that their execution of the index rebalancing cost them about 17bp. Given $393-million under management, that comes to about $668,000.

It wasn’t much of day for the Canadian preferred share market, with PerpetualDiscounts down 5bp on the day while FixedResets gained 2bp. There are only three entries on the Performance Highlights table, so individual issues were reasonably well behaved, while volume remained at reasonably normal levels.

HIMIPref™ Preferred Indices
These values reflect the December 2008 revision of the HIMIPref™ Indices

Values are provisional and are finalized monthly
Index Mean
Current
Yield
(at bid)
Median
YTW
Median
Average
Trading
Value
Median
Mod Dur
(YTW)
Issues Day’s Perf. Index Value
Ratchet 0.00 % 0.00 % 0 0.00 0 0.3095 % 1,722.4
FixedFloater 5.58 % 3.67 % 36,808 19.43 1 -0.0513 % 2,835.0
Floater 2.28 % 2.63 % 114,052 20.68 3 0.3095 % 2,151.7
OpRet 4.84 % -4.07 % 114,593 0.09 13 0.0886 % 2,319.4
SplitShare 6.36 % 0.32 % 154,538 0.08 2 -0.1313 % 2,113.4
Interest-Bearing 0.00 % 0.00 % 0 0.00 0 0.0886 % 2,120.8
Perpetual-Premium 5.82 % 5.67 % 152,395 13.73 12 -0.0655 % 1,888.9
Perpetual-Discount 5.76 % 5.81 % 173,824 14.18 63 -0.0473 % 1,828.9
FixedReset 5.43 % 3.61 % 329,364 3.82 42 0.0153 % 2,178.7
Performance Highlights
Issue Index Change Notes
IAG.PR.C FixedReset -1.43 % YTW SCENARIO
Maturity Type : Call
Maturity Date : 2014-01-30
Maturity Price : 25.00
Evaluated at bid price : 26.86
Bid-YTW : 4.29 %
ENB.PR.A Perpetual-Premium -1.11 % YTW SCENARIO
Maturity Type : Limit Maturity
Maturity Date : 2040-01-28
Maturity Price : 24.80
Evaluated at bid price : 25.02
Bid-YTW : 5.58 %
BMO.PR.M FixedReset -1.04 % YTW SCENARIO
Maturity Type : Call
Maturity Date : 2013-09-24
Maturity Price : 25.00
Evaluated at bid price : 25.95
Bid-YTW : 3.73 %
Volume Highlights
Issue Index Shares
Traded
Notes
TD.PR.G FixedReset 205,147 RBC crossed blocks of 40,000 and 120,000 shares, both at 27.85. Nesbitt bought 20,000 from anonymous at 27.90.
YTW SCENARIO
Maturity Type : Call
Maturity Date : 2014-05-30
Maturity Price : 25.00
Evaluated at bid price : 27.85
Bid-YTW : 3.44 %
TRI.PR.B Floater 133,700 Nesbitt crossed blocks of 54,500 and 75,000, both at 21.80.
YTW SCENARIO
Maturity Type : Limit Maturity
Maturity Date : 2040-01-28
Maturity Price : 21.55
Evaluated at bid price : 21.81
Bid-YTW : 1.78 %
TD.PR.P Perpetual-Discount 86,800 TD crossed 82,700 at 24.06.
YTW SCENARIO
Maturity Type : Limit Maturity
Maturity Date : 2040-01-28
Maturity Price : 23.61
Evaluated at bid price : 23.81
Bid-YTW : 5.54 %
TD.PR.S FixedReset 86,556 RBC crossed 80,000 at 26.25.
YTW SCENARIO
Maturity Type : Call
Maturity Date : 2013-08-30
Maturity Price : 25.00
Evaluated at bid price : 26.33
Bid-YTW : 3.35 %
CM.PR.M FixedReset 75,400 RBC bought 25,000 from Nesbitt at 27.75, then crossed 25,000 at the same price.
YTW SCENARIO
Maturity Type : Call
Maturity Date : 2014-08-30
Maturity Price : 25.00
Evaluated at bid price : 27.75
Bid-YTW : 3.89 %
BAM.PR.R FixedReset 60,430 Recent new issue.
YTW SCENARIO
Maturity Type : Limit Maturity
Maturity Date : 2040-01-28
Maturity Price : 23.20
Evaluated at bid price : 25.35
Bid-YTW : 4.73 %
There were 34 other index-included issues trading in excess of 10,000 shares.

January 27, 2010

Wednesday, January 27th, 2010

The Securities & Exchange Commission has issued a statement SEC Approves Money Market Fund Reforms to Better Protect Investors. Some of the changes are cosmetic and boxticky, others serve the usual regulatory purpose of looking good without addressing the underlying issue. Their rationale for the changes is:

The financial crisis and the weaknesses revealed by the Reserve Primary Fund’s “breaking the buck” in September 2008 precipitated a full-scale review of the money market fund regulatory regime by the SEC. A money market fund “breaks the buck” when its net asset value (NAV) falls below $1.00 per share, meaning investors in that fund will lose money. The SEC’s new rules are intended to increase the resilience of money market funds to economic stresses and reduce the risks of runs on the funds by tightening the maturity and credit quality standards and imposing new liquidity requirements.

Reserve Primary Fund broke the buck because it had a relatively small position in commercial paper that defaulted; there was no backstop to cover the default. While it will be conceded that the mathematical chances of this happening again will be reduced by, say, the strong encouragement to MMFs to hold Treasury securities, the fundamental cause is not addressed: there was no backup.

I have argued that the Volcker proposals for MMF regulation be implemented. Nothing will ever guarantee that commercial paper won’t default; the only thing that will seriously affect the incidence of buck-breaking is a formalization of the current nod-and-wink guarantee by the sponsor; it will then require a double-default to break the buck.

The Boston Fed has released a book of conference proceedings titled Policymaking Insights from Behavioral Economics with chapters:

  • Behavioral Economics: Its Prospects and Promises for Policymakers
  • Behavioral Aspects of Price Setting and Their Policy Implications
  • Household Savings Behavior in the United States: The Role of Literacy, Information, and Financial Education Programs
  • The Behavioral Economics of the Labor Market: Central Findings and Their Policy Implications
  • U.S. House Price Dynamics and Behavioral Economics
  • Happiness, Contentment, and Other Emotions for Central Banks
  • Behavioral Economics and Public Policy: Reflections on the Past and Lessons for the Future
  • Implications of Behavioral Economics for Monetary Policy
  • Behavioral Economics as “Psychologically Informed” Economic Inquiry

Comrade Peace-Prize’s bank regulation initiative caused some chatter at Davos.

A relatively quiet day on the Canadian Preferred Share market, with PerpetualDiscounts gaining 8bp and FixedResets losing 6bp on the day. Volume was normal, and there was only one issue exhibiting an interesting amount of price volatility.

PerpetualDiscounts closed yielding 5.78%, equivalent to 8.09% interest at the standard equivalency factor of 1.4x. Long Corporates now yield about 5.8%, so the pre-tax interest-equivalent spread is now about 230bp, continuing to widen from the 215bp reported January 20.

HIMIPref™ Preferred Indices
These values reflect the December 2008 revision of the HIMIPref™ Indices

Values are provisional and are finalized monthly
Index Mean
Current
Yield
(at bid)
Median
YTW
Median
Average
Trading
Value
Median
Mod Dur
(YTW)
Issues Day’s Perf. Index Value
Ratchet 0.00 % 0.00 % 0 0.00 0 -0.0966 % 1,717.0
FixedFloater 5.57 % 3.66 % 36,335 19.43 1 0.8790 % 2,836.4
Floater 2.28 % 2.65 % 105,318 20.64 3 -0.0966 % 2,145.1
OpRet 4.85 % -4.21 % 111,582 0.09 13 0.0739 % 2,317.3
SplitShare 6.35 % -0.83 % 156,568 0.08 2 -0.0219 % 2,116.2
Interest-Bearing 0.00 % 0.00 % 0 0.00 0 0.0739 % 2,119.0
Perpetual-Premium 5.81 % 5.65 % 151,624 6.04 12 0.0797 % 1,890.1
Perpetual-Discount 5.75 % 5.78 % 178,360 14.19 63 0.0836 % 1,829.8
FixedReset 5.42 % 3.58 % 341,533 3.82 42 -0.0567 % 2,178.4
Performance Highlights
Issue Index Change Notes
CIU.PR.A Perpetual-Discount 1.50 % YTW SCENARIO
Maturity Type : Limit Maturity
Maturity Date : 2040-01-27
Maturity Price : 21.01
Evaluated at bid price : 21.01
Bid-YTW : 5.57 %
Volume Highlights
Issue Index Shares
Traded
Notes
RY.PR.T FixedReset 129,150 RBC crossed 30,400 at 27.68, then another 60,500 at 27.71, finishing with 10,600 at 27.70.
YTW SCENARIO
Maturity Type : Call
Maturity Date : 2014-09-23
Maturity Price : 25.00
Evaluated at bid price : 27.70
Bid-YTW : 3.64 %
RY.PR.X FixedReset 93,280 Nesbitt crossed 50,000 at 27.80; Desjardins crossed blocks of 20,000 and 10,000 at the same price.
YTW SCENARIO
Maturity Type : Call
Maturity Date : 2014-09-23
Maturity Price : 25.00
Evaluated at bid price : 27.78
Bid-YTW : 3.58 %
TD.PR.I FixedReset 77,288 TD crossed 50,000 at 27.80.
YTW SCENARIO
Maturity Type : Call
Maturity Date : 2014-08-30
Maturity Price : 25.00
Evaluated at bid price : 27.77
Bid-YTW : 3.63 %
IGM.PR.B Perpetual-Discount 52,290 Desjardins crossed blocks of 13,400 and 13,000 at 24.75.
YTW SCENARIO
Maturity Type : Limit Maturity
Maturity Date : 2040-01-27
Maturity Price : 24.50
Evaluated at bid price : 24.71
Bid-YTW : 6.06 %
BAM.PR.R FixedReset 45,325 YTW SCENARIO
Maturity Type : Limit Maturity
Maturity Date : 2040-01-27
Maturity Price : 23.18
Evaluated at bid price : 25.27
Bid-YTW : 4.75 %
BMO.PR.O FixedReset 42,999 National crossed 24,000 at 28.34.
YTW SCENARIO
Maturity Type : Call
Maturity Date : 2014-06-24
Maturity Price : 25.00
Evaluated at bid price : 28.31
Bid-YTW : 3.56 %
There were 33 other index-included issues trading in excess of 10,000 shares.

January 26, 2010

Tuesday, January 26th, 2010

The International Monetary Fund has released the January 2010 Market Update to the Global Financial Stability Report, which contained some items of interest:

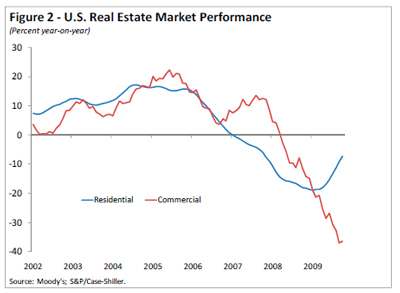
Credit losses arising from commercial real estate exposures are expected to increase substantially (Figure 2). The expected writedowns are concentrated in countries that experienced the largest run-ups in prices and subsequent corrections and are in line with our previous estimates.

And without wishing to become too think-tanky, I interpret the following as a warning shot against Comrade Peace-Prize’s unilateralism:

Policymakers should be mindful of the costs associated with uncertainty about future regulation, as this may hinder financial institutions’ plans regarding their business lines and credit provision. But they should also avoid the risks associated with too rapid deployment of new regulations without proper overall impact studies. It also continues to be vitally important that differences in international implementation of the new regulatory framework are minimized to avoid an uneven playing field and regulatory arbitrage that could compromise financial stability.

… but at least one guy thinks that nobody cares anyway, not even Comrade PP himself:

Philip Swagel, a former U.S. Treasury Department official who teaches at Georgetown University in Washington, said G7 officials would be wise not to worry too much about whether Mr. Obama’s boldest proposals will see the light of day, let alone fret about the U.S. gaining – or even seeking – enough global support that other countries end up having to replicate the measures.

“It’s not that they’re dead on arrival, they were never intended to be initiatives to push forward in the international agenda,” Mr. Swagel said in an interview. “They were aimed at domestic consumption, signalling to the American people that the President is as mad as they are.”

YES WE CAN indulge ourselves with cynical grandstanding!

A mixed day for Canadian preferreds with PerpetualDiscounts up 5bp and FixedResets losing 14bp. The market was well-behaved, with only four issues on the performance highlights list; one of the losers was our old friend POW.PR.C, gradually winding down toward normalcy. Volume continued at elevated levels.

HIMIPref™ Preferred Indices
These values reflect the December 2008 revision of the HIMIPref™ Indices

Values are provisional and are finalized monthly
Index Mean
Current
Yield
(at bid)
Median
YTW
Median
Average
Trading
Value
Median
Mod Dur
(YTW)
Issues Day’s Perf. Index Value
Ratchet 0.00 % 0.00 % 0 0.00 0 0.3490 % 1,718.7
FixedFloater 5.62 % 3.71 % 36,038 19.38 1 0.1554 % 2,811.7
Floater 2.28 % 2.65 % 106,680 20.64 3 0.3490 % 2,147.1
OpRet 4.85 % -3.82 % 116,109 0.09 13 -0.0532 % 2,315.6
SplitShare 6.35 % -1.52 % 162,772 0.08 2 0.4176 % 2,116.7
Interest-Bearing 0.00 % 0.00 % 0 0.00 0 -0.0532 % 2,117.4
Perpetual-Premium 5.81 % 5.65 % 151,503 13.76 12 -0.0597 % 1,888.6
Perpetual-Discount 5.75 % 5.79 % 180,492 14.20 63 0.0514 % 1,828.3
FixedReset 5.42 % 3.60 % 343,870 3.82 42 -0.1369 % 2,179.6
Performance Highlights
Issue Index Change Notes
POW.PR.D Perpetual-Discount -1.34 % YTW SCENARIO
Maturity Type : Limit Maturity
Maturity Date : 2040-01-26
Maturity Price : 21.31
Evaluated at bid price : 21.31
Bid-YTW : 5.92 %
TD.PR.O Perpetual-Discount -1.33 % YTW SCENARIO
Maturity Type : Limit Maturity
Maturity Date : 2040-01-26
Maturity Price : 22.09
Evaluated at bid price : 22.23
Bid-YTW : 5.48 %
POW.PR.C Perpetual-Discount -1.16 % YTW SCENARIO
Maturity Type : Limit Maturity
Maturity Date : 2040-01-26
Maturity Price : 24.22
Evaluated at bid price : 24.61
Bid-YTW : 5.93 %
PWF.PR.K Perpetual-Discount 1.18 % YTW SCENARIO
Maturity Type : Limit Maturity
Maturity Date : 2040-01-26
Maturity Price : 21.51
Evaluated at bid price : 21.51
Bid-YTW : 5.79 %
Volume Highlights
Issue Index Shares
Traded
Notes
CM.PR.L FixedReset 107,119 Nesbitt crossed two blocks of 40,000 each, both at 27.75. CIBC sold 20,000 to RBC at 27.75.
YTW SCENARIO
Maturity Type : Call
Maturity Date : 2014-05-30
Maturity Price : 25.00
Evaluated at bid price : 27.75
Bid-YTW : 3.76 %
TRP.PR.A FixedReset 87,073 Nesbitt crossed 11,200 at 26.00.
YTW SCENARIO
Maturity Type : Call
Maturity Date : 2015-01-30
Maturity Price : 25.00
Evaluated at bid price : 26.02
Bid-YTW : 3.78 %
W.PR.J Perpetual-Discount 51,000 Nesbitt crossed 50,000 at 23.04.
YTW SCENARIO
Maturity Type : Limit Maturity
Maturity Date : 2040-01-26
Maturity Price : 22.71
Evaluated at bid price : 23.00
Bid-YTW : 6.13 %
CM.PR.M FixedReset 47,275 Nesbitt crossed 40,000 at 27.87.
YTW SCENARIO
Maturity Type : Call
Maturity Date : 2014-08-30
Maturity Price : 25.00
Evaluated at bid price : 27.72
Bid-YTW : 3.91 %
NA.PR.N FixedReset 43,100 TD crossed 25,000 at 26.45; RBC crossed 16,000 at the same price.
YTW SCENARIO
Maturity Type : Call
Maturity Date : 2013-09-14
Maturity Price : 25.00
Evaluated at bid price : 26.46
Bid-YTW : 3.53 %
HSB.PR.E FixedReset 36,520 RBC crossed 10,000 at 28.00.
YTW SCENARIO
Maturity Type : Call
Maturity Date : 2014-07-30
Maturity Price : 25.00
Evaluated at bid price : 28.00
Bid-YTW : 3.85 %
There were 42 other index-included issues trading in excess of 10,000 shares.

PWC.PR.B Issues Additional Tranche

Tuesday, January 26th, 2010

Pacific & Western Credit Corp. has announced:

that it completed another private placement closing of 250,000 of its Class “B” Preferred Shares on January 25, 2010. Net proceeds from this closing are $5.9 million, and net aggregate proceeds from this closing together with the December 30, 2009 private placement closing are $10.7 million. Proceeds will be used for working capital purposes in PWC and to provide additional regulatory capital to PWC’s wholly-owned subsidiary, Pacific & Western Bank of Canada (the Bank), to provide for the Bank’s growth.

Pacific & Western Credit Corp.’s Class “B” Preferred Shares trade on the TSX under the symbol PWC.PR.B.

This follows the December 31 announcement:

that it completed the closing of a private placement of 204,500 Class “B” Preferred Shares on December 30, 2009. Net proceeds from this closing are $4.8 million, and will be used for working capital purposes in Pacific & Western Credit Corp.

Pacific & Western Credit Corp.’s Class “B” Preferred Shares trade on the TSX under the symbol PWC.PR.B.

This issue will be a nightmare at some time in the future, because there was no prospectus – it was created via conversion of the Class ‘A’ Preferred Shares:

The holders of Class “B” Preferred Shares are entitled to receive, and the Corporation shall pay thereon, as and when declared by the board of directors of the Corporation, fixed subordinated cumulative dividends at the rate of $2.25 per share per annum. Such dividends will be paid quarterly on the last day of March, June, September and December in each year. Out of the total dividend of $2.25 per annum, per Class “B” Preferred Share, $0.84 will be paid by the Corporation in cash with the remaining dividends to be paid by the Corporation in cash or common shares of the Corporation, at the Corporation’s sole discretion. Any such common shares would be issued at the current market price, as defined below.

The Class “B” Preferred Shares will be non-voting and will be subordinate to the Shares with respect to the payment of dividends and the distribution of assets on dissolution, liquidation or winding-up. The Class “B” Preferred Shares will have preferential rights over the common shares with respect to the payment of dividends and the distribution of assets on dissolution, liquidation or winding-up. The Class “B” Preferred Shares will be convertible, at any time, into common shares of the Corporation on the basis of five (5) common shares for each Class “B” Preferred Share. Upon conversion, all accrued and unpaid dividends, calculated to but excluding the date fixed for conversion, shall be payable by the Corporation in cash/common shares, in the manner described above with respect to dividends.

The Class “B” Preferred Shares will be redeemable by the Corporation, at its discretion, on or after June 30, 2014, but will be redeemed by the Corporation by no later than June 30, 2019, in each case for $25.00 per Class “B” Preferred Share (the “Redemption Price”). Any Redemption Price would be paid by the Corporation in cash, and any accrued but unpaid dividends on the Class “B” Preferred Shares that are redeemed shall be payable by the Corporation in cash/common shares, in the manner described above with respect to dividends.

When calculating the “current market price” for any common shares issuable as dividends on the Class “B” Preferred Shares, the current market price will be the volume weighted average trading price of the common shares, calculated by dividing the total value by the total volume of common shares traded for the five trading days immediately preceding the seven trading days prior to a designated record, conversion or redemption date, as applicable.

The original tranche was created via several conversions:

approximately $33.2 million of new Class “B” Preferred Shares of PWC will be issued today as a result of conversions of approximately 828,000 Class “A” Preferred Shares, $3.3 million of Series A Notes and $27.4 million of Series C Notes. In addition, approximately $6.8 million of Series C Notes of PWC will be issued today as a result of the conversion of approximately $5.6 million of Series A Notes.

PWC.PR.B is not tracked by HIMIPref™.