Archive for the ‘Spreads to Bonds’ Category

Sloppy Indeed!

Thursday, October 2nd, 2008

It will not have escaped notice that equities got crushed today:

Canadian stocks tumbled the most in almost eight years, led by a record drop in raw-material shares, as tighter credit, rising unemployment and lower home prices threatened to tip the U.S. into a recession.

Potash Corp. of Saskatchewan Inc. fell the most since 1989 after rival Mosaic Co. posted profit that missed analysts’ estimates and cut its sales forecast. Barrick Gold Corp. plunged the most in two decades as bullion declined on speculation the U.S. will approve a $700 billion plan to revive credit markets, reducing the metal’s appeal.

Suncor Energy Inc. touched the lowest in 15 years, leading oil and gas producers lower as crude fell below $95 a barrel and Merrill Lynch & Co. said it may drop to $50. The Standard & Poor’s/TSX Composite Index fell 7 percent to 10,900.54 in Toronto, the most since Oct. 25, 2000.

Preferreds were not immune, although the TXPR’s loss of 1.02% looks a whole better than ‘first-loss’ equities!

But the really illuminating thing about the action is just how SLOPPY this market is. I mean, look … if you want to tell me that the proper yield for preferreds in this environment is X, I’ll listen! For a while, anyway. That sort of speculation is simply market timing and I don’t put much credence in it.

But surely similar securities from the same issuer should trade somewhere around each other! But that’s not the case today … the yield curve has been getting sloppier and sloppier over the past couple of weeks and today … well, I haven’t checked, but it must be some kind of record!

Internal Spreads on
Perpetual Discount Issues
Issuer High Bid Yield Low Bid Yield High/Low
Series ID
BMO 6.62% 6.26% H, L
BNS 5.89% 5.70% N, K
CM 7.07% 6.93% E, I
GWO 6.70% 5.97% H, F
NA 6.39% 6.23% K, L
POW 6.78% 6.38% (B & D), A
PWF 6.54% 6.06% L, E
RY 6.29% 6.11% W, H
SLF 6.34% 6.24% D, B
TD 6.15% 5.84% O, (Q & R)
Issuers included in list if they have at least three issues listed in the “PerpetualDiscount” index

Speaking very generally, there appears to be some positive correlation between Average Daily Trading Value and Yield – that is, the higher the average volume, the higher the yield, which is to say: the liquidity premium is negative … which really shouldn’t happen.

This behavior is consistent with people simply reducing exposure by selling whatever’s easiest to sell, regardless of price.

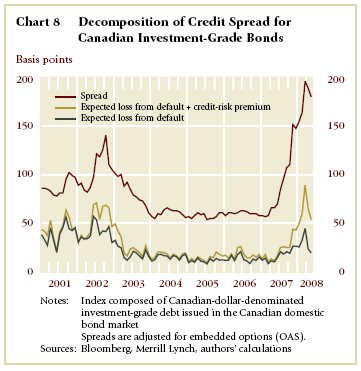
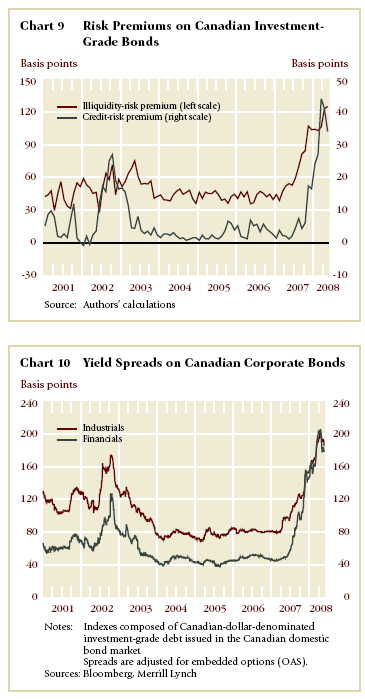
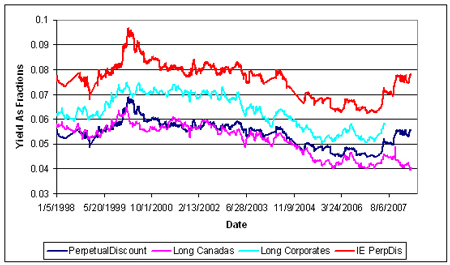
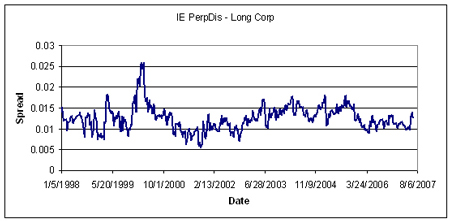
The weighted mean average pre-tax bid-YTW of the PerpetualDiscount index is now 6.37%, which is about where it was on July 11 (going up) and July 28 (going down). This is equivalent to 8.92% interest at the standard conversion factor of 1.4x. Long corporates now yield about 6.7%, so the PTIE spread is now about 220bp.

PerpetualDiscounts: Playing with Numbers

Wednesday, July 16th, 2008

Given the recent skyrocketting of PerpetualDiscount yields, I’ve been thinking a bit about how the spread – which I consider quite excessive, but what do I know? – might be traded away by investors unwilling to time the markets.

OK, so let’s consider the following data:

Fixed Income Investments
Asset Yield Duration
Perpetual
Discount
Preferreds
9.28%
(Interest
Equivalent)
13.05
iShares
CDN Bond
Index
(XBB)
4.32%
-MER 0.25%
6.4
iShares
CDN Short
Bond Index
(XSB)
3.96%
-MER 0.25%
2.8

For PerpetualDiscounts, the Modified Duration is reported as it is on HIMIPref™, which assumes repayment of principal in 30-years. This isn’t quite accurate, but it’s close enough for horseshoes.

So let’s consider an investor who is holding XBB in a taxable account. There are going to be strange tax effects if we do it properly (since the average COUPON is far higher than the average YIELD: he will be paying tax on the coupon, which is partially a return of capital and, logically, getting some of this tax back via a projected capital loss), but we’re not going to do it properly. We’re going to do it on the back of an envelope; those wishing precision can either do it themselves, or pay me a huge amount of money to do it for them.

Anyway, this investor is holding XBB. He wants a duration-neutral switch into a portfolio comprised of XSB and PerpetualDiscount Preferreds, so he solves the equation (let P be the fraction of the new portfolio invested in Preferreds)

Old Portfolio Weighted Duration = New Portfolio Weighted Duration
6.4 = 2.8 (1-P) + 13.05 P
6.4 = 2.8 – 2.8P + 13.05 P
And therefore
3.6 = 10.5P
And therefore
P = 0.34.

Check!
6.4 = 2.8 * (1 – 0.34) + 13.05 * 0.34
6.4 = 2.8 * 0.66 + 13.05 * 0.34
6.4 = 1.8 + 4.4
Close enough!

So basically, a taxable investor holding XBB can swap 2/3 of his holdings into XSB and 1/3 into PerpetualDiscounts and remain duration neutral. Note that other risk-elements are not risk neutral! The portfolio is a barbell, and will underperform expectations if the curve steepens; there is a higher weight of corporates in the new portfolio; there is tax-effect-risk in the new portfolio; there is spread risk on the preferred (the spread can go to a million basis points and nobody will go to jail); there’s a whole list of things that could go wrong and would be listed in a prospectus. All I will say is that the duration-neutrality goes a long, long way towards making the portfolios equal, since to a first approximation the investor will have the same risk relative to parallel shifts in the yield curve, up or down.

OK, so what’s that done to his yield?

His old yield was 4.07% net of MER; his new yield, NY, after deduction of the MER on his perpetualDiscount position (MERP) is:
NY = 0.66*(3.96% – 0.25%) + 0.34*(9.28 – MERP)
= 0.66*(3.71%) + 0.34*9.28% – 0.34*MERP
= 2.44% + 3.16% – 0.34*MERP
= 5.60% – 0.34*MERP

Let’s assume he puts the money in my fund, MAPF, and that he assumes the fund will deliver the PerpetualDiscount yield less 1% fee and less 50bp expenses and no trading gains. Then

NY = 5.60% – 0.34*1.50%
= 5.09%

So … back of an envelope, an investor with a taxable position in XBB can make reasonably conservative assumptions and figure to pick up 100bp pre-tax yield without changing duration by putting 1/3 of his portfolio into perpetualDiscounts and keeping duration constant by swapping the other 2/3 to XSB. You could do your own calculation for the exchange traded funds, CPD and DPS.UN (these are not entirely perpetualDiscounts, so be careful!) or by using direct investment (zero MER!) on the preferred portfolio of your choice.

Preferreds or Common?

Friday, July 11th, 2008

There was an interesting comment on FWF today:

I would always expect variation in daily value for a bond or a bond fund. What strikes me as not “fixed income” about preferreds is that they have noticeably deviated from any bond indice comparison. And corporate bonds have held up; so this is a preferred-specific issue. The market seems to be saying the risk factor in preferreds is much higher than comparable corporate bonds.

This was in the context of a discussion about the investment merits of bank preferreds vs. bank common, given that many Canadian banks’ common are trading with unheard of dividend yields in the current depressed market.

This is simply another example of trader-mentality vs. investor-mentality. I have nothing against traders. Trading is a useful skill and can be a lucrative skill … if I had a trader’s mentality, I’d still be counting my winnings from the Tech boom. Unfortunately (in this particular case, anyway) I have an investor mentality and simply would not be able to sleep at night, knowing that I held a piece of garbage for the sole reason that the price was rising.

For investors, it is important to look through trading behavior into the actual investment characteristics of a particular vehicle. I will certainly not deny that bank prefs are behaving a lot more like bank common nowadays than like bank bonds, but this observation does not constitute a solid ground for an investment strategy.

What do I always say? The investment world is chaotic, and things that were not even slightly important a year ago can become a driving force in the blink of an eye. It is not enough to look at price behaviour alone. At this time last year, non-bank ABCP with a General Market Disruption liquidity guarantee was just the same as bank ABCP with a Global liquidity guarantee. And, what’s more, the two classes had been trading in lockstep for years. Until, one day, they didn’t.

Preferred shares may, in times of stress, over-react to bad news about the common. There are many among us who have very fond memories of what happened to TRP.PR.X and TRP.PR.Y at the time that TRP common halved its dividend. Call me polyanna, but the fund loaded up on TRP Preferreds … because although the common dividend had halved, the preferred dividend looked … well … perhaps to say “as solid as ever” would be overstating the case, but “almost as solid as ever” seems to understate it! Assiduous Readers will know what I mean, anyway.

So by all means, prefs will often trade more like common than they trade like stock. An investor must look through that and realize that prefs are not common. Prefs are also not bonds. They’re preferreds. I feel it is appropriate to benchmark them (at least, the high quality ones) against long corporates because that is what their risk most resembles; but I recognize that sometimes markets will go blahooey, if for no other reason than their investor universe is different. Times when things are going blahooey is when I earn my pay – largely by doing nothing. Nice work, if you can get it.

I will note that the fact that things can go blahooey is a major reason behind my exhortations to limit preferred exposure to 50% maximum of a fixed income portfolio. The spreads are juicy, and sometimes they’re very juicy indeed … but when you need to raise cash for non-investment reasons, you really don’t want to be a forced seller.

PerpetualDiscounts finished the day with an average yield of 6.40%, equivalent to 8.96% at the standard conversion factor of 1.4x. Long corporates – which have been basically ignoring all this kerfuffle about financials, having priced it in months ago – continue to yield about 6.1%; the PerpetualDiscount / Long Corporate PTIE spread is therefore about 286bp. This is wild!

The Swoon in June: Could it be Tax?

Sunday, June 29th, 2008

An old thread regarding preferreds has come to life on Financial Webring Forum, with one poster speculating that the Swoon In June is tax-driven – there are two tax changes scheduled to have an effect on preferreds in the next few years, Federal Bad and Ontario Good, netting out to a modest negative.

It is my feeling that the recent decline is driven more by portfolio window-dressing by retail stockbrokers more than any fundamental factor.

If fundamental factors were to blame – or even if they were fundamental factors mis-applied! – I would expect to see that the market would retain some degree of internal consistency.

This is not what’s happening. Deeply-discounted perpetuals are being hit harder than slightly-discounted perpetuals (the discount of market price relative to potential call price, that is) – I gave the example of the CM issues on June 26 and two RY issues more recently.

This has happened to the extent that deeply discounted perps yield more than slightly-discounted perps. This simply should not happen (see the links in the June 26 post) and, I will emphasize, is not due to any historic spread relations or anything like that … the causation is the other way round. Convexity is a pretty basic fixed-income analytical tool, with a negligible effect for normal bonds, but a huge factor in callables (or other type of embedded option).

You can, if you like, make an argument that convexity has zero value and that therefore any perpetual discount from a given issuer should trade at the same yield, regardless of its combination of price and dividend. I might laugh at your pathetic little arguments, but you can make them with some semblance of rationality. But it is not possible to argue that convexity has a negative value and that therefore a discounted perpetual with a relatively high coupon should trade at a lower yield than its lower-coupon, otherwise identical, sibling. There might possibly be other things going on that would lead to that effect – but it wouldn’t be a direct effect and I haven’t been able to come up with any actual evidence that such an effect is even remotely possible.

The fact that it has happened anyway has convinced me that it’s retail window-dressing. We are approaching quarter-end and stockbrokers do not want to remind their clients, yet again, that the new issue they bought at $25 is now trading at $20. So, of the two or three issues in the client’s portfolio, they sell the lowest priced one, regardless of yield.

It’s only a hypothesis and it’s completely untestable … but I have not been able to think of anything else!

The fact that the relative prices are out of whack – and not based on any kind of normal fixed-income analysis – causes me to be very suspicious of the fundamental underpinnings of the overall decline.

If we plug in the projected Ontario tax rate on dividends for 2012 of 26.7% and the projected rate on income of 46.41%, we arrive at an equivalency factor of (1-0.267)/(1-0.4641) = 1.37. This is marginally lower than current, but PerpetualDiscounts now yield 6.04%, while long corporates are about 6.1%. Even the lower equivalency factor results in a spread of about 215bp, well in excess of historical norms and very hard to justify in fundamental terms (although, it should be noted, you can always justify anything you like in fundamental terms).

When the market re-establishes some degree of internal consistency (as far as the pref market ever is internally consistent!) we can have a look and see what the spreads really are. Until then, the situation is too clouded by clear signs of panic to allow any conclusions to be drawn.

BoC Financial System Review, June 2008: Credit Spreads

Thursday, June 26th, 2008

The Bank of Canada released the June 2008 Financial System Review on June 12. One of the three “Highlighted Issues” was Canadian Corporate Investment Grade Spreads.

The authors first define their terms, making a basic point that surprisingly few investors understand:

In general, two important components drive variations in corporate yield spreads. One is the expected loss from default, the other relates to risk premiums. This latter component can be further decomposed into two types: a credit-risk premium and an illiquidity premium. The expected loss from default generally reflects the fundamentals of the firm, such as the degree of leverage and its ability to generate a stable stream of profits. The credit-risk premium is related to the variability of, or uncertainty about, potential loss from default. Both the credit-risk premium and the expected loss from default are affected by changes in macroeconomic activity. When combined, these two components comprise the part of the yield spread attributed to default-related credit risks.

The illiquidity premium, a non-credit-risk factor, relates to a lack of general market liquidity. Moreover, the credit-risk and illiquidity premiums, like other risk premiums, can vary with any change in the risk appetite of investors and are therefore likely to be positively correlated over time.

They decompose the components of the corporate spread vs. governments using a structure “Merton” model, very similar to the BoE research previously reported on PrefBlog – the BoE is thanked for supplying code in note 16. For investment-grade firms issuing Canadian Corporate Bonds (they do not define their universe more precisely than this) they conclude:

As of 21 May 2008, while the actual spread was 179 basis points, the expected loss, credit-risk premium, and illiquidity premium were 20, 34, and 125 basis points, respectively. Comparable figures for end-July 2007 were 85, 21, 5, and 59 basis points, respectively. The increase in the investment-grade credit spread can thus be attributed to an increase in the credit-risk and illiquidity premiums above their recent historical norms.

… while noting:

The credit-risk component reached its peak level of 89 basis points in March 2008, and the illiquidity premium reached its peak level of 125 basis points in May 2008.

Much of the increase is due to the “high proportion of financial firms (approximately 55% of the index in 2007).”

There are some very illuminating graphs:

I will note that, as of June 25 according to Canadian Bond Indices and the HIMIPref™ Indices:

  • 30-Year Canadas yielded 4.06%
  • Long Corporates yielded ~6.05%
  • PerpetualDiscounts yielded 6.01% as a dividend
  • PerpetualDiscounts yielded 8.41% interest equivalent (at 1.4x)

See Party Like It’s 1999! for further discussion of the PerpetualDiscount Interest-Equivalent / Long Corporate spread.

Party Like It's 1999!

Wednesday, June 18th, 2008

I don’t, as a rule, like pseudo-analytical notes such as this post. Historical plots implicitly assume that the anything not intrinisic to the plot is constant; and in plotting historical yields there’s an entire economy being ignored which is most emphatically not constant.

But some people like them; I got curious; and Assiduous Readers (after yesterday‘s collapse) will want something cheerful to look at.

So … without further ado, here’s a plot of yields, going back 10 years. PerpetualDiscount yields are from the HIMIPref™ Index; other yields are courtesy of the Bank of Canada. The graphs get cut off at the end of March, 2008, because that’s the data I have convenient for the HIMIPref™ indices; Long Corporates get cut off in mid-2007, because that’s when the Bank stopped getting bond data with permission to redistribute freely.

… and the Perpetual Discount Interest Equivalent Spread against Long Corporates (using a constant equivalency of 1.4x, which is fishy in the extreme):

So folks … we’re bloodied but unbowed! Spreads are (roughly) near a ten year high … recall my note of yesterday that PerpetualDiscounts now have an average yield of 6.00%; interest-equivalent (at 1.4x) of 8.40%; vs. Long Corporates of just under 6.2%.

CU Inc. Issues Long Term Debs

Wednesday, May 21st, 2008

CU Inc. has an issue trading on the Toronto Stock Exchange, CIU.PR.A, now bid at 20.50 for a pre-tax bid-YTW of 5.64% based on a limitMaturity; this is an interest-equivalent of 7.90% at a conversion factor of 1.4x. These are Series 1 Preferred. The company also has an approximately equal value of “Series Second Preferred” outstanding, all of which are held by the parent company.

Today they issued some 30-year debs at 5.58%.

Mainly I was interested in this because of the 232bp interest-equivalent spread between the prefs and the long debs, but there’s a little twist …

A grossly abbreviated statement of their liabilites is:

CIU Inc. Liabilities
Item Value
CAD Millions
Current Liabilities 250.6
Non-Current Non-Capital 229.6
Long-Term Debt 2,459.4
Series 1 Prefs 115.0
Series 2 Prefs 130.0
Equity 1,675.5
Total 4,860.1

According to the prospectus for CIU.PR.A:

In the event of the liquidation, dissolution or winding up of the Corporation, or other distribution of assets of the Corporation among its shareholders for the purpose of winding-up its affairs, the holders of the Series 1 Preferred Shares shall be entitled to receive the amount paid up on such shares together with all accrued and unpaid cumulative preferential dividends thereon and, if such liquidation, dissolution, winding-up or distribution is voluntary, a premium of $1.00 per share if such event commences prior to June 1, 2009, and, if such event commences thereafter, a premium equivalent to the premium payable on redemption if such shares were to be redeemed at the date of commencement of any such voluntary liquidation, dissolution, winding-up or distribution, before any amount shall be paid or any property or assets of the Corporation shall be distributed to the holders of any Class A non-voting shares or Class B common shares or other shares ranking junior to the Series 1 Preferred Shares. After payment to the holders of the Series 1 Preferred Shares of the amounts so payable to them, they shall not be entitled to share in any further distribution of the property or assets of the Corporation.

… which is not entirely satisfactory, because nowhere in the document is the seniority of the “Series Second Preferred Shares” clearly defined relative to the “Series 1 Preferred Shares”.

I have used their contact form to ask the question:

Are the CU Inc. Series 1 Preferred Shares junior, senior, or parri passu to the Series Second Preferred Shares?

Where may I find legal documentation of the relative status?

Update, 2008-5-27: I have received a note from Atco staff denying the existence of Series Second Preferred shares. Further inquiries are in progress.

Recent Bond/Preferred Performance

Wednesday, February 13th, 2008

Assiduous Reader madequota has asked on another post:

OK, one more question that’s easy to ask, and hard to answer:

In very general terms, I’ve always believed that prefs (of the so-called perp variety especially) should behave, more or less, in sync with the 30 year bond. I’m aware of the variety of specific differences between the two vehicles, but at the end of the day, these two investments are very similar in that the occurances of the daily market should have identical impact on both of them. Hence they should, at the very least, move in the same direction.

Assuming my generalization is correct, why then do these things trade so often in opposite directions? For example, the US retail number came out today, and because it was marginally “better than analyst’s expectations”, bonds got punished both in the US and Canada. But the prefs had a great day in Canada.

Specifically then, why is the long bond getting creamed over the past week, while at the same time, thirst for perp prefs seems to be unquenchable?

madequota

I am on the verge of doing serious work on spreads … though what I am calling “serious work” is what I would normally term as a product of the “Look, Mummy, I got a spreadsheet!” school of security analysis.

One more month and I should have the HIMIPref™ indices up to date, which will give the data I require to draw long term spread graphs. PerpetualDiscounts SHOULD trade like long corporates (NOT long Canadas!), PerpetualPremiums, Retractibles & OpRets SHOULD trade like short corporates – the first of these with a little slippage due to negative convexity.

All I can really say is: spreads are volatile. And without some hot institutional money (even lukewarm institutional would be a help) to arbitrage corporates/prefs, they’re going to stay volatile.

Note that long corporates are down about 2.52% YTD, while perpetualDiscounts are up about 2.67%. So go figure.

A Bear Checks In

Wednesday, October 31st, 2007

After having given so much attention to the neighborhood bull, it seems only fair to allow some comments from the bears!

Hi James:

Here is the result of a little calculation I did with Royal Bank bond yields and pref yields.  It looks similar (today at least) for other banks, but I don’t have lots of historical bond data.

Comparing RY Bonds and Prefs
  11-May-07 26-Oct-07
Bond Yield (Dur = 5) 4.21% 5.14%
Discount Pref Yield 4.50% 5.49%
Disc Pref Duration 22.1 18.6
Spread 0.29% 0.35%
Yield Ratio 1.069 1.068

Although we seem to be comparing bond apples (duration 5) to pref oranges (duration 18-22), the arithmetic spread, and especially the yield ratio (which I like better for many things and many reasons) is basically the same today as it was 5 months ago.  I happen to have some data from May 11 for two RY bonds, but have no older data.

Perhaps you have access to more historical bond and pref data to investigate this further, but one conclusion I would draw is that pref yields are not currently out of line with bond yields.  Furthermore, a 5.14% bond yield is consistent with (perhaps slightly below) US bond yields.  If the corporate yields hold, then discount prefs will NOT recover, so investors today should only expect the yield component, and give up hoping for capital gains — and could suffer more losses if corporate yields increase.  I wish I knew more about this apparent relationship over the past couple of years of Pref purchasing!

I also note that the bond equivalent yield ratio (at least at this wildly different duration) is 1.07 in the market, rather than 1.40 for taxable investors.  No reason they should be the same because the buyers and sellers of prefs and bonds are quite different. You are welcome to use this with attribution, if you like. ******************************************

[Later] One minor glitch on this, the 1.07 Yield ratio is the inverse of the 1.40 bond equivalent yield, so for direct comparison should be more like 0.93.  Thus there is a 50% (1.40/0.93) after-tax yield advantage to pref shares compared with Duration = 5 bonds.

Well! The first problem I see is with the data. I looked up the issue Royal Bank 4.53% May 7, 2012. This is a deposit note, the most senior bank debt issued (and thus, in terms of credit quality, as far as you can get from a preferred while remaining with the same issuer). It’s basically a liquid institutional GIC and there is $950-million outstanding. According to Bloomberg, the yield on 5/11 was 4.53%.

This is quite the discrepency! If we go to Canadian Bond Indices, we can look at a graph of short-term yields – for both corporates and Canadas. The quoted figure, 4.21%, looks more like a plausible yield for a Canada 5-year, while 4.53% looks like an entirely reasonable value for a 5-year Royal Bank DN.

I suggest it’s better to compare long indices with the PerpetualDiscount index; this reduces the duration mis-match and diversifies away the asystemic risk introduced by using a single corporate for a comparison. Using data from the Bank of Canada we see that the Scotia / PC-Bond / Dex long-term all-corporate index was yielding 5.42% on May 9; going back to Canadian Bond Indices, we can say it’s about 5.8% now; and construct the following table:

Comparing Corporate Bonds and Prefs
  27-Dec-2006 9-May-07 30-Oct-07
Bond Yield 5.18% 5.42% ~5.80%
Bond Duration ~11.7 ~11.6 ~11.3
Discount Pref Yield 4.51% 4.65% 5.64%
Disc Pref Duration 11.73 16.12 14.45
Disc Pref
Interest
Equivalent
6.31% 6.51% 7.90%
Interest-
Equivalent
Yield Ratio
(Prefs : Bonds)
1.22:1 1.20:1  1.36:1
Interest-
Equivalent
Yield Spread
(Prefs – Bonds)
113bp 109bp 210bp 

So, pending further discussion, it does not appear to me that a bearish argument based on yield spreads in the current year is very convincing!

Update: My correspondent was the commentator prefhound. The delay in attribution was due to my wanting to check how he wanted the attribution made.

Reflections on a Bull

Friday, October 12th, 2007

My bullish correspondent has been busy and gleefully siezed on my comment yesterday that:

There was good volume in the preferred share market today … and continued declines in the perpetual sector which, quite frankly, I am at a loss to understand.

rate, the steepening in the past three weeks is stupendous. This is really strange!

and says that he is interested in my comments on his view that:

this is due to  the Commercial paper/subprime scare ….

Well, for what it’s worth, Mr. Bull, I think you’re right. I think we are seeing the confluence of a lot of factors:

  • Retail is avoiding assets that they don’t understand – and retail, in general, doesn’t understand preferred shares very well.
  • Retail is avoiding volatile assets – and perpetuals have certainly been showing volatility in the past six months.
  • Retail is avoiding asset classes in which they have recently been burnt – there were a lot of new issues last spring, much of it probably sold to unsophisticated investors who watched the market prices tank before they’d even received their monthly statement
  • Retail is avoiding asset classes which have not performed well in recent memory – performance of preferreds in general and perpetuals in particular has not been stellar for the past year or so
  • Retail is attempting to time the market. They are waiting for the bottom, therefore they will wait until they’re sure that prices are going up, therefore, probably, they will miss most of any rally that happens.

But, Mr. Bull, I want you to pay particular attention to my caveat: For what it’s worth.

  • How can any of the above statements be proven? If I were to say that relatively high spreads recently were due to the Tri-Lateral Commission acting under the orders of the Illuminati, how would you prove me wrong?
  • What predictive value does any of those statements have? They explain everything, cannot be falsified, and predict nothing.

I think we can agree that spreads are relatively high. And given this view, I will agree that a rational investment allocation model – for instance, one that says that the proportion of preferreds in a portfolio will be within a certain range – should probably be on the over-allocation side while long corporate bonds should be on the under-allocation side.

But the world is chaotic. We can formulate a beautiful asset allocation strategy … and tomorrow little green men from Mars will arrive with the secret of unlimited safe energy, requiring only extract of squid’s brain to run, which will give rise to a bull market in seafood and bear markets almost everywhere else.

So I make a deliberate attempt to avoid calling the market. Not because I don’t think I’m smart enough, but because there are too many random factors, too many of Colin Powell’s Unknown Unknowns, to make such an exercise a useful expenditure of time. Instead, I concentrate on weighing small differences between the various preferred share issues … up, down, I don’t care what the market does, as long as I do a nickel better, I’m happy. I can compare apples to apples, and give you good advice as to which one will be better. I cannot compare apples to squid’s brains.

If anybody tells you differently … find out why. Chances are, they’ve got great explanations and poor results.

Update: As if by magic, Accrued Interest has posted on this theme today.