Archive for July, 2006

Premium-Perpetual Yield Curve, 2006-07-28

Monday, July 31st, 2006

Another yield curve for your edification and amusement!

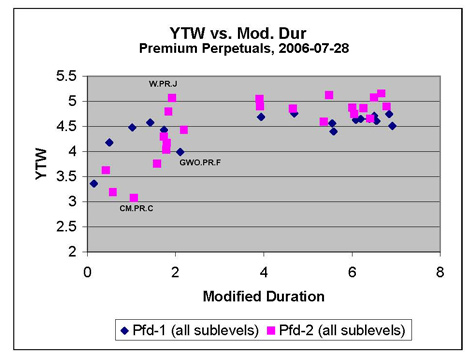
PerpPrem YTW Curve 2006-07-28

This one is similar in nature to Operating Retractibles yield curve discussed a few days ago, but does have some unique points of interest.

There’s a lot of scatter – more scatter than there really should be, given that the average volume traded is so much greater than the equivalent number for the constituents of the OpRet index. And, one should note, I didn’t plot a point for RY.PR.S, which has a Modified Duration of the YTW scenario of 0.16 Years, and a YTW of -1.82%.

The CM.PR.C and GWO.PR.F look rather expensive, don’t they? I certainly can’t figure out … the CM.PR.C looked good a little while ago, when they were trading in the neighborhood of $26.50 – I can’t say I’m so impressed with them nowadays, closing 7/31 with a quote of 26.76-87.

But the most strange thing by far about this curve is that, while the lower quality credits look to be at a more or less decent spread to their higher-rated peers at the long end (well … relatively long end, anyway!), they seem to be trading through them at the short end, and not by just a little bit.  Which would seem to indicate some opportunity for arbitrage …

What this graph does not, and cannot, convey is the degree of risk implicit in the fact that these are perpetuals … once market prices start to change, the position of each data point on this graph might change substantially – which is why HIMIPref has such concepts as ‘Portfolio Yield’ and ‘Option Doubt’. But as a first approximation, some of the anomalies shown by this plot look pretty juicy, don’t they?

July 28, 2006

Friday, July 28th, 2006
Index Current Yield (at bid) YTW Average Trading Value Mod Dur (YTW) Issues Day’s Perf. Index Value
Ratchet 4.21% 4.22% 92,290 17.01 2 0.3822% 997.9
Fixed-Floater 5.22 3.92% 99,784 5.17 5 0.1523% 1,004.8
Floater 4.54% -15.02% 59,223 6.43 5 0.1680% 1,003.4
Op. Retract 4.74% 3.19% 78,823 2.76 18 0.0154% 995.6
Split-Share 5.17% 3.93% 47,897 2.85 14 0.1909% 1,000.2
Interest Bearing 6.86% 5.15% 66,114 2.19 7 -0.1801% 1,009.4
Perpetual-Premium 5.32% 4.33% 124,166 3.86 40 0.0947% 1,005.8
Perpetual-Discount 4.77% 4.89% 388,850 15.84 14 0.0881% 1,005.8
Major Price Changes
Issue Index Change Notes
MST.PR.A InterestBearing -1.43% 3,832 shares traded. It was up 1.55% yesterday on 6,088 shares … easy come, easy go.
TDS.PR.B SplitShare +1.91% 900 shares traded. Somebody didn’t want many shares, but they REALLY wanted them. This issue is callable at 28.10 in November and is now quoted at 28.50-65. YTW is -0.03%
Volume Highlights
Issue Index Volume Notes
CM.PR.C PerpetualPremium 204,166 BMO crossed 200,000 @26.84 for delayed delivery.
SLF.PR.B PerpetualPremium 105,942 Gained 0.48% on day.
GWO.PR.G PerpetualPremium 35,570 Scotia bought 20,000 from CIBC @26.00
RY.PR.B PerpetualDiscount 14,000 Is the “Inventory Reduction Sale” over?
MFC.PR.C PerpetualDiscount 12,600  
SLF.PR.C PerpetualDiscount 10,900  

There were no other index-included issues with volume in excess of 10,000 shares.

My more observant readers will have noticed that the “Perpetual” index has been split into “Premium” and “Discount”. With a bi-modal distribution of index characteristics, the averages didn’t make a lot of sense. I don’t really know if this will be a permanent change – I’ll have to see what happens over time, when I get around to writing and testing automated index preparation software. If there aren’t any discount perpetuals in my database, for instance, I’m not sure what I’ll do or how meaningfully I’ll be able to present the results. Stay tuned!

Operating-Retractible Yield Curve, 2006-07-26

Friday, July 28th, 2006

Well, what are we to make of this yield curve?

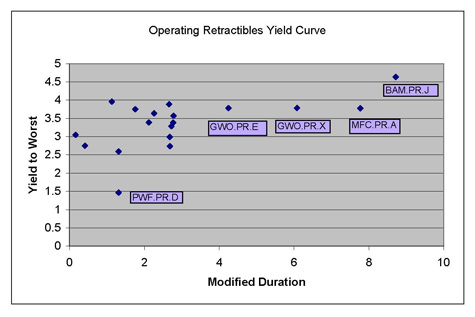
OpRet YTW Curve 2006-07-26

This yield curve was plotted from the data prepared for the ‘Operating Retractible’ Index on 2006-07-26. The x-axis is modified duration, the y-axis is the pre-tax yield to maturity. Both data elements are obtained from the “YTW Scenario” – i.e., assuming a maturity-date and associate redemption price that reflects the worst-case-scenario (given current conditions) for the shareholder.

Retractible prefs are the class of prefs that behave most like bonds (an assertion I’ll prove at some point in the future, probably in a published article … for now, just trust me!) so one would expect that a yield curve would be a relatively smooth looking thing.

No such luck! BAM.PR.J, with a yield of 4.54% until its presumed redemption in March 2018, well above the curve, while PWF.PR.D seems well below its peers, having a YTW of only 1.87% based on a call at $26.00 in November 2007.

Could it be that the market is pricing the latter issue based on a redemption at $25.00 immediately prior to the retraction date in October 2012? Its yield based on the 2012 call is currently 3.72%, which is much closer to what comparable issues are paying. It is, perhaps, due to this sort of behaviour that HIMIPref finds the concept of portfolio yield useful in preferred share valuation.

The graph shown isn’t definitive, of course. No allowance has been made for credit rating and it is certainly possible to argue that the yield premium available on BAM.PR.J is mere compensation for the risk that its Pfd-2(low) rating from DBRS implies relative to the other labelled data points, which are all Pfd-1(low) – or simply that its extremely long time until its retraction privilege becomes exercisable make the other data points irrelevant for pricing purposes. It is also entirely valid to argue that the market is pricing in higher yields for the future, which will make the earlier redemption of PWF.PR.D less likely.

Arguments, arguments … that’s what makes a market!

July 27, 2006

Thursday, July 27th, 2006
Index Current Yield (at bid) YTW Average Trading Value Mod Dur (YTW) Issues Day’s Perf. Index Value
Ratchet 4.21% 4.22% 93,792 17.01 2 -0.3969% 994.1
Fixed-Floater 5.23% 3.92% 101,384 7.48 5 0.3426% 1,003.3
Floater 4.55% -13.57% 59,955 6.44 5 0.0163% 1,001.8
Op. Retract 4.74% 3.35% 79,575 2.94 18 0.0154% 995.5
Split-Share 5.18% 4.17% 48,195 3.02 14 -0.2103% 998.3
Interest Bearing 6.85% 5.05% 66,536 2.20 7 0.1540% 1,011.2
Perpetual 5.19% 4.50% 191,523 6.93 54 0.0509% 1,004.9
Major Price Changes
Issue Index Change Notes
DFN.PR.A SplitShares -1.66% 9,500 shares traded
BCE.PR.A FixedFloater +1.34% 2,900 shares trade. It went ex-dividend today … did someone forget?
MST.PR.A SplitShares 1.55% 6,088 shares traded. Gapped from 10.30-40 to 10.46-50
Volume Highlights
Issue Index Volume Notes
SLF.PR.C Perpetual 135,540 70,000 share internal cross by BMO @24.15; BMO bought 61,600 shares from Dundee at 24.15 in seven trades in last few minutes of session.
HSB.PR.D Perpetual 126,750 BMO internal cross of 125,000 shares @26.00
BNS.PR.K Perpetual 110,040 BMO crossed 100,000 shares @25.20
TD.PR.O Perpetual 105,900 BMO crossed 100,000 @25.20
PWF.PR.A Floater 103,625 BMO crossed 100,000 @25.30

There were 15 issues with volume in excess of 10,000 shares.

July 26, 2006

Wednesday, July 26th, 2006
Index Current Yield (at bid) YTW Average Trading Value Mod Dur (YTW) Issues Day’s Perf. Index Value
Ratchet 4.17% 4.19% 96,309 17.05 2 +0.0200% 998.0
Fixed-Floater 5.19% 4.17% 99,950 11.2 5 0.0004% 999.8
Floater 4.55% -12.93% 60,535 6.45 5 -0.2771% 1,001.6
Op. Retract 4.74% 3.40% 79,912 2.99 18 0.0305% 995.3
Split-Share 5.16% 4.11% 48,834 2.96 14 0.1034% 1,000.4
Interest Bearing 6.85% 5.06% 67,184 2.20 7 -0.1400% 1,009.6
Perpetual 5.19% 4.53% 193,028 6.98 54 0.1018% 1,004.4
Major Price Changes
Issue Index Change Notes
AL.PR.E Floater -1.05% 1,800 shares traded
Volume Highlights
Issue Index Volume Notes
RY.PR.W Perpetual 176,230 Jennings crossed 147,500 @25.35
CM.PR.C Perpetual 110,378 BMO bought 100,000 from Scotia @26.90, which was the closing bid. At this price, the YTW of this issue is 2.54%
MFC.PR.B Perpetual 46,730 BMO crossed 44,000 @ 24.55
SLF.PR.B Perpetual 45,550  
PIC.PR.A SplitShare 21,925  
BNS.PR.K Perpetual 12,255  

There were 13 issues with volume in excess of 10,000 shares.

July 25, 2006

Tuesday, July 25th, 2006
Index Current Yield (at bid) YTW Average Trading Value Mod Dur (YTW) Issues Day’s Perf. Index Value
Ratchet 4.16% 4.17% 100,269 17.09 2 +0.0802% 997.8
Fixed-Floater 5.19% 4.16% 100,032 13.50 5 0.2057% 999.8
Floater 4.54% -15.19% 61,553 6.45 5 0.0407% 1,004.4
Op. Retract 4.74% 3.35% 80,532 2.98 18 0.1594% 995.0
Split-Share 5.17% 4.18% 48,741 3.03 14 -0.0569% 999.4
Interest Bearing 6.85% 5.02% 66,919 2.21 7 0.2830% 1,011.1
Perpetual 5.19% 4.57% 194,134 7.01 54 0.1012% 1,003.4
Major Price Changes
Issue Index Change Notes
BNA.PR.B SplitShare -1.00% 1,600 shares traded
WN.PR.B OpRet +1.50% 2,741 shares traded … YTW is now only 3.29%
HSB.PR.D Perpetual +1.17% 5,600 shares traded – RBC bought all day. A retail broker getting excited, maybe?
Volume Highlights
Issue Index Volume Notes
MFC.PR.C Perpetual 263,565 Gained 0.25% on day
BC.PR.C Fixed Floater 167,749 Gained 0.32% on day
CM.PR.C Perpetual 114,690 BMO bought 10,000 from Scotia @26.91, then crossed 68,550 @27.00 on delayed delivery. The YTW at the closing bid of 26.91 is only 2.50% pretax.

There were 20 issues with volume in excess of 10,000 shares.

TD.PR.N

Tuesday, July 25th, 2006

Mea culpa.

 I was doing some checks of the Operating Retractibles when I found that there was an error in the option schedule for TD.PR.N.

The last redemption period, to redeem at $25.00 until the end of time, begins on 2013-04-30, not 2012-04-30.

The change has been made on the server.

HPF.PR.B Credit Rating

Tuesday, July 25th, 2006

I just don’t understand the DBRS credit rating on this issue at all.

 Essentially, the company has two classes of preferred shares and one class of “common”. They have invested the proceeds in a portfolio … part of this portfolio has been sold forward to a counterparty in order to guarantee the return of principal for the senior preferred shares. Got that?

 OK, a simplified balance sheet, as of December 31, 2005, of this Split Share Corporation looks like this:

Assets (thousands, CAD)  
Pledged Portfolio 25,173
Other Assets 29,250
Total Assets 54,423
 
Liabilities (thousands, CAD)  
Misc. 850
Senior Pfd 33,068
Junior Pfd 19,445
Equity 1,060
Total Liabilities and Equity 54,423

Now, maybe to you and me, things look pretty dicey for the “Junior Preferreds” (Note that these are really called the “Series 2”). After all, they’re owed $19,445M on redemption and there’s only $20,505 to cover it – a coverage ratio of just 1.05:1.

But DBRS claims that the coverage ratio is 1.46:1 and, as far as I have been able to tell (and confirmed in a telephone call last March), here’s how they’ve done it: the amount due on maturity to the senior prefs is $33,068M, right? And that’s covered off by the forward agreement, right? And the portfolio to be delivered under the forward agreement is on the balance sheet for $25,173M, right?

 Therefore, DBRS concludes, there’s $7,895M guaranteed capital appreciation sitting right there! The forward contract has an intrinsic value of $7,895M ! So, for analytical purposes, in order to calculate the coverage for the Junior prefs, just stick another $7,895M into equity against the notional forward contract value, and then come up with a coverage ratio of:

Notional Junior Asset Coverage
Presumed Calculation to agree with DBRS Figures
Balance sheet value of Junior Prefs
(thousands, CAD)
19,445
Balance sheet equity 1,060
Off-balance-sheet equity from forward contract 7,895
Total value to cover Junior Prefs 28,400
Asset Coverage
(28,400 / 19,445)
1.46

Now, this calculation is absolutely nonsensical, of course, but as far as I could tell from the DBRS press release and from talking to their analyst, that’s exactly what they did.

‘Why is this nonsensical?’, you ask.

Well, there’s the small matter of the dividends that have to be paid on the Senior prefs. If you’re going to defease the principal repayment on the seniors, you can’t just forget all about the dividends due. They pay 5.85% annually …. they’re not due until June 29, 2012 …. where’s Mr. Calculator? … essentially, that payment stream of $0.1218 monthly has a present value of about $7.50 / share, or a total of about $10-million when discounted at 5.85%.

Knock $10-million off the amount available to cover the Juniors … and, hey, looky-looky! They’re in the red, with an asset coverage ratio of 0.95:1 !

Let’s try it another way, since that doesn’t look so good. Let’s just forget about the damn forward agreement and assign it a value of $0. That’s almost as bad: there is now $20,505 to cover $19,445 … asset coverage is 1.05:1.

It just doesn’t work. If you’re going to consider the Senior’s defeased, you have to defease all of it, not just the principal, and the dividend stream is just way too much.

 So what does an asset coverage of 1:1-ish mean for most companies? Let’s put it this way: on August 19, 2002, Sixty Split (SXT.PR.A) got downgraded to Pfd-4 when its coverage ration reached 1.28:1.

How these HPF.PR.Bs are maintaining their DBRS rating of Pfd-2(low) [Stable] is something I just don’t understand.

Note Added: In case anybody has the idea that dividends on the securing portfolio will offset the dividends to be paid on the senior shares, I’ll quote from the prospectus:

Under the Series 1 Forward Agreement, all dividends and distributions, including extraordinary distributions, declared and paid on the Series 1 Repayment Portfolio securities will be paid to the Company and the amount payable on the Termination Date may be correspondingly reduced. In order to minimize the likelihood that such dividends or distributions will be paid, the Company intends to acquire non-dividend paying shares of Canadian public companies for the Series 1 Repayment Portfolio. If any such dividends or distributions are declared on securities in the Series 1 Repayment Portfolio, the Series 1 Forward Agreement may be amended to provide that replacement securities acceptable to the Counterparty be substituted for the securities in respect of which the dividend or distribution has been declared to preserve the value of the forward transaction prior to the occurrence of such event.


Note also that:

The Company will pay dividends on the Offered Shares primarily from net realized capital gains, including premiums from writing covered call options on the securities held in the Managed Portfolio in which it is permitted to invest and from distributions and interest received on that portion of the Managed Portfolio invested in securities of Income Funds and debt securities.

In other words, they’re not going to get any covered call income from the securing portfolio, either, and finally: 

In order to achieve the Company’s regular monthly dividends on the Series 1 Shares and Series 2 Shares, the Company will be required to generate an average annual return on the Managed Portfolio of approximately 12% if the value of the Managed Portfolio is maintained intact until the Termination Date

Well, DBRS apparently thinks they can do it! Let’s hope so, because there’s not much room for error.
July 24, 2006

Monday, July 24th, 2006
Index Current Yield (at bid) YTW Average Trading Value Mod Dur (YTW) Issues Day’s Perf. Index Value
Ratchet 4.14% 4.16% 103,936 17.13 2 +0.0802% 997.0
Fixed-Floater 5.20% 4.17% 95,964 13.49 5 0.0869% 997.8
Floater 4.54% -15.38% 61,155 6.43 5 0.2491% 1,004.0
Op. Retract 4.75% 3.48% 80,782 2.99 18 -0.0679% 993.4
Split-Share 5.17% 4.23% 49,600 3.10 14 -0.0009% 999.9
Interest Bearing 6.87% 5.30% 66,930 2.21 7 -0.0233% 1,008.2
Perpetual 5.20% 4.61% 195,623 7.02 54 0.0520% 1,002.4
Major Price Changes
Issue Index Change Notes
TDS.PR.B SplitShare -1.05% 2,990 shares traded, which was enough to blow through the bid. Some traded at 28.01, a penny above the 52-week low, but it closed at 28.25-49. Not much size on the bid, though!
Volume Highlights
Issue Index Volume Notes
WN.PR.E Perpetual 304,550 Huge volume for a pref! But 300,000 of this was an internal cross [both sides of the trade were controlled by the same asset manager] by BMO @24.00.
RY.PR.W Perpetual 258,700 Second day of good volume. 175,000 was an internal cross by BMO @25.40; 38,100 was a CSH Cross by Global (cash trade, not three-day-settlement) @25.88; and 38,100 (presumably the same 38,100) was a cross by Global @25.57. Closed at 25.31-56. Man, did the purchaser of that CSH transaction get screwed! Perhaps it was a buy-in notice?
SLF.PR.C Perpetual 179,650 175,000 internal cross by BMO @24.02
TD.PR.M OpRet 175,500 175,000 internal cross by BMO @27.30
TD.PR.O Perpetual 112,700 100,000 internal cross by BMO @25.25

A busy day for BMO, if no-one else! If they were able to charge a nickel a share on the crosses, then they went home with a warm, fuzzy feeling. Somebody’s rejigging his pref portfolio!

RY.PR.A closed at 24.18-25, while RY.PR.B ended at 24.45-50, so perhaps things are beginning to normalize a little … at least so far as that particular pair is concerned!

 There were 20 issues with volume in excess of 10,000 shares.

 Update, 2006-07-27: Just realized! The ex-date for the RY.PR.W was July 24, so the purchaser of the CSH – settled RY.PR.W got the dividend of $0.30625.

Why not always buy the highest valued shares?

Monday, July 24th, 2006

PrefBlog Reader Drew asked on the Comments and Requests: HIMIPref thread:

Thanks for the response. One of the reasons for my question is that I noticed recently that HIMIPref gives high valuation scores to a couple of the operating retractibles, specifically those of GWO and MFC, but instead of recommending them for purchase it recommends a perpetual issue with a lower valuation score. I do own several split share issues but no operating retractibles. Is it likely that HIMIPref is recommending the lower valuation issue due to overall portfolio risk considerations?

Well, I responded on the wrong thread, initially, but I’ll reprint it here:

 There are a number of possibilities:

(i) It may be due to weight constraints set in your constraints specifications file. It is possible to set this file such that, for instance, you would hold only perpetuals.

(ii) More likely, it is due to the relative riskDistance between the various issues. Essentially, the valuation pick-up is divided by the risk distance and it is this value that must exceed the hurdle in order for the trade to be recommended. The risk distance between a perpetual and another perpetual will normally be greater than that between a perpetual and a retractible.
The concept of risk distance was introduced on the basis that issues are more easily compared the more similar they are. In other words, you can discriminate more easily between two high quality perpetual issues than you can between a hiqh quality perpetual and a low quality split share. The second trade will have a higher risk distance than the first; the second may well have a higher raw valuation pick-up but a lower trade score.
In the “Issue Method” of trade evaluation, this concept is used by the system in an effort to ensure that each individual trade, once recommended, has an equal chance of being profitable.
In the “Portfolio Method”, risk distance is measured from the pre-trade portfolio to the index and then from the post-trade portfolio to the index, in an effort to ensure that a portfolio mis-match of risk characteristics from the index is justified by excess expected return.