Archive for November, 2012

BoC Releases Summer 2012 Review

Saturday, November 17th, 2012

This post is really late, I know. But I’m catching up slowly!

The Bank of Canada has released the Bank of Canada Review: Summer 2012 with the articles:

  • Measurement Bias in the Canadian Consumer Price Index: An Update
  • Global Risk Premiums and the Transmission of Monetary Policy
  • An Analysis of Indicators of Balance-Sheet Risks at Canadian Financial Institutions

The first article, by Patrick Sabourin, makes the point:

Commodity-substitution bias reflects the fact that, while the weights of items in the CPI basket are held constant for a period of time, a change in relative prices may cause patterns in consumer spending to change. If, for example, the price of chicken were to increase considerably following supply constraints, consumers would likely purchase less chicken and increase their consumption of beef, since the two meats may be perceived as substitutes for each other. The CPI, however, assumes that consumers would continue to purchase the same quantity of chicken following a price change. This means that the measured change in the CPI will overstate the increase in the minimum cost of reaching a given standard of living (i.e., there is a positive bias).

I’ve always had trouble with this concept. I love beef. I despise chicken. As far as I am concerned, there is a separate quality adjustment that must be made that would mitigate, if not completely offset, the substitution adjustment when beef becomes too expensive and I have to eat chicken.

And, I am sure, this occurs for every other possible substitution. Although I might try explaining to my girlfriend that Coach handbags have become too expensive and I will follow theoretically approved procedure and get her, say, a plastic shopping bag for Christmas instead.

The second article, by Gregory H. Bauer and Antonio Diez de los Rios examines the relationship between long- and short-term interest rates:

ƒƒ

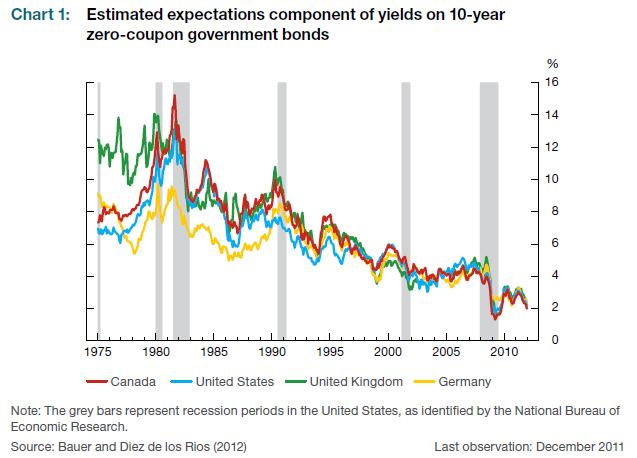
  • An important channel in the transmission of monetary policy is the relationship between the short-term policy rate and long-term interest rates.
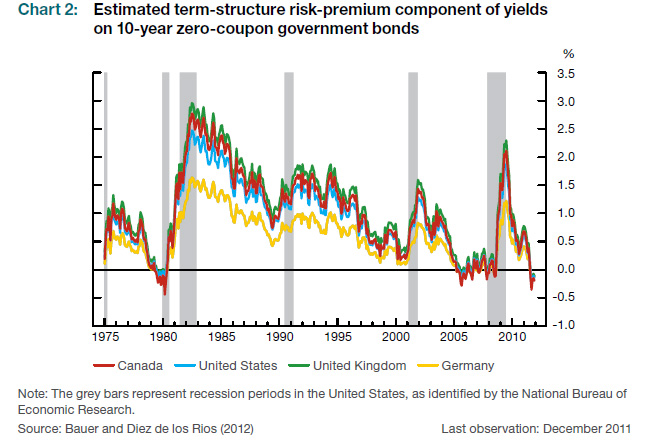
  • Using a new term-structure model, we show that the variation in long-term interest rates over time consists of two components: one representing investor expectations of future policy rates, and another reflecting a term-structure risk premium that compensates investors for
    holding a risky asset.

  • The time variation in the term-structure risk premium is countercyclical and largely determined by global macroeconomic conditions. As a result, long-term rates are pushed up during recessions and down during times of expansion. This is an important phenomenon that central banks need to take into account when using short-term rates as a policy tool.
  • We illustrate this phenomenon by showing that the “conundrum” observed in the behaviour of long-term interest rates when U.S. monetary policy was tightened during the 2004–05 period was actually part of a global phenomenon.

In their model:

The long-term rate is decomposed into two terms in the following equation:

The first term involves market expectations, that is, the average expected 1-year interest rate over the next 10 years. In our model, we use the 1-year interest rate in country j as a proxy for that country’s policy rate. Observed yields will, on average, equal the expectations component only under the “expectations hypothesis,” which has been statistically rejected in many studies.

The rejection of the expectations hypothesis is typically attributed to the existence of the second term in equation (1), a time-varying term-structure risk premium. The risk premium represents the extra compensation that investors require for holding a 10-year bond. In our model, agents hold portfolios for one year, and the prices of long-term bonds may change considerably over that period, necessitating a higher expected rate of return. Several studies have focused on the properties of the term-structure risk premium (see Cochrane and Piazzesi (2005) and their references).

The second real-world aspect of the model consists of the constraints placed
on the time-varying risk premium, the second component of equation (1). Previous work has shown that imposing restrictions on the term-structure risk premium makes the forecast values of interest rates more realistic than those in unrestricted models.7 Our model restricts risk premiums on bonds through its assumption of global asset pricing; i.e., in integrated international markets, only global risks carry significant risk premiums. As a result, the term-structure risk premium on any bond is driven by the bond’s exposure to the global level and slope factors only. The local factors, while helping to explain prices at a point in time, do not affect expected returns (i.e., changes in prices), since investors can eliminate their effects by diversifying with a global portfolio.


Click for Big


Click for Big

This effect is evident during the financial crisis of 2007–09. While short-term U.S. rates fell by 263 basis points, long-term U.S. rates decreased by a mere 23 basis points. This occurred because, although the Fed succeeded in lowering expectations of future policy moves by 224 basis points (Table 2), the term-structure risk premium rose by 190 basis points.

The analysis in this article demonstrates the extent to which the global term-structure risk premium as well as monetary policy actions influence long-term interest rates. The risk premium is countercyclical to the global business cycle and thus may affect long-term interest rates in the opposite direction to that related to central bank policy actions. As a result, central banks need to take these forces into account in appropriately calibrating their policy response. Indeed, given the current low level of long-term rates, understanding movements in the global risk premium is important for the monetary policy decision-making process.

Since monetary policy may affect expectations and the term-structure risk premium differently, the levels of these two components may, in turn, affect the macroeconomy in various ways. For these reasons, understanding the effects on growth and inflation of movements in market expectations and the global term-structure risk premium is an important aim for future research.

The third article, by David Xiao Chen, H. Evren Damar, Hani Soubra and Yaz Terajima, will be of interest to students of Canadian banking and regulation thereof:

    ƒƒ

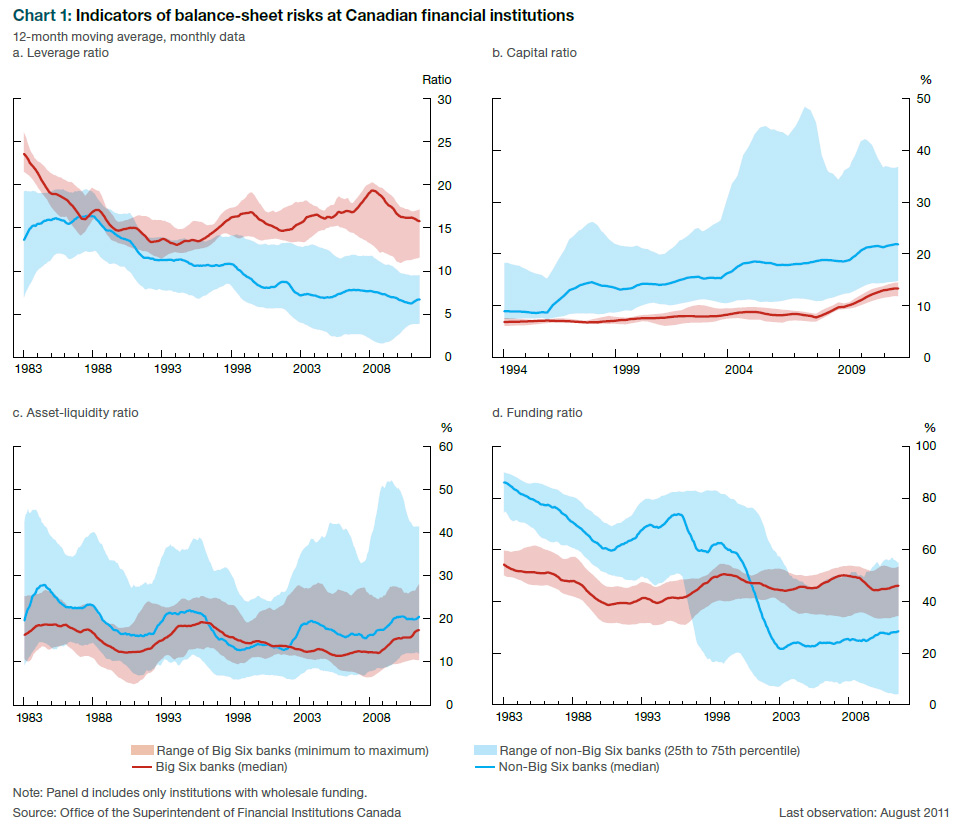
  • This article compares different types of Canadian financial institutions by examining over time ratios that are indicators of four balance-sheet risks—leverage, capital, asset liquidity and funding.
  • The various risk indicators have decreased during the past three decades for most of the non-Big Six financial institutions in our sample and have remained relatively unchanged for the Big Six banks, resulting in increasing heterogeneity in these indicators of balance-sheet risks.
  • The observed overall decline and increased heterogeneity in the risk indicators follow certain regulatory changes, such as the introduction of liquidity guidelines on funding in 1995 and the implementation of bank specific leverage requirements in 2000. This suggests that regulatory changes have had significant and heterogeneous effects on the management of balance sheets by financial institutions and, given that these regulations required more balance-sheet risk management, they contributed to the increased resilience of the banking sector.

Click for Big

Of particular interest is the funding ratio, defined as:

we define a funding ratio as the proportion of a bank’s total assets that are funded by wholesale funding (a relatively less stable funding source than retail (personal) deposits, for example):

Funding ratio (%) = 100 x (Non-personal deposits + repos)/Total assets.

A higher funding ratio indicates that a bank relies on greater market-based funding and is therefore more exposed to adverse shocks in the market that could disrupt continuous funding of its assets.

The Funding Ratio is of great interest due to Moody’s recent highlighting of:

the large Canadian banks’ noteworthy reliance on confidence-sensitive wholesale funding, which is obscured by limited public disclosure, increases their vulnerability to financial markets turmoil.

The BoC paper also highlights the eagerness of the politicians to inflate the housing bubble:

In addition, the growing popularity of mortgage-loan securitization in the late 1990s, following the introduction of the Canada Mortgage Bonds Program, raised the percentage of mortgage loans on bank balance sheets, especially among large and medium-sized financial institutions.(note)

Note reads: Increasing demand for mortgage loans caused by demographic shifts and lower down-payment
requirements has also played a role. See Chen et al. (forthcoming) for more details.

The authors conclude:

This article analyzes the balance-sheet ratios of Canadian financial institutions. Overall, various measures of risk have decreased over the past three decades for most non-Big Six institutions and have remained relatively unchanged for the Big Six banks. We find that smaller institutions, particularly trust and loan companies, generally have lower leverage and higher capital ratios than other types of financial institutions, including the Big Six banks. They also have larger holdings of liquid assets and face lower funding risk compared with other financial institutions. The observed overall decline and increased heterogeneity in risk (as measured by divergent trends in the leverage, capital and asset-liquidity ratios) followed certain regulatory changes, such as the introduction of liquidity guidelines on funding in 1995 (which preceded a sharp decline in, and more dispersion of, funding ratios among non-Big Six institutions) and the implementation of bankspecific leverage requirements in 2000 (which preceded a divergence in leverage ratios between the Big Six and non-Big Six institutions). This suggests that regulatory changes had significant and heterogeneous impacts on the management of balance sheets by financial institutions, resulting in the increased resilience of the banking system. While market discipline may have also played a role, more research is needed to identify changes in the degree of market discipline in the Canadian banking sector.

Given the observed variation in behaviour among Canadian financial institutions, continued analysis of different types of institutions can enable a more comprehensive assessment of financial stability. Understanding the different risks faced by various types of financial institutions improves the framework that the Bank of Canada uses to monitor developments of potential risks in the banking sector.

The statement that “This suggests that regulatory changes had significant and heterogeneous impacts on the management of balance sheets by financial institutions, resulting in the increased resilience of the banking system.” strikes me as being a little bit fishy. Regulatory change did indeed have “significant and heterogeneous impacts on the management of balance sheets by financial institutions”, but whether this resulted “in the increased resilience of the banking system.” has not been addressed in the paper. That was the intention, certainly, and may well be true, but a cause and effect relationship has not been demonstrated.
November 16, 2012

Saturday, November 17th, 2012

The US gift to the farmers’ lobbyists will continue:

President Barack Obama’s administration rejected a request from the governors of eight U.S. states to waive requirements for blending corn-based ethanol into gasoline, said a person familiar with the decision.

This year’s U.S. corn harvest is forecast at 10.725 billion bushels, the smallest in six years because of the drought. About 4.5 billion bushels will be used to make ethanol in the year starting Sept. 1, or about 42 percent of the 2012 crop, the USDA estimated on Nov. 9.

If it was about being nice little goody-greens, they’d make the ethanol from Brazilian sugar beets or sugar cane. But it has nothing to do with the environment.

Canaccord Financial, proud issuer of CF.PR.A and CF.PR.C, was confirmed at Pfd-3(low), Trend Negative, by DBRS:

DBRS has today confirmed its rating of the Preferred Shares of Canaccord Financial Inc. (Canaccord or the Company) at Pfd-3 (low). The Negative trend, which was assigned in December 2011 following the announcement of the Company’s $400 million acquisition of Collins Stewart Hawkpoint plc (CSHP), is being maintained. Initially, the Negative trend was assigned to reflect the relatively large size of the Collins Stewart acquisition, financing uncertainty and integration risk, given the uncertain ambient market environment. The Company’s second issue of preferred shares in April 2012 ($100 million), combined with some excess working capital, allowed the Company to repay the $150 million short-term credit facility drawn to fund part of the $244 million cash portion of the acquisition cost, which addresses most of the financing concern. The integration appears to be proceeding smoothly, notwithstanding over $35 million in associated restructuring cost provisions, mitigated by good potential for realizing expense and revenue synergies in the Company’s U.K. and U.S. operations. The weak market environment nevertheless continues to be a source of concern for DBRS.

The nature of the Company’s products and services, as well as the natural resource orientation of its client base, expose it to a great deal of revenue volatility related to economic and market cycles, including both capital and commodity markets. Normally, the adverse impact of such market exposures and associated revenue volatility on earnings and cash flow would be mitigated by the Company’s flexible cost base and the absence of operating leverage. Even though the Company has made strategic investments to diversify away from these market exposures while actively addressing its cost base, the current market environment is especially unfavourable for the broker-dealer industry, depressing earnings and cash flow below what DBRS believes should be sustainable in the long run. While DBRS applauds the strategic and expense initiatives taken by the Company to date, the level of uncertainty surrounding the Company’s industry makes it inappropriate to remove the Negative rating trend at this time.

HSBC Bank Canada, proud issuer of HSB.PR.C, HSB.PR.D and HSB.PR.E was confirmed at Pfd-2(high) [Review Negative] by DBRS:

DBRS has today confirmed the ratings of HSBC Bank Canada (HSBC or the Bank) and related entities, including the Bank’s Long-Term Deposits and Senior Debt rating at AA and its Short-Term Instruments rating at R-1 (high). All ratings remain Under Review with Negative Implications.

On July 20, 2012, DBRS placed all the ratings of HSBC Bank Canada and related entities Under Review with Negative Implications following the rating action of Under Review with Negative Implications on the ratings of HSBC Holdings plc (the Parent). Under DBRS’s global bank rating methodology, HSBC Bank Canada has been assigned a support assessment of SA1, reflecting expected timely support from the Parent, of which HSBC Bank Canada’s ratings are largely based on. DBRS anticipates resolving the ratings review on HSBC Bank Canada once the review has been completed for HSBC Holdings plc.

Shaw Communications, proud issuer of SJR.PR.A, was confirmed at Pfd-3 by DBRS:

DBRS has today confirmed Shaw Communications Inc.’s (Shaw or the Company) Issuer Rating at BBB, Senior Notes rating at BBB, and Preferred Shares rating at Pfd-3; the trends remain Stable. The confirmation reflects the view that the Company’s earnings profile remains reasonable for its current rating category, based on its incumbent position in Western Canada, large subscriber base and industry-leading operating margins, while acknowledging that intensifying competition is placing increasing pressure on the Company’s cable television and broadband subscriber base. DBRS notes that slowing top-line growth in recent periods is also somewhat offset by the fact that key credit metrics remain reasonable for the current rating category.

Shaw’s revenue growth rate decelerated to 5.4% in F2012 versus almost 10% in prior years as Shaw’s broadband Internet and home phone subscriber growth was partially offset by declines in cable TV subscribers. The Company’s TV segment lost 70,000 basic cable subscribers (predominantly to TELUS Corporation) over the period while Internet and home phone subscriber growth decelerated compared to prior years. That said, consolidated operating margins remained relatively stable at 43%, resulting in EBITDA growth of 4% to $2.1 billion. Shaw’s financial profile remains relatively stable and consistent with the current rating category as operating income/cash flow generation and debt levels have remained fairly steady. Gross debt-to-EBITDA decreased slightly to 2.47 times (x) for F2012 from 2.56x the prior year.

It was a mixed day for the Canadian preferred share market, with PerpetualPremiums off 1bp, FixedResets gaining 6bp and DeemedRetractibles flat. Volatility was low. Volume was very low – have we hit the Christmas slump yet?

HIMIPref™ Preferred Indices
These values reflect the December 2008 revision of the HIMIPref™ Indices

Values are provisional and are finalized monthly
Index Mean
Current
Yield
(at bid)
Median
YTW
Median
Average
Trading
Value
Median
Mod Dur
(YTW)
Issues Day’s Perf. Index Value
Ratchet 0.00 % 0.00 % 0 0.00 0 0.1882 % 2,451.3
FixedFloater 4.18 % 3.51 % 29,711 18.28 1 0.0000 % 3,853.3
Floater 2.82 % 3.02 % 55,523 19.63 4 0.1882 % 2,646.8
OpRet 4.61 % 2.48 % 62,895 1.31 4 0.0344 % 2,591.6
SplitShare 5.39 % 4.86 % 55,920 4.43 3 -0.7420 % 2,844.7
Interest-Bearing 0.00 % 0.00 % 0 0.00 0 0.0344 % 2,369.8
Perpetual-Premium 5.25 % 2.76 % 73,679 0.89 30 -0.0052 % 2,319.1
Perpetual-Discount 4.87 % 4.92 % 99,675 15.57 3 -0.0410 % 2,611.4
FixedReset 4.98 % 3.00 % 201,264 3.95 75 0.0599 % 2,450.7
Deemed-Retractible 4.91 % 3.43 % 121,791 0.93 46 -0.0041 % 2,398.2
Performance Highlights
Issue Index Change Notes
BNA.PR.E SplitShare -1.17 % YTW SCENARIO
Maturity Type : Hard Maturity
Maturity Date : 2017-12-10
Maturity Price : 25.00
Evaluated at bid price : 25.25
Bid-YTW : 4.86 %
GWO.PR.I Deemed-Retractible -1.02 % YTW SCENARIO
Maturity Type : Hard Maturity
Maturity Date : 2022-01-31
Maturity Price : 25.00
Evaluated at bid price : 24.35
Bid-YTW : 4.96 %
PWF.PR.M FixedReset 1.15 % YTW SCENARIO
Maturity Type : Call
Maturity Date : 2014-01-31
Maturity Price : 25.00
Evaluated at bid price : 26.37
Bid-YTW : 1.62 %
Volume Highlights
Issue Index Shares
Traded
Notes
BMO.PR.N FixedReset 135,177 Nesbitt crossed 60,000 at 26.30, then sold 50,000 to Scotia at 26.32 and 20,000 to TD at 26.32.
YTW SCENARIO
Maturity Type : Call
Maturity Date : 2014-02-25
Maturity Price : 25.00
Evaluated at bid price : 26.35
Bid-YTW : 2.08 %
POW.PR.G Perpetual-Premium 57,002 RBC crossed 54,700 at 27.15.
YTW SCENARIO
Maturity Type : Call
Maturity Date : 2017-04-15
Maturity Price : 26.00
Evaluated at bid price : 27.11
Bid-YTW : 4.45 %
IFC.PR.A FixedReset 53,863 National crossed 50,000 at 25.52.
YTW SCENARIO
Maturity Type : Hard Maturity
Maturity Date : 2022-01-31
Maturity Price : 25.00
Evaluated at bid price : 25.56
Bid-YTW : 3.52 %
CU.PR.C FixedReset 53,200 Scotia crossed 50,000 at 26.00.
YTW SCENARIO
Maturity Type : Call
Maturity Date : 2017-06-01
Maturity Price : 25.00
Evaluated at bid price : 26.00
Bid-YTW : 3.03 %
FTS.PR.J Perpetual-Premium 49,011 Recent new issue.
YTW SCENARIO
Maturity Type : Call
Maturity Date : 2021-12-01
Maturity Price : 25.00
Evaluated at bid price : 25.21
Bid-YTW : 4.67 %
RY.PR.X FixedReset 27,750 Scotia crossed 25,000 at 26.85.
YTW SCENARIO
Maturity Type : Call
Maturity Date : 2014-08-24
Maturity Price : 25.00
Evaluated at bid price : 26.76
Bid-YTW : 2.13 %
There were 14 other index-included issues trading in excess of 10,000 shares.
Wide Spread Highlights
Issue Index Quote Data and Yield Notes
ELF.PR.F Perpetual-Premium Quote: 25.27 – 25.84
Spot Rate : 0.5700
Average : 0.3760

YTW SCENARIO
Maturity Type : Call
Maturity Date : 2013-10-17
Maturity Price : 25.00
Evaluated at bid price : 25.27
Bid-YTW : 4.62 %

HSB.PR.C Deemed-Retractible Quote: 25.81 – 26.50
Spot Rate : 0.6900
Average : 0.5013

YTW SCENARIO
Maturity Type : Call
Maturity Date : 2012-12-16
Maturity Price : 25.50
Evaluated at bid price : 25.81
Bid-YTW : -1.94 %

MFC.PR.F FixedReset Quote: 24.23 – 24.62
Spot Rate : 0.3900
Average : 0.2654

YTW SCENARIO
Maturity Type : Hard Maturity
Maturity Date : 2022-01-31
Maturity Price : 25.00
Evaluated at bid price : 24.23
Bid-YTW : 3.67 %

GWO.PR.I Deemed-Retractible Quote: 24.35 – 24.60
Spot Rate : 0.2500
Average : 0.1585

YTW SCENARIO
Maturity Type : Hard Maturity
Maturity Date : 2022-01-31
Maturity Price : 25.00
Evaluated at bid price : 24.35
Bid-YTW : 4.96 %

BNA.PR.C SplitShare Quote: 24.37 – 24.62
Spot Rate : 0.2500
Average : 0.1642

YTW SCENARIO
Maturity Type : Hard Maturity
Maturity Date : 2019-01-10
Maturity Price : 25.00
Evaluated at bid price : 24.37
Bid-YTW : 5.02 %

BAM.PF.A FixedReset Quote: 25.89 – 26.18
Spot Rate : 0.2900
Average : 0.2098

YTW SCENARIO
Maturity Type : Call
Maturity Date : 2018-09-30
Maturity Price : 25.00
Evaluated at bid price : 25.89
Bid-YTW : 3.95 %

CPX.PR.A Downgraded by S&P

Saturday, November 17th, 2012

Standard & Poor’s has announced:

  • •We are lowering our long-term corporate credit and senior unsecured debt ratings on Capital Power Corp. (CPC) and subsidiary Capital Power L.P. to
    ‘BBB-‘ from ‘BBB’.

  • •We are also lowering our global scale preferred stock rating on CPC to ‘BB’ from ‘BB+’, and our Canada scale rating to ‘P-3’ from ‘P-3(High)’.
  • •We base the downgrade on weakness in the Alberta power market, which we forecast will not improve materially in the medium term.
  • •The lower amount of hedging the partnership is undertaking with respect to its Alberta merchant power heightens its significant exposure to lower Alberta forecast prices.
  • •The stable outlook reflects our view that adjusted funds from operations-to-debt will remain below the 20% threshold we associate with the ‘BBB’ rating.


The ratings on CPC and CPLP reflect Standard & Poor’s opinion of the partnership’s strong business risk profile and significant financial risk profile. Providing key support to the ratings is a more measured perspective on growth and a moderately diversified generation portfolio, which consists of a relatively young fleet. Moreover, the partnership recently completed the Quality Wind project under budget, reducing construction risk and demonstrating strong project development capability. We also believe CPLP benefits from a portion of its cash flow from long-term power purchase contracts with predominantly creditworthy counterparties, which add predictability. In our view, offsetting these strengths is a high degree of leverage, notwithstanding the partnership’s efforts to reduce leverage through such things as equity issuance, which exposes it to weakening in power prices, particularly in light of a relatively large open position. We believe this heightens the volatility of cash flow.

GMP.PR.B: Trend Negative by DBRS

Saturday, November 17th, 2012

DBRS has announced that it:

has today confirmed the Pfd-3 (low) rating on the Preferred Share obligations of GMP Capital Inc. (GMP or the Company), but has changed the trend on the rating to Negative. The rating reflects the strength of the Company’s business franchise as a premier provider of investment banking and capital markets products and services to its targeted market of mid-sized Canadian companies, most of whom operate in the resource and energy sectors. The change in trend, however, reflects the current adverse market environment for the Company’s resource-oriented clients and DBRS’s belief that these conditions are not likely to turn favourable in the short term. While the Company has invested in geographical and business line diversification, largely through the 2011 acquisition of U.S.-based Miller Tabak Roberts Securities, LLC (MTR), which has provided new market opportunities and revenues, the weak market environment has caused earnings to remain weak since Q2 2011.

The slump in underwriting and trading activities, which DBRS does not expect to recover in the short-to-medium-term, given the weak global economic outlook and continued absence of investor confidence, suggests that a Negative trend is appropriate until the Company returns to a healthy and sustainable level of net income, steady capital accumulation and improving capitalization ratios. In the current environment, the Company’s 32.7% interest in Richardson GMP, a high net worth wealth management operation with over $14 billion in assets under administration (AUA), is operating at break-even and is therefore not a source of profitable diversification for the Company. Similarly, the failure of the Company’s investment in EdgeStone Capital Partners, L.P., removes some of its previous potential for earnings diversification

November 15, 2012

Friday, November 16th, 2012

It will be interesting to learn all the unintended consequences:

As France begins collecting its financial-transactions tax this month, it is becoming evident that President Francois Hollande’s levy is hitting all but the people it was aimed at: speculators.

Hollande, who called finance his “main adversary” during his election campaign, pushed through in August a 0.2 percent transaction tax on share purchases, making France the first and only country so far in Europe to have such a levy. Many investors have been escaping the tax using so-called contracts for difference, or CFDs, offered by prime brokers that let them bet on a stock’s gain or loss without owning the shares.

“The target was supposed to be finance with a capital F, which is sort of a black box,” said Jacques Porta, who helps manage $627 million at Ofi Patrimoine in Paris. “Instead, we are punishing small investors who aren’t to blame and already are frightened off by losses in the market.”

How about an update on bank bonds?

Case in point: a new report from Moody’s Investors Service found that bank debt issues around the world have been chopped in half since the onset of the financial crisis. After peaking at roughly $2.4-trillion (U.S.) a quarter in 2007, banks globally are now issuing unsecured debt that amounts to just half that.

First it was North American issues – chiefly the U.S. – that plummeted in 2008 and 2009, and more recently it’s been European banks, particularly those on the periphery of the euro zone. The only area of the world seeing an uptick in issuance right now is Asia, where long-term bank debt issues are up 6 per cent over the 12 months ended Sept. 30. (Canada on its own is also faring well.)

The drop-off has a few implications. Chiefly, it affects how much money the banks can lend. For that reason, it’s sparked a push for deposits as a cheap source of funds.

The slowdown also gives the banks an incentive to ramp up their covered bond offerings.

To understand just how much covered bond spreads have tightened, making them more favourable, in 2009 they blew out to roughly 240 basis points in the U.K. Now they’re back to about 60 basis points.

With the election out of the way, the Keystone pipeline of TCA and TRP is in the news again:

Environmentalists are reviving their noisy 2011 anti-pipeline campaign, with a demonstration scheduled for Sunday outside the White House, and they have pointed to the decision on the Keystone pipeline as a key test of the President’s resolve to battle climate change during his second term. Former U.S. vice-president Al Gore this week urged Mr. Obama to kill the Keystone XL project.

On Thursday, TransCanada got a boost when the Building & Construction Trades and the American Petroleum Institute each called on Mr. Obama to move quickly to approve the controversial project, which will carry 1.1-million barrels per day of oil-sands bitumen from Alberta and lighter oil from North Dakota’s Bakken fields to the U.S. Gulf Coast.

Julie Dickson gave a speech titled Substance over Form at the 2012 Life Insurance Invitational Forum, but there wasn’t much in it:

Just as many now recognize that it was a mistake to believe that low rates would be a short-term, transitory phenomenon, it would also be a mistake to assume that we could never again be faced with very high interest rates.

Insurers will remember what happened in the 1980s, when rates spiked to historically high levels and the insurers’ business model came under pressure, as policyholders found life policies with savings features unattractive and decided to turn to banks for savings products. (You may recall that this led to the expression, “Buy term and invest the rest.”)

Let me switch to banking for a minute to expand on this point. Lately, I have seen a number of articles suggesting that Basel III is too complex and that Basel III capital calculations cannot be relied upon. I think such thinking is misguided. OSFI’s view is that Basel III can be relied upon – if proper risk management and governance at financial institutions is in place, and if supervisors are active and diligent in their work of overseeing Basel III implementation. Combined with a leverage ratio, Basel III, properly implemented, will fundamentally enhance financial stability. It might be better for people to focus more on the quality of supervision, and focus less on Basel III complexity.

As we point out in the Life Insurance Regulatory Framework, OSFI expects to consult significantly with industry over the coming years so that major regulatory capital changes can be implemented by 2015. Risk management will form a big part of that consultation.

Naturally, future employment prospects of OSFI personnel are not forgotten:

OSFI recognizes that small- to medium-sized companies, or those of less complexity with predictable and diversifiable risk, may not be able to afford a dedicated CRO to lead the risk management function. In these cases, we accept that the individuals responsible for risk management can also be performing other functions. But even in small, less complex businesses, we want to see a risk management process on which the board of directors, the CEO, senior management team, and policyholders can rely. As an example, we would want the board to meet in camera with the person who owns the risk management role as part of his or her responsibilities.

It was another mixed day for the Canadian preferred share market, with PerpetualPremiums gaining 2bp, FixedResets off 2bp and DeemedRetractibles down 5bp. Volatility was low. Volume was low.

HIMIPref™ Preferred Indices
These values reflect the December 2008 revision of the HIMIPref™ Indices

Values are provisional and are finalized monthly
Index Mean
Current
Yield
(at bid)
Median
YTW
Median
Average
Trading
Value
Median
Mod Dur
(YTW)
Issues Day’s Perf. Index Value
Ratchet 0.00 % 0.00 % 0 0.00 0 -0.6545 % 2,446.7
FixedFloater 4.18 % 3.51 % 30,908 18.28 1 -0.4376 % 3,853.3
Floater 2.82 % 3.02 % 56,145 19.63 4 -0.6545 % 2,641.8
OpRet 4.60 % 2.47 % 65,358 1.32 4 -0.1137 % 2,590.7
SplitShare 5.35 % 4.59 % 55,836 4.44 3 -0.1819 % 2,866.0
Interest-Bearing 0.00 % 0.00 % 0 0.00 0 -0.1137 % 2,369.0
Perpetual-Premium 5.25 % 2.63 % 74,570 0.28 30 0.0200 % 2,319.2
Perpetual-Discount 4.87 % 4.92 % 99,670 15.57 3 0.1780 % 2,612.4
FixedReset 4.98 % 2.96 % 204,250 3.90 75 -0.0180 % 2,449.2
Deemed-Retractible 4.90 % 3.43 % 122,744 1.00 46 -0.0532 % 2,398.2
Performance Highlights
Issue Index Change Notes
TRI.PR.B Floater -1.34 % YTW SCENARIO
Maturity Type : Limit Maturity
Maturity Date : 2042-11-15
Maturity Price : 21.86
Evaluated at bid price : 22.10
Bid-YTW : 2.36 %
MFC.PR.F FixedReset 1.77 % YTW SCENARIO
Maturity Type : Hard Maturity
Maturity Date : 2022-01-31
Maturity Price : 25.00
Evaluated at bid price : 24.66
Bid-YTW : 3.58 %
Volume Highlights
Issue Index Shares
Traded
Notes
BMO.PR.N FixedReset 276,236 Nesbitt crossed blocks of 222,700 and 50,000 shares, both at 26.30.
YTW SCENARIO
Maturity Type : Call
Maturity Date : 2014-02-25
Maturity Price : 25.00
Evaluated at bid price : 26.34
Bid-YTW : 2.11 %
FTS.PR.J Perpetual-Premium 117,929 Recent new issue.
YTW SCENARIO
Maturity Type : Call
Maturity Date : 2021-12-01
Maturity Price : 25.00
Evaluated at bid price : 25.16
Bid-YTW : 4.69 %
TD.PR.P Deemed-Retractible 54,300 National crossed 50,000 at 26.35.
YTW SCENARIO
Maturity Type : Call
Maturity Date : 2012-12-15
Maturity Price : 26.00
Evaluated at bid price : 26.35
Bid-YTW : -8.54 %
RY.PR.W Perpetual-Premium 52,125 National crossed 49,900 at 25.60.
YTW SCENARIO
Maturity Type : Call
Maturity Date : 2013-02-24
Maturity Price : 25.25
Evaluated at bid price : 25.54
Bid-YTW : 0.26 %
BNS.PR.P FixedReset 31,000 Desjardins crossed 10,000 at 25.10; Nesbitt crossed 10,000 at 25.11.
YTW SCENARIO
Maturity Type : Hard Maturity
Maturity Date : 2022-01-31
Maturity Price : 25.00
Evaluated at bid price : 25.09
Bid-YTW : 3.40 %
ENB.PR.F FixedReset 30,548 YTW SCENARIO
Maturity Type : Limit Maturity
Maturity Date : 2042-11-15
Maturity Price : 23.26
Evaluated at bid price : 25.40
Bid-YTW : 3.63 %
There were 20 other index-included issues trading in excess of 10,000 shares.
Wide Spread Highlights
Issue Index Quote Data and Yield Notes
TRI.PR.B Floater Quote: 22.10 – 22.44
Spot Rate : 0.3400
Average : 0.2121

YTW SCENARIO
Maturity Type : Limit Maturity
Maturity Date : 2042-11-15
Maturity Price : 21.86
Evaluated at bid price : 22.10
Bid-YTW : 2.36 %

TCA.PR.Y Perpetual-Premium Quote: 52.00 – 52.37
Spot Rate : 0.3700
Average : 0.2622

YTW SCENARIO
Maturity Type : Call
Maturity Date : 2014-03-05
Maturity Price : 50.00
Evaluated at bid price : 52.00
Bid-YTW : 2.63 %

SLF.PR.B Deemed-Retractible Quote: 24.90 – 25.15
Spot Rate : 0.2500
Average : 0.1534

YTW SCENARIO
Maturity Type : Hard Maturity
Maturity Date : 2022-01-31
Maturity Price : 25.00
Evaluated at bid price : 24.90
Bid-YTW : 4.97 %

ELF.PR.H Perpetual-Premium Quote: 25.90 – 26.15
Spot Rate : 0.2500
Average : 0.1604

YTW SCENARIO
Maturity Type : Call
Maturity Date : 2021-04-17
Maturity Price : 25.00
Evaluated at bid price : 25.90
Bid-YTW : 5.07 %

SLF.PR.F FixedReset Quote: 26.45 – 26.75
Spot Rate : 0.3000
Average : 0.2213

YTW SCENARIO
Maturity Type : Call
Maturity Date : 2014-06-30
Maturity Price : 25.00
Evaluated at bid price : 26.45
Bid-YTW : 2.83 %

MFC.PR.I FixedReset Quote: 25.83 – 25.99
Spot Rate : 0.1600
Average : 0.0983

YTW SCENARIO
Maturity Type : Call
Maturity Date : 2017-09-19
Maturity Price : 25.00
Evaluated at bid price : 25.83
Bid-YTW : 3.82 %

CIU Issues 40-Year Debs At 3.857%

Friday, November 16th, 2012

CU Inc. has announced:

that it will issue $200,000,000 of 3.857% Debentures maturing on November 14, 2052, at a price of $100.00 to yield 3.857%. This issue was sold by RBC Dominion Securities Inc., BMO Nesbitt Burns Inc., TD Securities Inc. and Scotia Capital Inc. Proceeds from the issue will be used to finance capital expenditures, to repay existing indebtedness, and for other general corporate purposes of ATCO Electric Ltd. and ATCO Gas and Pipelines Ltd.

The bonds are rated “A” by S&P.

This is interesting because CIU.PR.A closed at 25.16-20 today to yield 4.57-56% to its limit maturity (although this issue is a PerpetualPremium, it doesn’t quite trigger a YTW scenario of a call in the HIMIPref™ analysis. The bid-YTW of 4.57% is equivalent to 5.94% interest at the standard conversion factor of 1.3x, so the pre-tax interest equivalent spread (in this context, the “Seniority Spread”) of the Straight Perpetual over the debenture is about 210bp – very close to the 220bp for long corporates vs. PerpetualDiscounts reported November 14.

So it would appear that despite all the problems with the lack of PerpetualDiscount issues and their poor quality (relative to what the index was before all the banks and insurers transformed into DeemedRetractibles), the Seniority Spread as calculted is still meaningful – at least as far as a single test is concerned!

November 14, 2012

Thursday, November 15th, 2012

There’s an interesting straw in the wind for junk bonds:

Investors yanked a record volume of cash from BlackRock Inc.’s exchange-traded fund that buys junk bonds as the notes lose value for the first month since May.

The $16.3 billion fund reported an outflow of 2.4 million shares yesterday, equal to about $218.9 million, according to data compiled by Bloomberg. That’s the biggest daily withdrawal in the five-year history of the iShares iBoxx High Yield Corporate Bond Fund, the largest of its kind.

The five largest junk-bond ETFs, which allow investors to speculate on the securities without actually owning them, have lost $1.97 billion of assets since Sept. 20 as investors wager that a four-year rally in the debt is running out of steam. High-yield bonds in the U.S. are losing 0.14 percent this month after posting 12.9 percent returns this year through October, according to Bank of America Merrill Lynch index data.

Regulation is wonderful:

Since 1998, ABS [the non-profit American Bureau of Shipping] has hired four former Coast Guard admirals as executives. They include retired Admiral Robert Kramek, who led the Coast Guard as commandant from 1994 to 1998. It was Kramek who signed an agreement with ABS in 1995 that expanded the nonprofit’s powers to inspect independently owned ships on the Coast Guard’s behalf.

In June 1998, three years after Kramek signed that inspection agreement, ABS hired him as president of its Americas division.

Jack Devanney, a retired executive of companies that own ships that used ABS services, says this revolving door is bad for ship safety.

“When you give Kramek a nice job, you’re sending a message to all the Coast Guard guys that they’ve got a second career at ABS,” says Devanney, who has a Ph.D. in management science from the Massachusetts Institute of Technology. “If you rock the boat, that opportunity’s not going to be available to you.”

S&P has released a fascinating report titled A Tale Of Two Countries: U.S. And Canadian Banks’ Contrasting Profitability Dynamics:

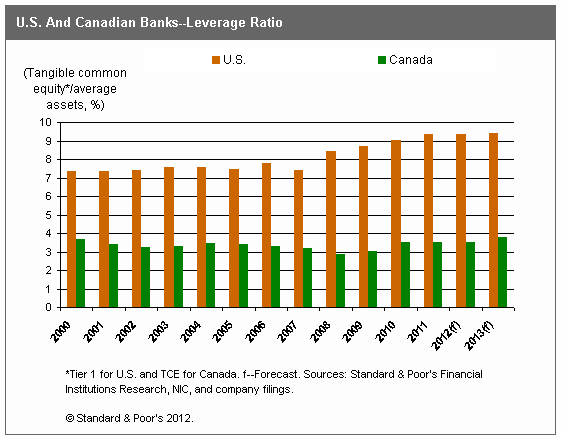
Profit dynamics for a company or an industry are highly sensitive to shifting operating and regulatory conditions and, as a result, are likely to change over time. Profits are important because they can be a significant generator of capital–for the companies that retain them in a meaningful amount. A careful review of bank profitability in both the U.S. and Canada indicates that Canadian banks have been more profitable than their U.S. counterparts in recent years. This gap has widened in the postcrisis years. This is partly because of Canadian banks’ higher leverage that largely arises from structural differences. We also note that the leverage ratio gap between the U.S. and Canada is sensitive to definition. Alternative definitions of leverage ratio for U.S. banks, for example using Standard & Poor’s adjusted common equity to adjusted assets, also show that U.S. banks have lower leverage than Canadian banks, but the gap is much smaller.

As for Canada, the Office of the Superintendent of Financial Institutions (OSFI) will issue a new Basel III capital guideline before the end of 2012–for implementation in the first fiscal quarter of 2013. Of the 29 G-SIBs that the Financial Stability Board (FSB) identified in November 2011, none were Canadian banks. However, there are plans to identify domestic systemically important banks (D-SIBs) and recommend that a capital surcharge be applied to them. But Canadian banking regulators have not offered any detailed views on this yet. Therefore, we anticipate Canadian banks, on average, will continue to have higher leverage than U.S. banks, particularly the largest and most complex. We believe that at least part of the tolerance for higher leverage may be due to the accumulation of relatively low-risk weighted assets, like government-insured mortgages


Click for Big

It was another mixed day for the Canadian preferred share market, with PerpetualPremiums up 3bp, FixedResets gaining 2bp and DeemedRetractibles off 1bp. Volatility was non-existent. Volume was low.

PerpetualDiscounts now yield 4.91%, equivalent to 6.38% interest at the standard equivalency factor of 1.3x. Long corporates now yield about 4.2%, so the pre-tax interest-equivalent spread (in this context, the “Seniority Spread”) is now about 220bp, a slight (and perhaps spurious) increase from the 215bp reported November 7.

HIMIPref™ Preferred Indices
These values reflect the December 2008 revision of the HIMIPref™ Indices

Values are provisional and are finalized monthly
Index Mean
Current
Yield
(at bid)
Median
YTW
Median
Average
Trading
Value
Median
Mod Dur
(YTW)
Issues Day’s Perf. Index Value
Ratchet 0.00 % 0.00 % 0 0.00 0 0.0936 % 2,462.8
FixedFloater 4.16 % 3.50 % 31,196 18.32 1 0.0000 % 3,870.3
Floater 2.80 % 3.02 % 54,737 19.64 4 0.0936 % 2,659.2
OpRet 4.59 % 2.47 % 67,811 1.32 4 0.2616 % 2,593.7
SplitShare 5.34 % 4.45 % 53,945 4.44 3 0.1301 % 2,871.2
Interest-Bearing 0.00 % 0.00 % 0 0.00 0 0.2616 % 2,371.7
Perpetual-Premium 5.26 % 2.32 % 74,375 0.28 30 0.0267 % 2,318.8
Perpetual-Discount 4.88 % 4.91 % 98,988 15.56 3 0.2334 % 2,607.8
FixedReset 4.98 % 2.97 % 207,506 3.91 75 0.0182 % 2,449.6
Deemed-Retractible 4.90 % 3.35 % 124,136 0.93 46 -0.0076 % 2,399.5
Performance Highlights
Issue Index Change Notes
No individual gains or losses exceeding 1%!
Volume Highlights
Issue Index Shares
Traded
Notes
FTS.PR.J Perpetual-Premium 155,905 Recent new issue.
YTW SCENARIO
Maturity Type : Call
Maturity Date : 2021-12-01
Maturity Price : 25.00
Evaluated at bid price : 25.20
Bid-YTW : 4.67 %
NA.PR.Q FixedReset 46,538 Recent new issue.
YTW SCENARIO
Maturity Type : Call
Maturity Date : 2017-11-15
Maturity Price : 25.00
Evaluated at bid price : 25.50
Bid-YTW : 3.40 %
SLF.PR.H FixedReset 38,241 Scotia crossed 29,600 at 25.05.
YTW SCENARIO
Maturity Type : Hard Maturity
Maturity Date : 2022-01-31
Maturity Price : 25.00
Evaluated at bid price : 25.00
Bid-YTW : 3.72 %
RY.PR.N FixedReset 32,088 RBC sold 10,000 to anonymous at 26.30 and 19,500 to Desjardins at the same price.
YTW SCENARIO
Maturity Type : Call
Maturity Date : 2014-02-24
Maturity Price : 25.00
Evaluated at bid price : 26.22
Bid-YTW : 2.24 %
GWO.PR.R Deemed-Retractible 31,250 YTW SCENARIO
Maturity Type : Hard Maturity
Maturity Date : 2022-01-31
Maturity Price : 25.00
Evaluated at bid price : 25.15
Bid-YTW : 4.81 %
POW.PR.C Perpetual-Premium 29,550 TD crossed blocks of 13,000 and 16,000, both at 25.60
YTW SCENARIO
Maturity Type : Call
Maturity Date : 2012-12-14
Maturity Price : 25.00
Evaluated at bid price : 25.57
Bid-YTW : -15.29 %
There were 21 other index-included issues trading in excess of 10,000 shares.
Wide Spread Highlights
Issue Index Quote Data and Yield Notes
BAM.PR.B Floater Quote: 17.50 – 17.95
Spot Rate : 0.4500
Average : 0.2834

YTW SCENARIO
Maturity Type : Limit Maturity
Maturity Date : 2042-11-14
Maturity Price : 17.50
Evaluated at bid price : 17.50
Bid-YTW : 3.02 %

BNA.PR.E SplitShare Quote: 25.71 – 26.18
Spot Rate : 0.4700
Average : 0.3404

YTW SCENARIO
Maturity Type : Hard Maturity
Maturity Date : 2017-12-10
Maturity Price : 25.00
Evaluated at bid price : 25.71
Bid-YTW : 4.45 %

MFC.PR.F FixedReset Quote: 24.23 – 24.51
Spot Rate : 0.2800
Average : 0.1714

YTW SCENARIO
Maturity Type : Hard Maturity
Maturity Date : 2022-01-31
Maturity Price : 25.00
Evaluated at bid price : 24.23
Bid-YTW : 3.81 %

ENB.PR.A Perpetual-Premium Quote: 25.62 – 25.97
Spot Rate : 0.3500
Average : 0.2633

YTW SCENARIO
Maturity Type : Call
Maturity Date : 2012-12-14
Maturity Price : 25.00
Evaluated at bid price : 25.62
Bid-YTW : -25.64 %

GWO.PR.L Deemed-Retractible Quote: 26.66 – 26.86
Spot Rate : 0.2000
Average : 0.1288

YTW SCENARIO
Maturity Type : Call
Maturity Date : 2014-12-31
Maturity Price : 26.00
Evaluated at bid price : 26.66
Bid-YTW : 4.54 %

GWO.PR.N FixedReset Quote: 24.16 – 24.40
Spot Rate : 0.2400
Average : 0.1728

YTW SCENARIO
Maturity Type : Hard Maturity
Maturity Date : 2022-01-31
Maturity Price : 25.00
Evaluated at bid price : 24.16
Bid-YTW : 3.48 %

BBD Downgraded by S&P; Preferreds Unaffected

Thursday, November 15th, 2012

Standard & Poor’s has announced:

  • •We are lowering our long-term corporate rating on Bombardier Inc. to ‘BB’ from ‘BB+’.
  • •The downgrade reflects what we view as the company’s significantly lower-than-expected cash generation in 2012 due to fewer customer advances and weaker operating profit given the global economy. This, combined with ongoing heavy capex on the C-Series programs (which are facing a six-month delay), will mean that Bombardier’s leverage ratio will remain high, over 6x, until 2014.
  • •We are also assigning our ‘BB’ issue rating, and ‘4’ recovery rating, to Bombardier’s proposed US$1 billion of unsecured notes.
  • •The stable outlook reflects our expectations of stable performance from the company’s rail segment and overall slight improvement in operating margins.


A further downgrade is possible, if lower customer advances and additional delays in the CSeries programs lead to greater-than-expected negative free cash generation. This could ultimately lead to delays in any improvement to the adjusted leverage ratio from our current expectations in the next year-and-a-half.

Under the current business conditions, we believe an upgrade is unlikely in the near term. Nevertheless, when what we view as more normal and stable market conditions return and the company successfully launches the CSeries, we could consider revising the outlook to positive or raising the rating on Bombardier if in turn the company improves its financial measures, with adjusted debt to EBITDA falling below 4x or adjusted funds from operations to debt reaching 20%.

BBD has three series of preferred outstanding: BBD.PR.B, BBD.PR.C and BBD.PR.D.

BCE.PR.Z To Reset To 3.152%

Wednesday, November 14th, 2012

BCE Inc. has announced:

BCE Inc. will, on December 1, 2012, continue to have Cumulative Redeemable First Preferred Shares, Series Z (“Series Z Preferred Shares”) outstanding if, following the end of the conversion period on November 19, 2012, BCE Inc. determines that at least one million Series Z Preferred Shares would remain outstanding. In such a case, as of December 1, 2012, the Series Z Preferred Shares will pay, on a quarterly basis, as and when declared by the Board of Directors of BCE Inc., a fixed cash dividend for the following five years that will be based on a fixed rate equal to the product of: (a) the average of the yields to maturity compounded semi-annually, determined on November 13, 2012 by two investment dealers selected by BCE Inc., that would be carried by non-callable Government of Canada bonds with a 5-year maturity (the “Government of Canada Yield”), multiplied by (b) a percentage rate determined by BCE Inc. (the “Selected Percentage Rate”) for such period.

The “Selected Percentage Rate” determined by BCE Inc. for such period is 243%. The “Government of Canada Yield” is 1.297%. Accordingly, the annual dividend rate applicable to the Series Z Preferred Shares for the period of five years beginning on December 1, 2012 will be 3.152%.

The company has previously published

Similarly to to my recommendation in the BCE.PR.A / BCE.PR.B interconversion, I recommend that holders of BCE.PR.Z convert to BCE.PR.Y. The total dividends paid over the next five years will greater for the latter issue if the average prime rate exceeds 3.152% (provided that this issue continues to pay 100% of prime, which it will do unless the current price of a little under $22 increases to over $25). This condition will be met if prime increases steadily to 3.5% at the end of five years, and doesn’t miss by much if there’s only a single hike to 3.25%. This is a reasonably good bet, even with the Fed announcing continued financial repression through mid-2015. Additionally, I judge the chance of an overshoot of this figure to be much greater than the chance of an extreme undershoot; in other words, I judge the chances of average prime being 5% to be much greater than the chance of average prime being 2%.

November 13, 2012

Wednesday, November 14th, 2012

Today’s inspiring photograph has been taken from the website of a company owned by a distant relative.


Click for big

It was another mixed day for the Canadian preferred share market, with PerpetualPremiums gaining 1bp, FixedResets off 5bp and DeemedRetractibles gaining 3bp. Volatility was low. Volume was relatively heavy, with quite a few issues breaking the 100,000 barrier as the RBC desk did land-office business.

HIMIPref™ Preferred Indices
These values reflect the December 2008 revision of the HIMIPref™ Indices

Values are provisional and are finalized monthly
Index Mean
Current
Yield
(at bid)
Median
YTW
Median
Average
Trading
Value
Median
Mod Dur
(YTW)
Issues Day’s Perf. Index Value
Ratchet 0.00 % 0.00 % 0 0.00 0 -0.2001 % 2,460.5
FixedFloater 4.16 % 3.49 % 31,395 18.32 1 1.1062 % 3,870.3
Floater 2.81 % 3.02 % 54,910 19.64 4 -0.2001 % 2,656.7
OpRet 4.59 % 0.25 % 38,298 0.62 4 0.0284 % 2,586.9
SplitShare 5.35 % 4.54 % 56,140 4.44 3 0.3263 % 2,867.5
Interest-Bearing 0.00 % 0.00 % 0 0.00 0 0.0284 % 2,365.5
Perpetual-Premium 5.25 % 2.16 % 74,587 0.28 30 0.0105 % 2,318.1
Perpetual-Discount 4.89 % 4.93 % 98,741 15.54 3 -0.0137 % 2,601.7
FixedReset 4.98 % 2.90 % 211,542 3.91 75 -0.0460 % 2,449.2
Deemed-Retractible 4.90 % 3.44 % 122,866 0.94 46 0.0338 % 2,399.7
Performance Highlights
Issue Index Change Notes
IFC.PR.C FixedReset -1.07 % YTW SCENARIO
Maturity Type : Call
Maturity Date : 2016-09-30
Maturity Price : 25.00
Evaluated at bid price : 25.92
Bid-YTW : 3.34 %
IAG.PR.F Deemed-Retractible 1.10 % YTW SCENARIO
Maturity Type : Call
Maturity Date : 2015-03-31
Maturity Price : 26.00
Evaluated at bid price : 26.60
Bid-YTW : 4.99 %
BAM.PR.G FixedFloater 1.11 % YTW SCENARIO
Maturity Type : Limit Maturity
Maturity Date : 2042-11-13
Maturity Price : 23.16
Evaluated at bid price : 22.85
Bid-YTW : 3.49 %
Volume Highlights
Issue Index Shares
Traded
Notes
FTS.PR.J Perpetual-Premium 1,173,968 New issue settled today.
YTW SCENARIO
Maturity Type : Call
Maturity Date : 2021-12-01
Maturity Price : 25.00
Evaluated at bid price : 25.16
Bid-YTW : 4.69 %
TD.PR.I FixedReset 233,860 RBC crossed 226,800 at 26.65.
YTW SCENARIO
Maturity Type : Call
Maturity Date : 2014-07-31
Maturity Price : 25.00
Evaluated at bid price : 26.72
Bid-YTW : 2.29 %
NA.PR.Q FixedReset 213,195 Recent new issue.
YTW SCENARIO
Maturity Type : Call
Maturity Date : 2017-11-15
Maturity Price : 25.00
Evaluated at bid price : 25.45
Bid-YTW : 3.44 %
RY.PR.Y FixedReset 204,530 RBC sold 19,500 to TD at 26.93, then crossed 176,700 at 26.85.
YTW SCENARIO
Maturity Type : Call
Maturity Date : 2014-11-24
Maturity Price : 25.00
Evaluated at bid price : 26.90
Bid-YTW : 2.18 %
TD.PR.K FixedReset 148,500 RBC corssed 146,100 at 26.65.
YTW SCENARIO
Maturity Type : Call
Maturity Date : 2014-07-31
Maturity Price : 25.00
Evaluated at bid price : 26.75
Bid-YTW : 2.22 %
BNS.PR.T FixedReset 142,239 RBC crossed 125,000 at 26.60.
YTW SCENARIO
Maturity Type : Call
Maturity Date : 2014-04-25
Maturity Price : 25.00
Evaluated at bid price : 26.65
Bid-YTW : 1.76 %
TD.PR.E FixedReset 120,920 RBC crossed 118,600 at 26.50.
YTW SCENARIO
Maturity Type : Call
Maturity Date : 2014-04-30
Maturity Price : 25.00
Evaluated at bid price : 26.51
Bid-YTW : 2.18 %
SLF.PR.I FixedReset 107,342 Nesbitt crossed 100,000 at 26.00.
YTW SCENARIO
Maturity Type : Call
Maturity Date : 2016-12-31
Maturity Price : 25.00
Evaluated at bid price : 26.00
Bid-YTW : 3.36 %
RY.PR.P FixedReset 105,044 RBC crossed 100,000 at 26.30.
YTW SCENARIO
Maturity Type : Call
Maturity Date : 2014-02-24
Maturity Price : 25.00
Evaluated at bid price : 26.25
Bid-YTW : 2.14 %
RY.PR.T FixedReset 104,853 RBC crossed 100,000 at 26.30.
YTW SCENARIO
Maturity Type : Call
Maturity Date : 2014-08-24
Maturity Price : 25.00
Evaluated at bid price : 26.74
Bid-YTW : 2.16 %
RY.PR.X FixedReset 104,600 RBC crossed 98,800 at 26.85.
YTW SCENARIO
Maturity Type : Call
Maturity Date : 2014-08-24
Maturity Price : 25.00
Evaluated at bid price : 26.76
Bid-YTW : 2.12 %
There were 35 other index-included issues trading in excess of 10,000 shares.
Wide Spread Highlights
Issue Index Quote Data and Yield Notes
HSB.PR.C Deemed-Retractible Quote: 25.83 – 26.50
Spot Rate : 0.6700
Average : 0.5796

YTW SCENARIO
Maturity Type : Call
Maturity Date : 2012-12-13
Maturity Price : 25.50
Evaluated at bid price : 25.83
Bid-YTW : -3.36 %

PWF.PR.R Perpetual-Premium Quote: 26.71 – 27.00
Spot Rate : 0.2900
Average : 0.2064

YTW SCENARIO
Maturity Type : Call
Maturity Date : 2021-04-30
Maturity Price : 25.00
Evaluated at bid price : 26.71
Bid-YTW : 4.57 %

BAM.PR.K Floater Quote: 17.45 – 17.68
Spot Rate : 0.2300
Average : 0.1483

YTW SCENARIO
Maturity Type : Limit Maturity
Maturity Date : 2042-11-13
Maturity Price : 17.45
Evaluated at bid price : 17.45
Bid-YTW : 3.03 %

PWF.PR.O Perpetual-Premium Quote: 26.75 – 27.04
Spot Rate : 0.2900
Average : 0.2153

YTW SCENARIO
Maturity Type : Call
Maturity Date : 2014-10-31
Maturity Price : 26.00
Evaluated at bid price : 26.75
Bid-YTW : 4.17 %

HSB.PR.D Deemed-Retractible Quote: 25.60 – 25.88
Spot Rate : 0.2800
Average : 0.2065

YTW SCENARIO
Maturity Type : Call
Maturity Date : 2013-12-31
Maturity Price : 25.25
Evaluated at bid price : 25.60
Bid-YTW : 4.26 %

BAM.PR.X FixedReset Quote: 25.10 – 25.27
Spot Rate : 0.1700
Average : 0.1061

YTW SCENARIO
Maturity Type : Limit Maturity
Maturity Date : 2042-11-13
Maturity Price : 23.22
Evaluated at bid price : 25.10
Bid-YTW : 3.28 %