Brookfield Renewable Partners L.P. has announced:
that Brookfield Renewable Power Preferred Equity Inc. (“BRP Equity”) has determined the fixed dividend rate on its Class A Preference Shares, Series 1 (“Series 1 Shares”) (TSX:BRF.PR.A) for the five years commencing May 1, 2025 and ending April 30, 2030 and the floating dividend rate on its Class A Preference Shares, Series 2 (“Series 2 Shares”) (TSX: BRF.PR.B) for the quarterly dividend payable on July 31, 2025.
Series 1 Shares
If declared, the fixed quarterly dividends on the Series 1 Shares during that period will be paid at an annual rate of 5.203% ($0.3251875 per share per quarter).
Holders of Series 1 Shares have the right, at their option, exercisable not later than 5:00 p.m. (Toronto time) on April 15, 2025, to convert all or part of their Series 1 Shares, on a one-for-one basis, into Series 2 Shares, effective April 30, 2025. Holders of Series 1 Shares are not required to elect to convert all or any part of their Series 1 Shares into Series 2 Shares.
As provided in the share conditions of the Series 1 Shares, (i) if BRP Equity determines that there would be fewer than 1,000,000 Series 1 Shares outstanding after April 30, 2025, all remaining Series 1 Shares will be automatically converted into Series 2 Shares on a one-for-one basis effective April 30, 2025; and (ii) if BRP Equity determines that there would be fewer than 1,000,000 Series 2 Shares outstanding after April 30, 2025, no Series 1 Shares will be permitted to be converted into Series 2 Shares. There are currently 6,849,533 Series 1 Shares outstanding.
Series 2 Shares
The quarterly floating rate dividends on the Series 2 Shares is paid at an annual rate, calculated for each quarter, of 2.62% over the annual yield on three-month Government of Canada treasury bills. The actual quarterly dividend in respect of the May 1, 2025 to July 31, 2025 dividend period for the Series 2 Shares, if declared, will be $0.3317675 per share, payable on July 31, 2025.
Holders of Series 2 Shares have the right, at their option, exercisable not later than 5:00 p.m. (Toronto time) on April 15, 2025, to convert all or part of their Series 2 Shares, on a one-for-one basis, into Series 1 Shares, effective April 30, 2025. Holders of Series 2 Shares are not required to elect to convert all or any part of their Series 2 Shares into Series 1 Shares.
As provided in the share conditions of the Series 2 Shares, (i) if BRP Equity determines that there would be fewer than 1,000,000 Series 2 Shares outstanding after April 30, 2025, all remaining Series 2 Shares will be automatically converted into Series 1 Shares on a one-for-one basis effective April 30, 2025; and (ii) if BRP Equity determines that there would be fewer than 1,000,000 Series 1 Shares outstanding after April 30, 2025, no Series 2 Shares will be permitted to be converted into Series 1 Shares. There are currently 3,110,531 Series 2 Shares outstanding.
There has been no press release regarding the conversion results that I can see, but the TMX Money site reports 8,372,310 BRF.PR.A shares outstanding and 64,977 of BRF.PR.B. Extensive computations have determined that 64,977 is less than the 1,000,000 minimum outstanding requirement, so I’m not quite sure what’s going on. I have sent an eMail:
In your press release dated 2025-04-01 (see https://bep.brookfield.com/press-releases/bep/brookfield-renewable-announces-dividend-rates-its-series-1-and-series-2 ), you stated: “As provided in the share conditions of the Series 2 Shares, (i) if BRP Equity determines that there would be fewer than 1,000,000 Series 2 Shares outstanding after April 30, 2025, all remaining Series 2 Shares will be automatically converted into Series 1 Shares on a one-for-one basis effective April 30, 2025; and (ii) if BRP Equity determines that there would be fewer than 1,000,000 Series 1 Shares outstanding after April 30, 2025, no Series 2 Shares will be permitted to be converted into Series 1 Shares. There are currently 3,110,531 Series 2 Shares outstanding.”
I see no further press release disclosing the results of the conversion right.
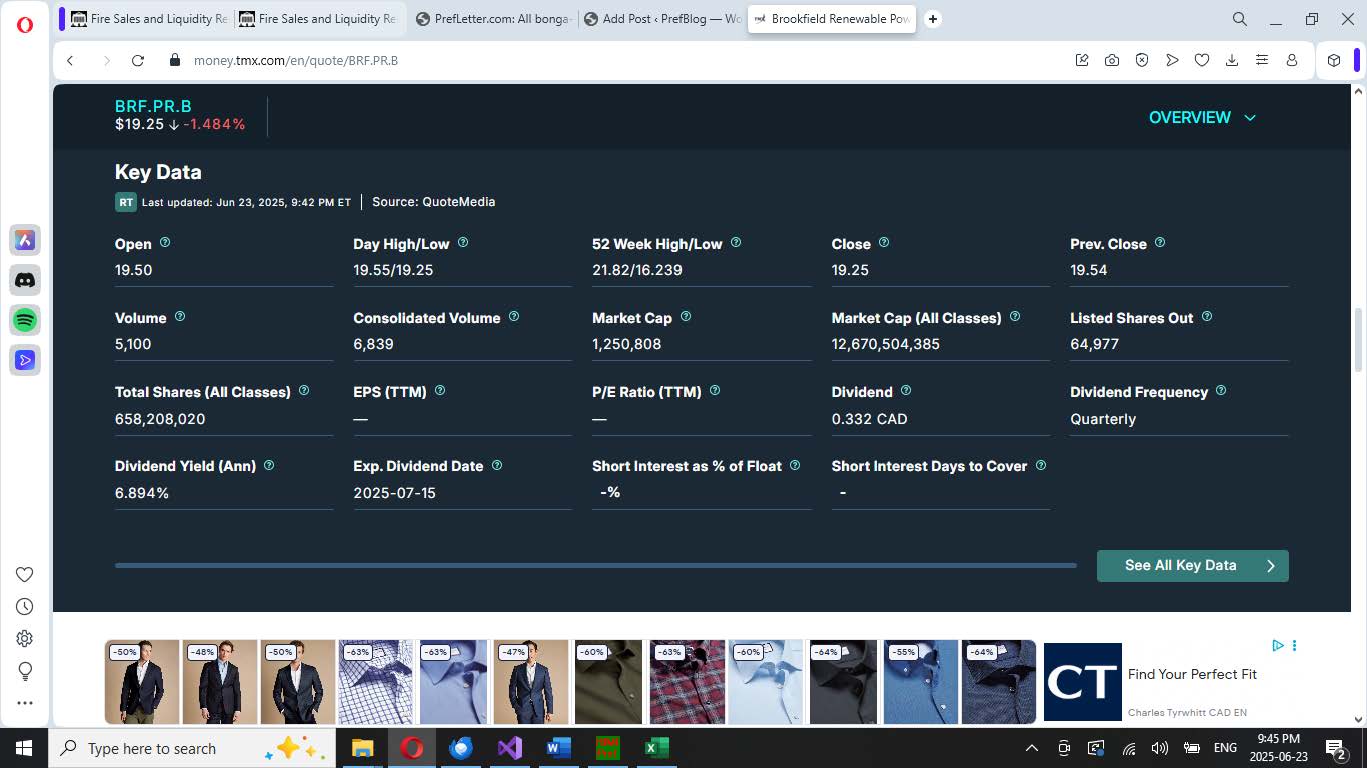
The Toronto Stock Exchange is reporting on tmxmoney.com that there are currently only 64,977 BRF.PR.B outstanding (see attached screenshot); should this be the case, there is an apparent inconsistency with the press release (unless there was a massive repurchase and cancellation in the interim).
Can you please clarify the results of the conversion and currently outstanding shares for me please?
Sincerely,
Screenshot:
BRF.PR.A was issued as a FixedReset, 5.25%+262, that commenced trading 2010-3-10 after being announced 2010-2-18. It reset to 3.355% in 2015 and I recommended against conversion. Nevertheless, there was a 45% conversion to the FloatingReset. The issue reset to 3.137% in 2020.
BRF.PR.B is a FloatingReset, Float+262, that resulted from a 45% conversion from BRF.PR.A in 2015.
Update, 2025-6-27: I have received the following response from BRF regarding the number of outstanding shares of BRF.PR.B:
Please see the results on our website in the Footnote 2 below. https://bep.brookfield.com/bep/stock-distributions/preferred-shares
2. On April 15, 2025, a total of 1,619 Class A Preference Shares Series 1 (“Series 1 Preferred Shares”) outstanding were elected for conversion, on a one-for-one basis, into floating rate Class A Preference Shares Series 2 (“Series 2 Preferred Shares”) and a total of 1,524,396 Series 2 Preferred Shares outstanding were elected for conversion, on a one-for-one basis, into Series 1 Preferred Shares. Consequently, effective April 30, 2025, Brookfield Renewable have 8,372,310 Series 1 Preferred Shares and 1,587,754 Series 2 Preferred Shares issued and outstanding.
So that’s a net 15% conversion to BRF.PR.A, the FixedReset. The TMX continues to report 64,977 BRF.PR.B shares outstanding.