There’s some interesting news about drones:
Amazon.com Inc.’s proposed use of drones could drive down the cost to deliver small packages crosstown to about $1 — a fraction of existing same-day delivery options, according to a study by a financial research company.
The report from New York-based ARK Invest also suggests deliveries may arrive in as soon as 30 minutes. The research tried to quantify the savings from the use of drones compared with delivery trucks and couriers.
Amazon has pushed the U.S. government for permission to test unmanned aircraft as it seeks to develop drones to speed shipping products. The Federal Aviation Administration gave the Seattle-based online retailer a waiver allowing flights as fast as 100 miles (161 kilometers) an hour and as high as 400 feet off the ground, according to a letter from the agency dated Wednesday.
…
Amazon would need to hire thousands of operators, each capable of monitoring multiple drones simultaneously, to ensure safe takeoffs and landings, according to the study, which included the personnel cost in its calculations. Most of the drone flight would be automated, according to the study, which assumes each package weighs as much as 5 pounds and each delivery is no more than 10 miles.
This is of interest on many levels: primarily, of course, I’m interested in getting the things that I ordered quickly – when I buy the latest installment of Teenage Vampire Stewardesses Go To Nursing School, I want it right away! Additionally, there is the potential for skeet shooting with prizes! And finally, what happens when more than one company does it? Will we need to have drone Air Traffic Controllers? Or, given that the potential for death and injury is less with package-delivering drones, will it be enough to have some kind of automated system? Will an automated system work with visual sensors, echo-location or self-responding with GPS and transponders? Stay tuned!
It will not have escaped notice that immediately following the publication of the story in which I discussed upcoming dividend cuts on reset, the preferred share market tanked, particularly FixedResets. The enormous amount of influence I have over the market has also impressed a lot of my groupies, who send me gushing eMails:
Your comments on preferred share recently were totally out of line. Irresponsible comments about the yields on all rate reset preffered. shares. You should be sued on those comments. I am too poor to sue you but I wish I could.
Politics is getting really complicated. First there was the Wildrose Party in Alberta and now I understand there’s a new political movement in Saskatchewan:
 Click for Big
Saskatchewan is clamping down on the sale of the province’s farmland to major Canadian pension funds and institutional investors, restricting deep-pocketed groups at a time when land prices are climbing.
Agriculture Minister Lyle Stewart said Monday that Saskatchewan will undertake a review of provincial farmland ownership rules. In the meantime, pension plans, administrators of pension fund assets and trusts will not be allowed to purchase land, adding to the already stringent rules in place to prevent foreign investors from profiting from the industry.
…
The move to change ownership rules comes after Canada Pension Plan Investment Board paid $128-million for 115,000 acres of Saskatchewan farmland that produced wheat, barley, canola and other crops in 2013. The acquisition has become a hot-button issue as the province seeks to protect small farmers while encouraging growth in its agriculture industry.
Used to be that a buck was a buck; in fact, I understand that that’s why money was invented. But it seems very fashionable to declare that some dollars are better than other dollars; the system of licenses might even get some senior bureaucrats some very nice dinners and hockey tickets.
This story about abusive staffing practices rang a bell for me:
Gap Inc. and other retailers were told by New York’s attorney general that using on-call shifts may be illegal, bringing fresh criticism to a practice that forces workers to make themselves available on short notice.
Attorney General Eric Schneiderman sent letters to 13 retailers on April 10 seeking information about their reliance on the staffing approach. He warned the companies that making workers stay on call may be violating state employment law.
The attorney general said he received reports that a growing number of employees are working such shifts, which require them to check in as little as a few hours in advance to see if they’re needed. A range of clothing and department-store chains, including Sears Holdings Corp., Abercrombie & Fitch Co. and Target Corp., all received letters on the issue — the latest attempt by the high-profile prosecutor to rein in what he sees as unscrupulous retail practices.
My cutie is a nurse. As many of you know, the complete absence of anybody with any kind of brain in the health care system means that many, if not most, nurses can only find part-time jobs. One of her jobs is at a hospital, as a casual, which means she has to provide them with a minimum amount of availability every month, with a minimum amount of that to be weekends. If they need her, they’ll call her; I believe a health minister read a newspaper article about ‘Just In Time Inventory’ one day and decided that this would be his legacy. So anyway, it’s not bad enough that she’ll get called at 4:30am to leave the house at 5:00am to commute to a 6:00am shift start time; the worst part is, she’s neither paid for the availability, nor is she guaranteed a certain proportion of calls. So it’s entirely possible that she could block out 20 shifts availability over a month, not get a single call, and get a grand total of zero on her paycheque.
The system may have been inspired by a politician, but it was definitely designed by an MBA. And then the news is filled with interviews with the big shots, utterly baffled regarding why so many young nurses leave the profession. Why do so many go to the States? Hell, how much experience of life do you really need before you realize that if you treat your staff like shit, you get shit staff?
It was a poor day for the Canadian preferred share market, with PerpetualDiscounts losing 55bp, FixedResets down 32bp and DeemedRetractibles off 7bp. The lengthy Performance Highlights table is dominated by FixedReset losers, but there were quite a few winners on the day. Volume was very high.
For as long as the FixedReset market is so violently unsettled, I’ll keep publishing updates of the more interesting and meaningful series of FixedResets’ Implied Volatilities. This doesn’t include Enbridge because although Enbridge has a large number of issues outstanding, all of which are quite liquid, the range of Issue Reset Spreads is too small for decent conclusions. The low is 212bp (ENB.PR.H; second-lowest is ENB.PR.D at 237bp) and the high is a mere 268 for ENB.PF.G.
Remember that all rich /cheap assessments are:
» based on Implied Volatility Theory only
» are relative only to other FixedResets from the same issuer
» assume constant GOC-5 yield
» assume constant Implied Volatility
» assume constant spread
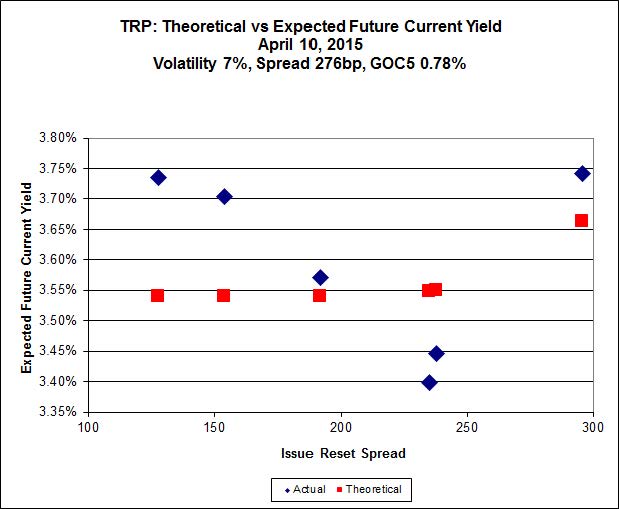
Here’s TRP:
 Click for Big
TRP.PR.E, which resets 2019-10-30 at +235, is bid at 23.60 to be $1.38 rich, while TRP.PR.C, resetting 2016-1-30 at +154, is $0.88 cheap at its bid price of 15.60.
 Click for Big
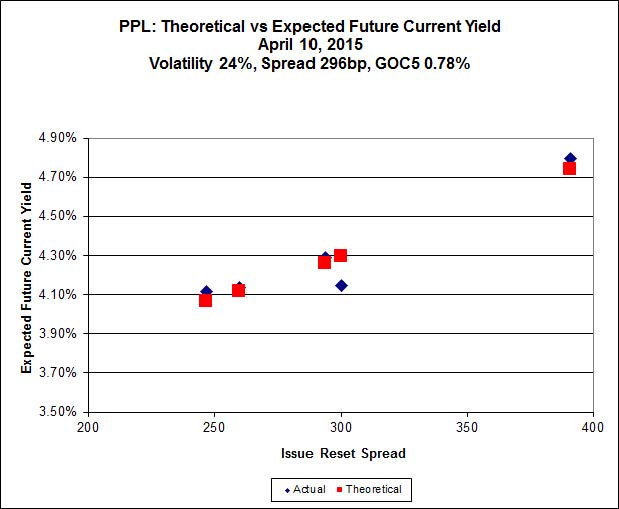
Another excellent fit, but the numbers are perplexing. Implied Volatility for MFC continues to be a conundrum, although it declined substantially today. It is still too high if we consider that NVCC rules will never apply to these issues; it is still too low if we consider them to be NVCC non-compliant issues (and therefore with Deemed Maturities in the call schedule).
Most expensive is MFC.PR.M, resetting at +236 on 2019-12-19, bid at 24.00 to be $0.60 rich, while MFC.PR.H, resetting at +313bp on 2017-3-19, is bid at 25.16 to be $0.90 cheap. The lowest spread issue, MFC.PR.F, is noticeably off the curve defined by its peers.
 Click for Big
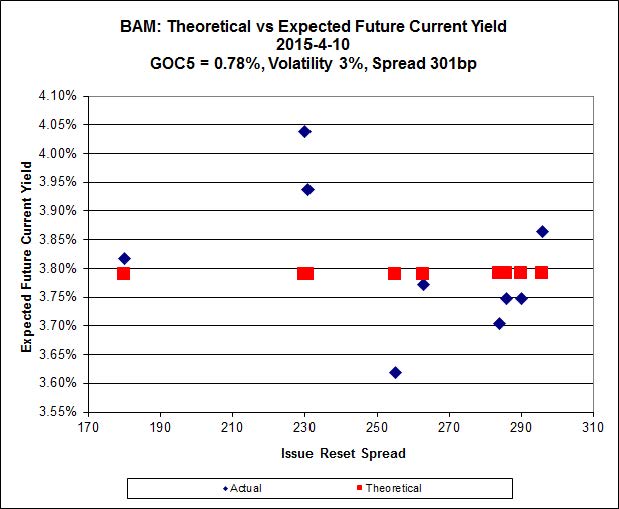
The cheapest issue relative to its peers is BAM.PR.R, resetting at +230bp on 2016-6-30, bid at 18.87 to be $1.31 cheap. BAM.PF.E, resetting at +255bp 2020-3-31 is bid at 23.10 and appears to be $1.27 rich.
 Click for Big
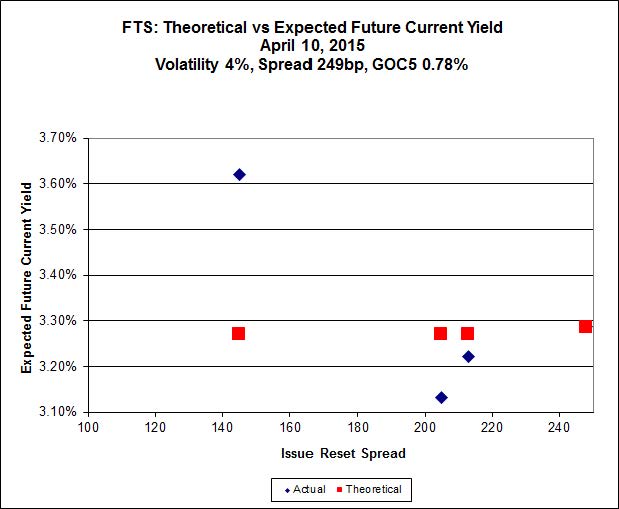
This is just weird because the middle is expensive and the ends are cheap but anyway … FTS.PR.H, with a spread of +145bp, and bid at 15.25, looks $1.34 cheap and resets 2015-6-1. FTS.PR.K, with a spread of +205bp and resetting 2019-3-1, is bid at 21.62 and is $0.52 rich.
 Click for Big
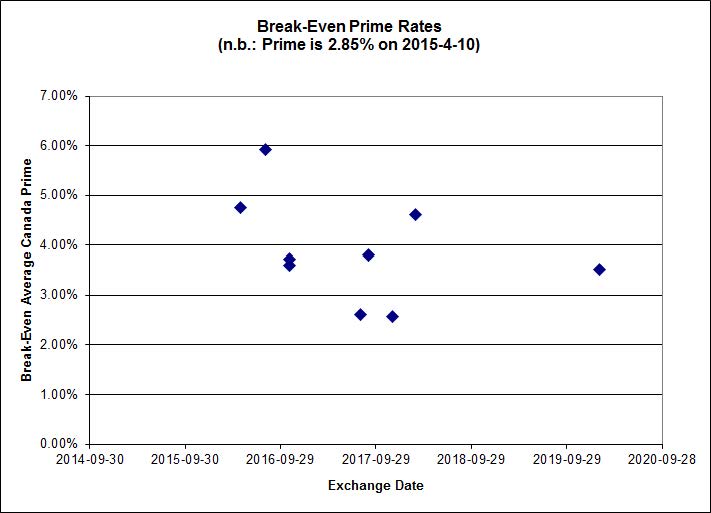
Investment-grade pairs other than TRP.PR.A / TRP.PR.F now predict an average over the next five years of about 0.30%. TRP.PR.A / TRP.PR.F remains an outlier, predicting 0.84%. The DC.PR.B / DC.PR.D pair is still off the charts and now predicts an average bill rate over the next 4 3/4 years of -0.76%.
 Click for Big
Shall we just say that this exhibits a high level of confidence in the continued rapacity of Canadian banks?
HIMIPref™ Preferred Indices
These values reflect the December 2008 revision of the HIMIPref™ Indices
Values are provisional and are finalized monthly |
| Index |
Mean
Current
Yield
(at bid) |
Median
YTW |
Median
Average
Trading
Value |
Median
Mod Dur
(YTW) |
Issues |
Day’s Perf. |
Index Value |
| Ratchet |
0.00 % |
0.00 % |
0 |
0.00 |
0 |
0.5018 % |
2,182.0 |
| FixedFloater |
0.00 % |
0.00 % |
0 |
0.00 |
0 |
0.5018 % |
3,815.2 |
| Floater |
3.32 % |
3.48 % |
58,104 |
18.58 |
4 |
0.5018 % |
2,319.6 |
| OpRet |
4.43 % |
-2.93 % |
36,059 |
0.14 |
2 |
0.0394 % |
2,762.1 |
| SplitShare |
4.57 % |
4.52 % |
62,048 |
3.42 |
3 |
0.0267 % |
3,224.1 |
| Interest-Bearing |
0.00 % |
0.00 % |
0 |
0.00 |
0 |
0.0394 % |
2,525.6 |
| Perpetual-Premium |
5.31 % |
2.29 % |
65,412 |
0.08 |
25 |
0.0474 % |
2,524.2 |
| Perpetual-Discount |
5.11 % |
5.05 % |
151,737 |
15.01 |
9 |
-0.5530 % |
2,790.9 |
| FixedReset |
4.55 % |
3.78 % |
269,994 |
16.41 |
85 |
-0.3164 % |
2,348.3 |
| Deemed-Retractible |
4.89 % |
2.14 % |
108,202 |
0.13 |
36 |
-0.0659 % |
2,657.2 |
| FloatingReset |
2.54 % |
2.95 % |
75,264 |
6.26 |
8 |
-0.4478 % |
2,341.6 |
| Performance Highlights |
| Issue |
Index |
Change |
Notes |
| FTS.PR.K |
FixedReset |
-4.29 % |
YTW SCENARIO
Maturity Type : Limit Maturity
Maturity Date : 2045-04-13
Maturity Price : 21.32
Evaluated at bid price : 21.62
Bid-YTW : 3.54 % |
| MFC.PR.F |
FixedReset |
-4.09 % |
YTW SCENARIO
Maturity Type : Hard Maturity
Maturity Date : 2025-01-31
Maturity Price : 25.00
Evaluated at bid price : 17.36
Bid-YTW : 6.85 % |
| TRP.PR.F |
FloatingReset |
-4.00 % |
YTW SCENARIO
Maturity Type : Limit Maturity
Maturity Date : 2045-04-13
Maturity Price : 18.25
Evaluated at bid price : 18.25
Bid-YTW : 3.43 % |
| MFC.PR.L |
FixedReset |
-3.62 % |
YTW SCENARIO
Maturity Type : Hard Maturity
Maturity Date : 2025-01-31
Maturity Price : 25.00
Evaluated at bid price : 22.60
Bid-YTW : 4.67 % |
| HSE.PR.A |
FixedReset |
-3.15 % |
YTW SCENARIO
Maturity Type : Limit Maturity
Maturity Date : 2045-04-13
Maturity Price : 15.70
Evaluated at bid price : 15.70
Bid-YTW : 4.16 % |
| FTS.PR.G |
FixedReset |
-2.61 % |
YTW SCENARIO
Maturity Type : Limit Maturity
Maturity Date : 2045-04-13
Maturity Price : 21.72
Evaluated at bid price : 22.00
Bid-YTW : 3.50 % |
| MFC.PR.K |
FixedReset |
-2.41 % |
YTW SCENARIO
Maturity Type : Hard Maturity
Maturity Date : 2025-01-31
Maturity Price : 25.00
Evaluated at bid price : 23.05
Bid-YTW : 4.34 % |
| BAM.PF.A |
FixedReset |
-2.24 % |
YTW SCENARIO
Maturity Type : Limit Maturity
Maturity Date : 2045-04-13
Maturity Price : 22.91
Evaluated at bid price : 24.00
Bid-YTW : 3.93 % |
| BAM.PF.B |
FixedReset |
-1.99 % |
YTW SCENARIO
Maturity Type : Limit Maturity
Maturity Date : 2045-04-13
Maturity Price : 21.79
Evaluated at bid price : 22.15
Bid-YTW : 4.03 % |
| PWF.PR.P |
FixedReset |
-1.97 % |
YTW SCENARIO
Maturity Type : Limit Maturity
Maturity Date : 2045-04-13
Maturity Price : 16.92
Evaluated at bid price : 16.92
Bid-YTW : 3.66 % |
| SLF.PR.H |
FixedReset |
-1.89 % |
YTW SCENARIO
Maturity Type : Hard Maturity
Maturity Date : 2025-01-31
Maturity Price : 25.00
Evaluated at bid price : 20.80
Bid-YTW : 5.37 % |
| BNS.PR.Z |
FixedReset |
-1.79 % |
YTW SCENARIO
Maturity Type : Hard Maturity
Maturity Date : 2022-01-31
Maturity Price : 25.00
Evaluated at bid price : 22.45
Bid-YTW : 4.04 % |
| MFC.PR.N |
FixedReset |
-1.47 % |
YTW SCENARIO
Maturity Type : Hard Maturity
Maturity Date : 2025-01-31
Maturity Price : 25.00
Evaluated at bid price : 23.40
Bid-YTW : 4.33 % |
| BMO.PR.Q |
FixedReset |
-1.40 % |
YTW SCENARIO
Maturity Type : Hard Maturity
Maturity Date : 2022-01-31
Maturity Price : 25.00
Evaluated at bid price : 22.50
Bid-YTW : 4.14 % |
| MFC.PR.C |
Deemed-Retractible |
-1.18 % |
YTW SCENARIO
Maturity Type : Hard Maturity
Maturity Date : 2025-01-31
Maturity Price : 25.00
Evaluated at bid price : 24.21
Bid-YTW : 4.98 % |
| GWO.PR.N |
FixedReset |
-1.11 % |
YTW SCENARIO
Maturity Type : Hard Maturity
Maturity Date : 2025-01-31
Maturity Price : 25.00
Evaluated at bid price : 16.96
Bid-YTW : 6.76 % |
| BAM.PR.R |
FixedReset |
-1.05 % |
YTW SCENARIO
Maturity Type : Limit Maturity
Maturity Date : 2045-04-13
Maturity Price : 18.87
Evaluated at bid price : 18.87
Bid-YTW : 4.29 % |
| TRP.PR.D |
FixedReset |
1.00 % |
YTW SCENARIO
Maturity Type : Limit Maturity
Maturity Date : 2045-04-13
Maturity Price : 22.42
Evaluated at bid price : 23.15
Bid-YTW : 3.53 % |
| VNR.PR.A |
FixedReset |
1.14 % |
YTW SCENARIO
Maturity Type : Limit Maturity
Maturity Date : 2045-04-13
Maturity Price : 23.05
Evaluated at bid price : 23.99
Bid-YTW : 3.78 % |
| ENB.PF.A |
FixedReset |
1.15 % |
YTW SCENARIO
Maturity Type : Limit Maturity
Maturity Date : 2045-04-13
Maturity Price : 20.26
Evaluated at bid price : 20.26
Bid-YTW : 4.60 % |
| ENB.PF.G |
FixedReset |
1.15 % |
YTW SCENARIO
Maturity Type : Limit Maturity
Maturity Date : 2045-04-13
Maturity Price : 20.25
Evaluated at bid price : 20.25
Bid-YTW : 4.67 % |
| ELF.PR.H |
Perpetual-Premium |
1.26 % |
YTW SCENARIO
Maturity Type : Call
Maturity Date : 2020-04-17
Maturity Price : 25.25
Evaluated at bid price : 25.75
Bid-YTW : 5.01 % |
| BAM.PR.X |
FixedReset |
1.36 % |
YTW SCENARIO
Maturity Type : Limit Maturity
Maturity Date : 2045-04-13
Maturity Price : 17.13
Evaluated at bid price : 17.13
Bid-YTW : 4.12 % |
| ENB.PR.J |
FixedReset |
1.86 % |
YTW SCENARIO
Maturity Type : Limit Maturity
Maturity Date : 2045-04-13
Maturity Price : 20.27
Evaluated at bid price : 20.27
Bid-YTW : 4.46 % |
| CIU.PR.C |
FixedReset |
2.17 % |
YTW SCENARIO
Maturity Type : Limit Maturity
Maturity Date : 2045-04-13
Maturity Price : 16.45
Evaluated at bid price : 16.45
Bid-YTW : 3.43 % |
| TRP.PR.E |
FixedReset |
2.52 % |
YTW SCENARIO
Maturity Type : Limit Maturity
Maturity Date : 2045-04-13
Maturity Price : 22.62
Evaluated at bid price : 23.60
Bid-YTW : 3.50 % |
| PWF.PR.A |
Floater |
3.88 % |
YTW SCENARIO
Maturity Type : Limit Maturity
Maturity Date : 2045-04-13
Maturity Price : 17.14
Evaluated at bid price : 17.14
Bid-YTW : 2.93 % |
| Volume Highlights |
| Issue |
Index |
Shares
Traded |
Notes |
| TD.PF.D |
FixedReset |
144,500 |
TD crossed 25,000 at 25.03. Scotia crossed blocks of 50,000 shares, 35,000 shares, 15,000 and 15,900, all at the same price.
YTW SCENARIO
Maturity Type : Limit Maturity
Maturity Date : 2045-04-13
Maturity Price : 23.15
Evaluated at bid price : 25.01
Bid-YTW : 3.47 % |
| CU.PR.C |
FixedReset |
125,178 |
TD crossed 61,000 at 24.90; Nesbitt crossed 40,000 at the same price.
YTW SCENARIO
Maturity Type : Limit Maturity
Maturity Date : 2045-04-13
Maturity Price : 23.45
Evaluated at bid price : 24.73
Bid-YTW : 3.23 % |
| FTS.PR.H |
FixedReset |
87,914 |
RBC bought 82,400 from Desjardins at 15.49.
YTW SCENARIO
Maturity Type : Limit Maturity
Maturity Date : 2045-04-13
Maturity Price : 15.25
Evaluated at bid price : 15.25
Bid-YTW : 3.70 % |
| BMO.PR.W |
FixedReset |
74,000 |
Nesbitt crossed 40,000 at 24.40.
YTW SCENARIO
Maturity Type : Limit Maturity
Maturity Date : 2045-04-13
Maturity Price : 22.95
Evaluated at bid price : 24.36
Bid-YTW : 3.18 % |
| RY.PR.Z |
FixedReset |
70,544 |
RBC crossed blocks of 25,000 and 28,300, both at 24.85.
YTW SCENARIO
Maturity Type : Limit Maturity
Maturity Date : 2045-04-13
Maturity Price : 23.17
Evaluated at bid price : 24.81
Bid-YTW : 3.11 % |
| CM.PR.P |
FixedReset |
69,700 |
TD crossed 65,000 at 24.32.
YTW SCENARIO
Maturity Type : Limit Maturity
Maturity Date : 2045-04-13
Maturity Price : 22.92
Evaluated at bid price : 24.32
Bid-YTW : 3.17 % |
| There were 52 other index-included issues trading in excess of 10,000 shares. |
| Wide Spread Highlights |
| Issue |
Index |
Quote Data and Yield Notes |
| MFC.PR.L |
FixedReset |
Quote: 22.60 – 23.15
Spot Rate : 0.5500
Average : 0.3739
YTW SCENARIO
Maturity Type : Hard Maturity
Maturity Date : 2025-01-31
Maturity Price : 25.00
Evaluated at bid price : 22.60
Bid-YTW : 4.67 % |
| BAM.PF.A |
FixedReset |
Quote: 24.00 – 24.40
Spot Rate : 0.4000
Average : 0.2412
YTW SCENARIO
Maturity Type : Limit Maturity
Maturity Date : 2045-04-13
Maturity Price : 22.91
Evaluated at bid price : 24.00
Bid-YTW : 3.93 % |
| FTS.PR.J |
Perpetual-Premium |
Quote: 24.55 – 25.00
Spot Rate : 0.4500
Average : 0.3218
YTW SCENARIO
Maturity Type : Limit Maturity
Maturity Date : 2045-04-13
Maturity Price : 24.13
Evaluated at bid price : 24.55
Bid-YTW : 4.88 % |
| FTS.PR.G |
FixedReset |
Quote: 22.00 – 22.37
Spot Rate : 0.3700
Average : 0.2441
YTW SCENARIO
Maturity Type : Limit Maturity
Maturity Date : 2045-04-13
Maturity Price : 21.72
Evaluated at bid price : 22.00
Bid-YTW : 3.50 % |
| TRP.PR.F |
FloatingReset |
Quote: 18.25 – 18.73
Spot Rate : 0.4800
Average : 0.3541
YTW SCENARIO
Maturity Type : Limit Maturity
Maturity Date : 2045-04-13
Maturity Price : 18.25
Evaluated at bid price : 18.25
Bid-YTW : 3.43 % |
| TRP.PR.D |
FixedReset |
Quote: 23.15 – 23.68
Spot Rate : 0.5300
Average : 0.4108
YTW SCENARIO
Maturity Type : Limit Maturity
Maturity Date : 2045-04-13
Maturity Price : 22.42
Evaluated at bid price : 23.15
Bid-YTW : 3.53 % |