News is starting to trickle in regarding casualties of the Swiss Franc move yesterday:
The Swiss National Bank’s abrupt move on Thursday to abandon its cap on the Swiss franc led to massive losses, and at least one insolvency, among retail foreign exchange brokers and trading houses across the globe.
Alpari UK
Online foreign exchange Broker Alpari UK said on Friday it had entered into insolvency after clients sustained losses on the Swiss franc. It said volatility and lack of liquidity had “resulted in the majority of clients sustaining losses which exceeded their account equity.”
FXCM Inc
…
Global Brokers NZ Ltd
The New Zealand foreign exchange dealer was forced to close due to hefty losses incurred due to the SNB’s policy reversal. It said the franc’s move had wiped out the equity of most of its clients with franc positions and left it without the ability to meet minimum capital requirements of 1 million New Zealand dollars ($780,000). New Zealand’s regulator is seeking a status update on client funds from the broker.
…
Swissquote
…
OANDA
…
Saxo Bank
…
IG Group
… and at least one fund:
IG Group shares fell 4.4 percent yesterday. The U.K. spread-betting firm said the financial impact from the surge in the Swiss franc was partially dependent on its ability to recover client debts.
The market turmoil turned the $1.9 billion John Hancock Absolute Return Currency Fund into the biggest loser among U.S. peers. It tumbled 8.7 percent yesterday, the steepest drop on record and the most among more than 2,000 U.S.-domiciled funds tracked by Bloomberg with at least $1 billion under management. The fund had its second-biggest short position in the franc at the end of November, according to the latest fact sheet on John Hancock’s website.
The FXCM problem is attracting some notice:
FXCM Inc. (FXCM), the brokerage facing a shortfall of nearly a quarter-billion dollars after highly-leveraged investors made losing bets on the Swiss franc, pushed back against U.S. regulatory efforts that likely would have left it less vulnerable.
In 2010, the Commodity Futures Trading Commission sought to force individual investors trading currencies to give their broker 10 cents in capital to back every $1 in positions. The regulator failed to accomplish that amid pressure from New York -based FXCM and other brokers, meaning only 2 cents must be pledged.
…
The client losses are shining a spotlight on U.S. regulators’ oversight of retail currency trading and whether they stopped short of necessary curbs to protect customers. In contrast to other markets, investors buying stock with borrowed money must put up at least 50 percent of the purchase price under Federal Reserve rules. The CFTC will probably move to review past efforts to limit currency-trading risks, former officials say.
“Leverage is a big issue that CFTC probably will want to look at as well as increasing transparency and maybe the capital buffer,” Sharon Brown-Hruska, a former commissioner at the CFTC and vice president at the NERA Economic Consulting firm, said in a phone interview.
…
While FXCM announced the customer losses and possible breach of capital requirements Thursday, GAIN Capital Holdings Inc. (GCAP) said it generated a profit. GAIN said in a statement that it had reduced traders’ ability to use leverage last September for Euro-Swiss Franc trades.
We can only hope that the regulators are not able to use this fiasco as a cause celebre to destroy the retail FX market. I see no problem with a 2% margining requirement for FX … but it also seems to me that FXCM had absolutely no protection against a big move … a deep out-of-the-money call, for instance.
Even with Goldman’s exemplary conduct in hedging risk during the crunch as an example (as discussed on July 26, 2010), FXCM managed to screw things up. So the sharks smile:
Leucadia National Corp. gave FXCM Inc. a $300 million cash infusion, extending a lifeline to the currency brokerage hobbled by the Swiss central bank’s decision to let the franc trade freely against the euro.
Leucadia, which owns New York-based investment bank Jefferies Group, extended FXCM a two-year, $300 million senior secured term loan with an initial coupon of 10 percent, according to a statement Friday. The transaction allows FXCM, the largest U.S. retail foreign-exchange broker, to “continue normal operations,” according to the statement.
Shares of New York-based FXCM had tumbled as much as 92 percent to 98 cents Friday morning before they were halted. After the Leucadia deal was released, FXCM’s stock rebounded to $4.44 as of 5:40 p.m. New York time. That’s still down from the prior day’s closing price of $12.63
… and, just so we can keep up to date on an old story, Moody’s cut Russia to Baa3:
Moody’s lowered the country to Baa3, one step above junk, from Baa2. The credit grade matches those of Standard & Poor’s and Fitch Ratings. The rating, on par with India and Turkey, is on review for a further reduction, the ratings company said in a statement.
“The severe — and likely to be sustained — oil price shock, alongside Russian borrowers’ highly restricted international market access due to ongoing sanctions, is undermining economic fundamentals and increasing financial stresses on both the public and private sectors,” Moody’s said in a report
Holy smokaramaville, it was a hot day for the Canadian preferred share market! PerpetualDiscounts won 61bp, FixedResets gained 21bp and DeemedRetractibles were up 46bp. The Performance Highlights table is enormous, with a great many low-spread FixedResets on the bad side, with the good side containing Straight Perpetuals of all flavours and a fair smattering of high-spread FixedResets. Volume was very high.
For as long as the FixedReset market is so violently unsettled, I’ll keep publishing updates of the more interesting and meaningful series of FixedResets’ Implied Volatilities. This doesn’t include Enbridge because although Enbridge has a large number of issues outstanding, all of which are quite liquid, the range of Issue Reset Spreads is too small for decent conclusions. The low is 212bp (ENB.PR.H; second-lowest is ENB.PR.D at 237bp) and the high is a mere 268 for ENB.PF.G.
Remember that all rich /cheap assessments are:
- based on Implied Volatility Theory only
- are relative only to other FixedResets from the same issuer
- assume constant GOC-5 yield
- assume constant Implied Volatility
- assume constant spread
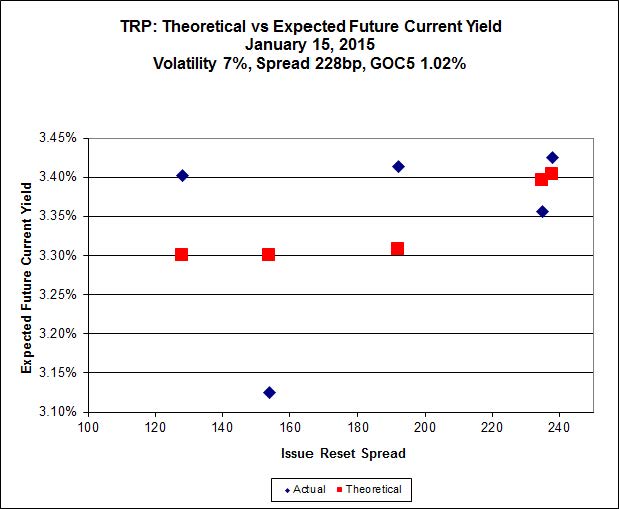
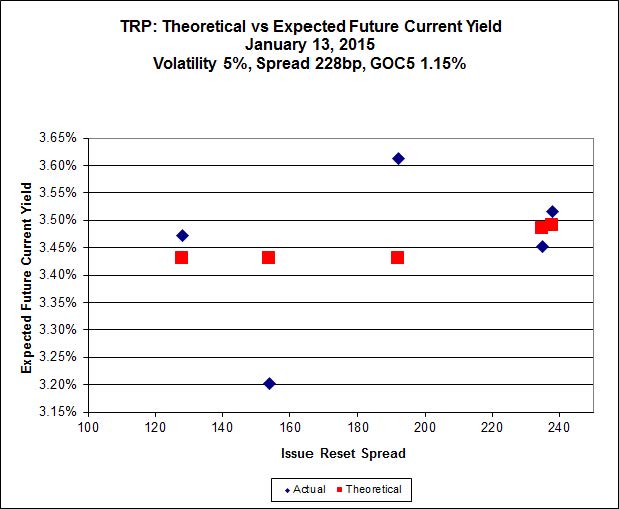
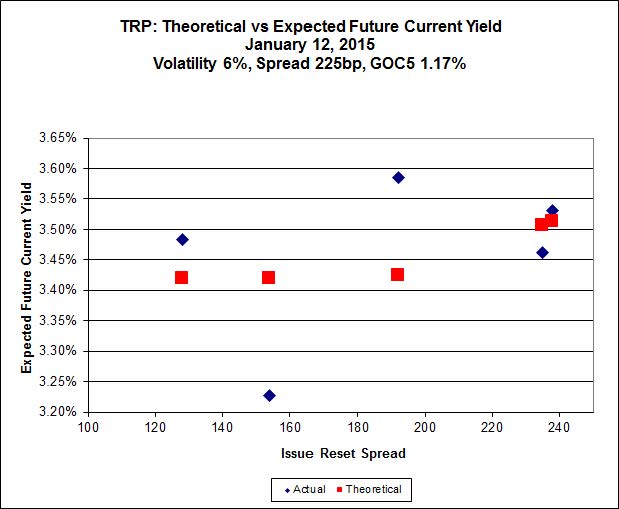
Here’s TRP:
 Click for Big
So according to this, TRP.PR.A, bid at 20.45, is $1.29 cheap, but it has already reset (at +192). TRP.PR.C, bid at 20.35 and resetting at +154bp on 2016-1-30 is $1.36 rich.
 Click for Big
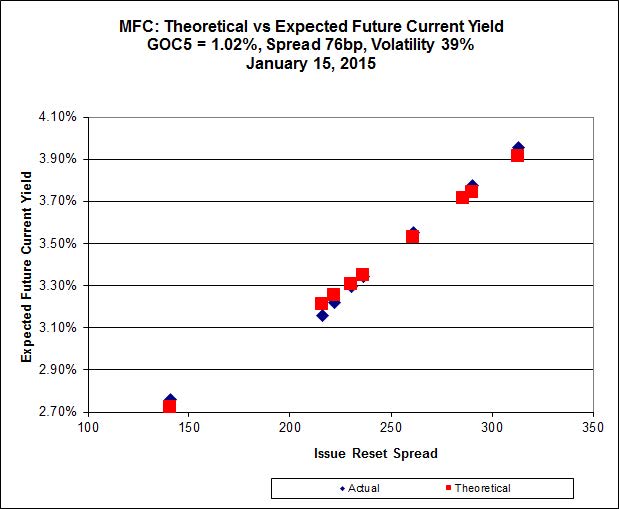
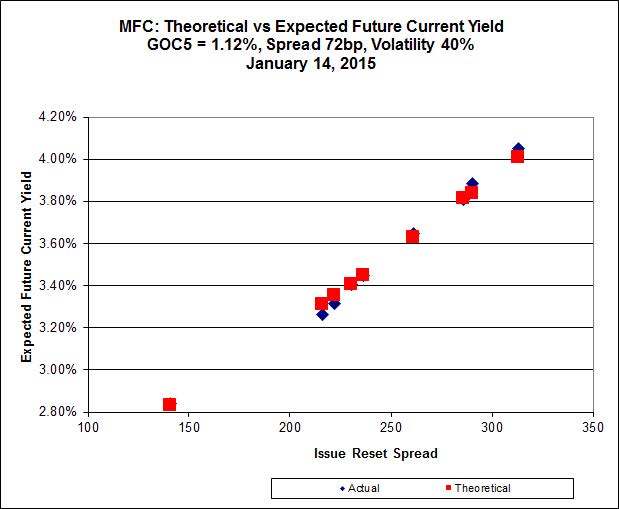
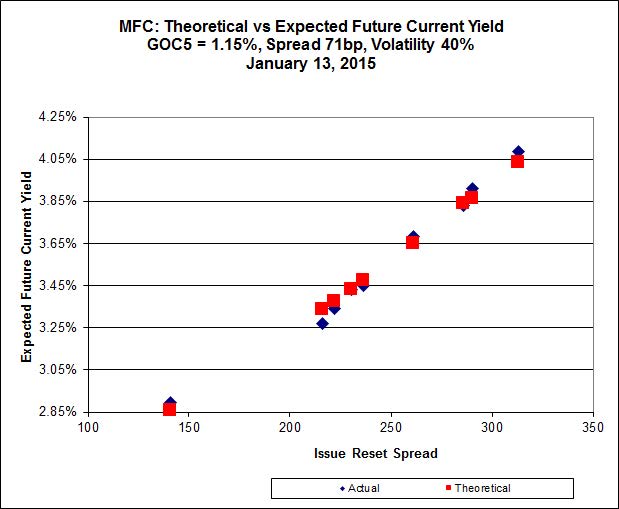
MFC.PR.F continues to be near the line defined by its peers, although it drifted up by a small amount today. Implied Volatility continues to be a conundrum. It is far too high if we consider that NVCC rules will never apply to these issues; it is still too low if we consider them to be NVCC non-compliant issues (and therefore with Deemed Maturities in the call schedule).
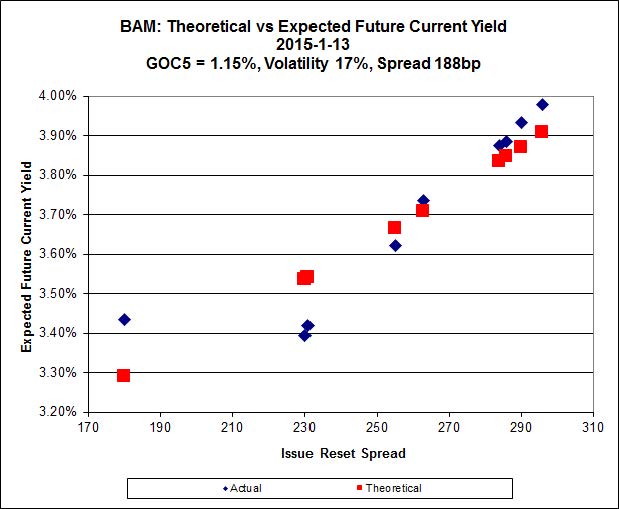
 Click for Big
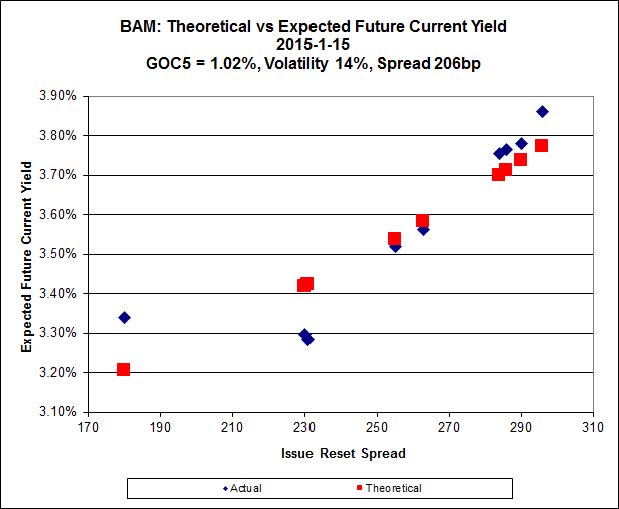
There continues to be cheapness in the lowest-spread issue, BAM.PR.X, resetting at +180bp on 2017-6-30, which is bid at 21.56 and appears to be $0.89 cheap, while BAM.PR.R, resetting at +230bp 2016-6-30 is bid at 25.59 and appears to be $0.97 rich.
It seems clear that the higher-spread issues define a curve with significantly more Implied Volatility than is calculated when the low-spread outlier is included.
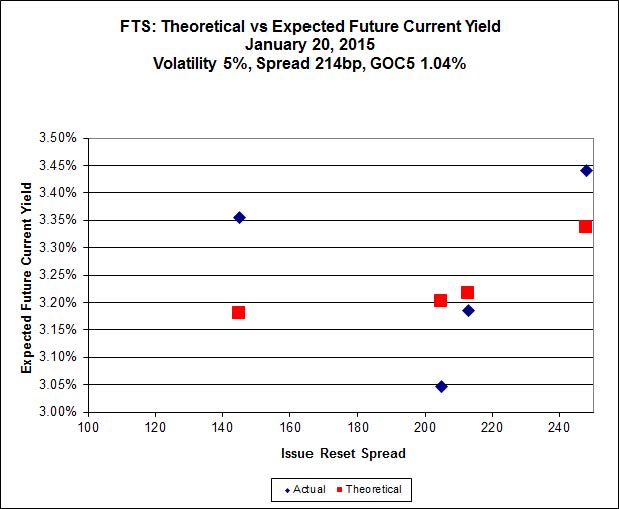
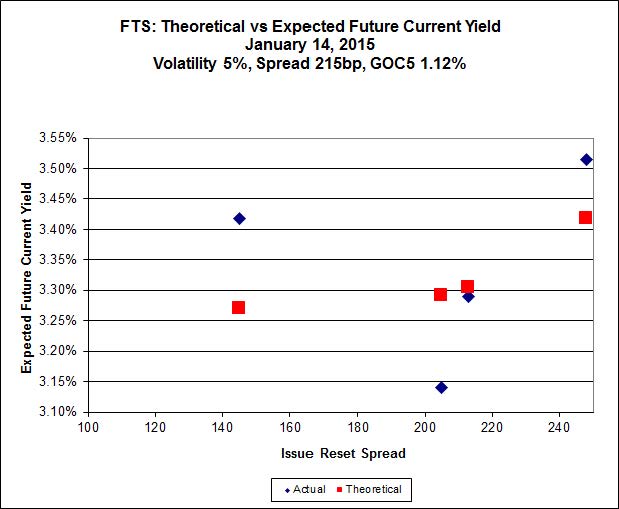
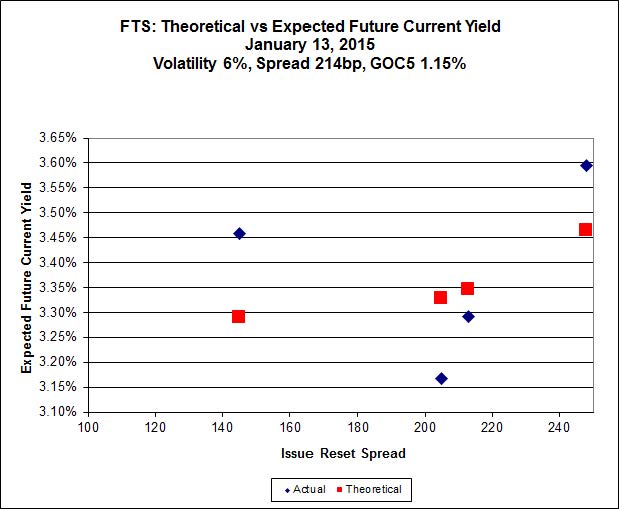
 Click for Big
This is just weird because the middle is expensive and the ends are cheap but anyway … FTS.PR.H, with a spread of +145bp, and bid at 18.75, looks $0.89 cheap and resets 2015-6-1. FTS.PR.K, with a spread of +205bp, and bid at 25.35, looks $1.22 expensive and resets 2019-3-1
 Click for Big
Click for Big
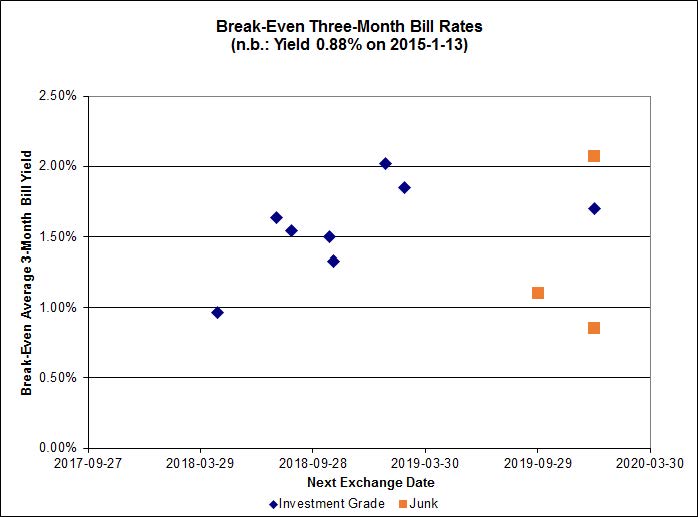
Pairs equivalence is all over the map.
And, yeah, Bell claims there’s no network problem in Toronto, but I am still forced to use my ‘phone as a Wi-Fi hotspot. But don’t worry! Our beloved government will continue to protect us from the evils of American competition, so nobody will lose his job over this fiasco.
I’m spending $25 a day on cell phone data charges. I wonder if Bell will give me a refund.
HIMIPref™ Preferred Indices
These values reflect the December 2008 revision of the HIMIPref™ Indices
Values are provisional and are finalized monthly |
| Index |
Mean
Current
Yield
(at bid) |
Median
YTW |
Median
Average
Trading
Value |
Median
Mod Dur
(YTW) |
Issues |
Day’s Perf. |
Index Value |
| Ratchet |
0.00 % |
0.00 % |
0 |
0.00 |
0 |
0.2846 % |
2,541.7 |
| FixedFloater |
4.45 % |
3.63 % |
19,831 |
18.24 |
1 |
-0.4194 % |
3,975.8 |
| Floater |
2.98 % |
3.09 % |
55,411 |
19.51 |
4 |
0.2846 % |
2,702.0 |
| OpRet |
4.04 % |
1.36 % |
96,624 |
0.42 |
1 |
0.0000 % |
2,756.4 |
| SplitShare |
4.26 % |
4.04 % |
34,656 |
3.62 |
5 |
0.0474 % |
3,207.8 |
| Interest-Bearing |
0.00 % |
0.00 % |
0 |
0.00 |
0 |
0.0000 % |
2,520.4 |
| Perpetual-Premium |
5.42 % |
-10.24 % |
59,484 |
0.09 |
19 |
0.3302 % |
2,507.5 |
| Perpetual-Discount |
5.11 % |
4.98 % |
106,922 |
15.43 |
16 |
0.6141 % |
2,710.8 |
| FixedReset |
4.20 % |
3.43 % |
201,534 |
16.65 |
77 |
0.2121 % |
2,546.1 |
| Deemed-Retractible |
4.92 % |
1.01 % |
98,618 |
0.20 |
39 |
0.4592 % |
2,632.5 |
| FloatingReset |
2.72 % |
2.38 % |
62,157 |
3.59 |
7 |
-0.9568 % |
2,456.5 |
| Performance Highlights |
| Issue |
Index |
Change |
Notes |
| TRP.PR.A |
FixedReset |
-5.02 % |
This is actually real, as the closing bid of 20.45 was also the low for the day and the VWAP of 20.566496 was achieved on a high volume of 166,641 shares (consolidated exchanges). A lot of 100 share sales at the end of the day came out of Credit Suisse.
YTW SCENARIO
Maturity Type : Limit Maturity
Maturity Date : 2045-01-16
Maturity Price : 20.45
Evaluated at bid price : 20.45
Bid-YTW : 3.91 % |
| TRP.PR.B |
FixedReset |
-1.83 % |
YTW SCENARIO
Maturity Type : Limit Maturity
Maturity Date : 2045-01-16
Maturity Price : 16.59
Evaluated at bid price : 16.59
Bid-YTW : 3.83 % |
| SLF.PR.G |
FixedReset |
-1.82 % |
YTW SCENARIO
Maturity Type : Hard Maturity
Maturity Date : 2025-01-31
Maturity Price : 25.00
Evaluated at bid price : 19.97
Bid-YTW : 5.34 % |
| TRP.PR.F |
FloatingReset |
-1.62 % |
YTW SCENARIO
Maturity Type : Limit Maturity
Maturity Date : 2045-01-16
Maturity Price : 21.30
Evaluated at bid price : 21.30
Bid-YTW : 3.32 % |
| ENB.PR.F |
FixedReset |
-1.22 % |
YTW SCENARIO
Maturity Type : Limit Maturity
Maturity Date : 2045-01-16
Maturity Price : 22.19
Evaluated at bid price : 22.67
Bid-YTW : 4.18 % |
| ENB.PR.H |
FixedReset |
-1.19 % |
YTW SCENARIO
Maturity Type : Limit Maturity
Maturity Date : 2045-01-16
Maturity Price : 20.70
Evaluated at bid price : 20.70
Bid-YTW : 4.24 % |
| BMO.PR.R |
FloatingReset |
-1.18 % |
YTW SCENARIO
Maturity Type : Call
Maturity Date : 2018-08-25
Maturity Price : 25.00
Evaluated at bid price : 25.09
Bid-YTW : 2.38 % |
| BNS.PR.C |
FloatingReset |
-1.14 % |
YTW SCENARIO
Maturity Type : Call
Maturity Date : 2019-01-26
Maturity Price : 25.00
Evaluated at bid price : 25.15
Bid-YTW : 2.44 % |
| ENB.PR.Y |
FixedReset |
-1.12 % |
YTW SCENARIO
Maturity Type : Limit Maturity
Maturity Date : 2045-01-16
Maturity Price : 21.66
Evaluated at bid price : 22.01
Bid-YTW : 4.23 % |
| TD.PR.T |
FloatingReset |
-1.03 % |
YTW SCENARIO
Maturity Type : Call
Maturity Date : 2018-07-31
Maturity Price : 25.00
Evaluated at bid price : 24.95
Bid-YTW : 2.36 % |
| BAM.PR.T |
FixedReset |
1.07 % |
YTW SCENARIO
Maturity Type : Limit Maturity
Maturity Date : 2045-01-16
Maturity Price : 23.74
Evaluated at bid price : 25.62
Bid-YTW : 3.42 % |
| IFC.PR.C |
FixedReset |
1.09 % |
YTW SCENARIO
Maturity Type : Call
Maturity Date : 2016-09-30
Maturity Price : 25.00
Evaluated at bid price : 26.08
Bid-YTW : 1.74 % |
| BAM.PF.C |
Perpetual-Discount |
1.13 % |
YTW SCENARIO
Maturity Type : Limit Maturity
Maturity Date : 2045-01-16
Maturity Price : 22.15
Evaluated at bid price : 22.47
Bid-YTW : 5.43 % |
| POW.PR.D |
Perpetual-Discount |
1.17 % |
YTW SCENARIO
Maturity Type : Limit Maturity
Maturity Date : 2045-01-16
Maturity Price : 24.68
Evaluated at bid price : 24.99
Bid-YTW : 5.02 % |
| BAM.PF.B |
FixedReset |
1.21 % |
YTW SCENARIO
Maturity Type : Call
Maturity Date : 2019-03-31
Maturity Price : 25.00
Evaluated at bid price : 25.92
Bid-YTW : 3.32 % |
| SLF.PR.I |
FixedReset |
1.26 % |
YTW SCENARIO
Maturity Type : Call
Maturity Date : 2016-12-31
Maturity Price : 25.00
Evaluated at bid price : 26.46
Bid-YTW : 1.32 % |
| PWF.PR.S |
Perpetual-Discount |
1.32 % |
YTW SCENARIO
Maturity Type : Limit Maturity
Maturity Date : 2045-01-16
Maturity Price : 24.16
Evaluated at bid price : 24.57
Bid-YTW : 4.88 % |
| SLF.PR.A |
Deemed-Retractible |
1.35 % |
YTW SCENARIO
Maturity Type : Hard Maturity
Maturity Date : 2025-01-31
Maturity Price : 25.00
Evaluated at bid price : 24.84
Bid-YTW : 4.89 % |
| BAM.PR.N |
Perpetual-Discount |
1.40 % |
YTW SCENARIO
Maturity Type : Limit Maturity
Maturity Date : 2045-01-16
Maturity Price : 21.94
Evaluated at bid price : 22.40
Bid-YTW : 5.32 % |
| POW.PR.G |
Perpetual-Premium |
1.41 % |
YTW SCENARIO
Maturity Type : Call
Maturity Date : 2017-04-15
Maturity Price : 26.00
Evaluated at bid price : 26.66
Bid-YTW : 4.22 % |
| BAM.PR.M |
Perpetual-Discount |
1.45 % |
YTW SCENARIO
Maturity Type : Limit Maturity
Maturity Date : 2045-01-16
Maturity Price : 22.03
Evaluated at bid price : 22.39
Bid-YTW : 5.33 % |
| BNS.PR.Z |
FixedReset |
1.52 % |
YTW SCENARIO
Maturity Type : Hard Maturity
Maturity Date : 2022-01-31
Maturity Price : 25.00
Evaluated at bid price : 24.68
Bid-YTW : 2.92 % |
| BAM.PR.R |
FixedReset |
1.63 % |
YTW SCENARIO
Maturity Type : Limit Maturity
Maturity Date : 2045-01-16
Maturity Price : 23.95
Evaluated at bid price : 25.59
Bid-YTW : 3.46 % |
| MFC.PR.B |
Deemed-Retractible |
1.78 % |
YTW SCENARIO
Maturity Type : Hard Maturity
Maturity Date : 2025-01-31
Maturity Price : 25.00
Evaluated at bid price : 24.59
Bid-YTW : 4.93 % |
| MFC.PR.C |
Deemed-Retractible |
1.79 % |
YTW SCENARIO
Maturity Type : Hard Maturity
Maturity Date : 2025-01-31
Maturity Price : 25.00
Evaluated at bid price : 23.94
Bid-YTW : 5.12 % |
| SLF.PR.E |
Deemed-Retractible |
1.89 % |
YTW SCENARIO
Maturity Type : Hard Maturity
Maturity Date : 2025-01-31
Maturity Price : 25.00
Evaluated at bid price : 23.75
Bid-YTW : 5.20 % |
| BAM.PR.X |
FixedReset |
2.08 % |
YTW SCENARIO
Maturity Type : Limit Maturity
Maturity Date : 2045-01-16
Maturity Price : 21.27
Evaluated at bid price : 21.56
Bid-YTW : 3.72 % |
| PWF.PR.P |
FixedReset |
2.23 % |
YTW SCENARIO
Maturity Type : Limit Maturity
Maturity Date : 2045-01-16
Maturity Price : 21.07
Evaluated at bid price : 21.07
Bid-YTW : 3.43 % |
| PWF.PR.O |
Perpetual-Premium |
2.33 % |
YTW SCENARIO
Maturity Type : Call
Maturity Date : 2015-02-15
Maturity Price : 26.00
Evaluated at bid price : 26.76
Bid-YTW : -29.98 % |
| GWO.PR.I |
Deemed-Retractible |
2.52 % |
YTW SCENARIO
Maturity Type : Hard Maturity
Maturity Date : 2025-01-31
Maturity Price : 25.00
Evaluated at bid price : 23.60
Bid-YTW : 5.28 % |
| Volume Highlights |
| Issue |
Index |
Shares
Traded |
Notes |
| RY.PR.C |
Deemed-Retractible |
238,349 |
Nesbitt crossed blocks of 140,700 and 94,200, both at 25.60.
YTW SCENARIO
Maturity Type : Call
Maturity Date : 2015-02-15
Maturity Price : 25.25
Evaluated at bid price : 25.55
Bid-YTW : -1.84 % |
| TRP.PR.B |
FixedReset |
208,866 |
Scotia crossed 50,000 at 16.58 and 25,000 at 16.59. Desjardins crossed blocks of 12,000 and 25,000 at 16.59, as well as 38,000 at 16.60.
YTW SCENARIO
Maturity Type : Limit Maturity
Maturity Date : 2045-01-16
Maturity Price : 16.59
Evaluated at bid price : 16.59
Bid-YTW : 3.83 % |
| TD.PF.C |
FixedReset |
177,723 |
Recent new issue.
YTW SCENARIO
Maturity Type : Limit Maturity
Maturity Date : 2045-01-16
Maturity Price : 23.21
Evaluated at bid price : 25.15
Bid-YTW : 3.40 % |
| TRP.PR.A |
FixedReset |
158,041 |
Scotia crossed 115,000 at 20.48.
YTW SCENARIO
Maturity Type : Limit Maturity
Maturity Date : 2045-01-16
Maturity Price : 20.45
Evaluated at bid price : 20.45
Bid-YTW : 3.91 % |
| MFC.PR.N |
FixedReset |
155,835 |
RBC crossed 25,000 at 25.27. Desjardins crossed 10,000 at 25.30. TD crossed blocks of 39,400 and 50,000, both at 25.30.
YTW SCENARIO
Maturity Type : Hard Maturity
Maturity Date : 2025-01-31
Maturity Price : 25.00
Evaluated at bid price : 25.30
Bid-YTW : 3.60 % |
| BNS.PR.R |
FixedReset |
93,888 |
Nesbitt crossed 83,500 at 25.60.
YTW SCENARIO
Maturity Type : Hard Maturity
Maturity Date : 2022-01-31
Maturity Price : 25.00
Evaluated at bid price : 25.55
Bid-YTW : 3.17 % |
| There were 48 other index-included issues trading in excess of 10,000 shares. |
| Wide Spread Highlights |
| Issue |
Index |
Quote Data and Yield Notes |
| IFC.PR.A |
FixedReset |
Quote: 21.58 – 22.82
Spot Rate : 1.2400
Average : 0.9895
YTW SCENARIO
Maturity Type : Hard Maturity
Maturity Date : 2025-01-31
Maturity Price : 25.00
Evaluated at bid price : 21.58
Bid-YTW : 5.16 % |
| NEW.PR.D |
SplitShare |
Quote: 32.30 – 33.30
Spot Rate : 1.0000
Average : 0.8218
YTW SCENARIO
Maturity Type : Call
Maturity Date : 2015-06-26
Maturity Price : 32.07
Evaluated at bid price : 32.30
Bid-YTW : 3.13 % |
| RY.PR.H |
FixedReset |
Quote: 25.26 – 25.68
Spot Rate : 0.4200
Average : 0.2820
YTW SCENARIO
Maturity Type : Limit Maturity
Maturity Date : 2045-01-16
Maturity Price : 23.28
Evaluated at bid price : 25.26
Bid-YTW : 3.43 % |
| BAM.PR.C |
Floater |
Quote: 16.92 – 17.28
Spot Rate : 0.3600
Average : 0.2300
YTW SCENARIO
Maturity Type : Limit Maturity
Maturity Date : 2045-01-16
Maturity Price : 16.92
Evaluated at bid price : 16.92
Bid-YTW : 3.12 % |
| ENB.PR.H |
FixedReset |
Quote: 20.70 – 21.11
Spot Rate : 0.4100
Average : 0.2901
YTW SCENARIO
Maturity Type : Limit Maturity
Maturity Date : 2045-01-16
Maturity Price : 20.70
Evaluated at bid price : 20.70
Bid-YTW : 4.24 % |
| IAG.PR.A |
Deemed-Retractible |
Quote: 24.07 – 24.45
Spot Rate : 0.3800
Average : 0.2687
YTW SCENARIO
Maturity Type : Hard Maturity
Maturity Date : 2025-01-31
Maturity Price : 25.00
Evaluated at bid price : 24.07
Bid-YTW : 5.13 % |