BAM.PR.H To Be Redeemed

March 5th, 2012

Brookfield Asset Management has announced:

its intention to redeem all of its outstanding Class A Preference Shares, Series 10 (TSX: BAM.PR.H) for cash on April 5, 2012. The redemption price for each such share will be C$25.00 plus accrued and unpaid dividends thereon (for greater certainty, excluding declared dividends with a record date prior to the redemption date). Brookfield intends to use the net proceeds of the issue of Preferred Shares, Series 32 to redeem its Preference Shares, Series 10 and, to the extent the underwriters’ option is exercised, for general corporate purposes.

The issuance of the Series 32 (FixedReset, 4.50%+290) has been reported on PrefBlog.

New Issue: BAM FixedReset 4.50%+290

March 5th, 2012

Brookfield Asset Management has announced:

that it has agreed to issue 10,000,000 Class A Preferred Shares, Series 32 on a bought deal basis to a syndicate of underwriters led by RBC Capital Markets, CIBC, Scotia Capital Inc. and TD Securities Inc. for distribution to the public. The Preferred Shares, Series 32 will be issued at a price of CDN$25.00 per share, for aggregate gross proceeds of CDN$250,000,000. Holders of the Preferred Shares, Series 32 will be entitled to receive a cumulative quarterly fixed dividend yielding 4.50% annually for the initial period ending September 30, 2018. Thereafter, the dividend rate will be reset every five years at a rate equal to the 5-year Government of Canada bond yield plus 2.90%.

Brookfield has granted the underwriters an option, exercisable until 48 hours prior to closing, to purchase up to an additional 2,000,000 Preferred Shares, Series 32 which, if exercised, would increase the gross offering size to CDN$300,000,000. The Preferred Shares, Series 32 will be offered in all provinces of Canada by way of a supplement to Brookfield Asset Management’s existing short form base shelf prospectus dated June 7, 2011.

Proceeds will mostly be used to fund the redemption of BAM.PR.H.

MAPF Performance: February 2012

March 3rd, 2012

The fund underperformed in February as the extremely poor performance of the YLO preferreds reduced returns by slightly over 100bp.

The fund’s Net Asset Value per Unit as of the close February, 2012, was 10.6167.

Returns to February, 2012
Period MAPF Index CPD
according to
Claymore
One Month -0.62% -0.22% -0.12%
Three Months +6.25% +2.98% +2.93%
One Year +2.71% +6.77% +4.95%
Two Years (annualized) +11.26% +9.20% N/A
Three Years (annualized) +23.95% +15.03% +12.10%
Four Years (annualized) +17.40% +6.16%  
Five Years (annualized) +14.49% +4.01%  
Six Years (annualized) +13.15% +4.09%  
Seven Years (annualized) +12.05% +4.07%  
Eight Years (annualized) +11.69% +4.02%  
Nine Years (annualized) +13.63% +4.65%  
Ten Years (annualized) +12.30% +4.40%  
The Index is the BMO-CM “50”
MAPF returns assume reinvestment of distributions, and are shown after expenses but before fees.
CPD Returns are for the NAV and are after all fees and expenses.
* CPD does not directly report its two-year returns.
Figures for Omega Preferred Equity (which are after all fees and expenses) for 1-, 3- and 12-months are +0.09%, +3.15% and +5.54%, respectively, according to Morningstar after all fees & expenses. Three year performance is +13.41%.
Figures for Jov Leon Frazer Preferred Equity Fund Class I Units (which are after all fees and expenses) for 1-, 3- and 12-months are +0.98%, +2.36% and +4.29% respectively, according to Morningstar. Three Year performnce is +9.40%
Figures for Manulife Preferred Income Fund (formerly AIC Preferred Income Fund) (which are after all fees and expenses) for 1-, 3- and 12-months are +0.09%, +2.88% & +5.20%, respectively
Figures for Horizons AlphaPro Preferred Share ETF (which are after all fees and expenses) for 1-, 3- and 12-months are +0.25%, +3.91% & +6.53%, respectively.

MAPF returns assume reinvestment of dividends, and are shown after expenses but before fees. Past performance is not a guarantee of future performance. You can lose money investing in Malachite Aggressive Preferred Fund or any other fund. For more information, see the fund’s main page. The fund is available either directly from Hymas Investment Management or through a brokerage account at Odlum Brown Limited.

The horrible performance of the YLO preferreds over the month (losses of between 60% (YLO.PR.A) and 76% (YLO.PR.D)) can be ascribed to the suspension of dividends on these issues, followed by sharp downgrades from DBRS and S&P. Unitholders and casual readers will know that these issues have been a nightmare for me since the renegotiation of their bank credit facilities in September. With the benefit of hindsight, it is easy to say I should have sold everything then – or at least stopped purchases after the credit downgrades in August – but … I didn’t. While I have been quite cognizant of the fact that credit quality of YLO has been deteriorating, I have also considered the decline to be more than fully reflected in the market price of these issues – and why sell for less than there estimated value?

One question that springs to mind is: just why, exactly, did the company suspend preferred dividends? This is a drastic measure to take and most companies maintain payouts until the very day they file for CCCA protection; in addition, YLO is both profitable and cash-flow positive. It is my belief that the board looked at the price their public securities – common, preferreds and bonds – were trading at and decided that since the public was of the view that bankruptcy was imminent they ‘might as well have the game as the name’.

YLO Preferred Dividends Foregone
Issue Shares Out Dividend / Share Total
(Millions)
YLO.PR.A 10,045,872 1.0625 $10.7
YLO.PR.B 6,062,128 1.25 $7.6
YLO.PR.C 8,120,900 1.6875 $13.7
YLO.PR.D 4,919,920 1.725 $8.5
  $40.5

Note that the calculation assumes that all issues remain outstanding, but the company can convert YLO.PR.A to common at the end of March, and YLO.PR.B to common at the end of June. The suspension of dividends means that such conversions will no longer have a cash-flow benefit, but conversions would halt the accrual of dividends, which are cumulative for all issues.

But one may say that a little over $10-million per quarter can now go towards paying down debt rather than paying out dividends – every little bit helps and, with luck, the relatively improved balance sheet will assist them to make a deal.

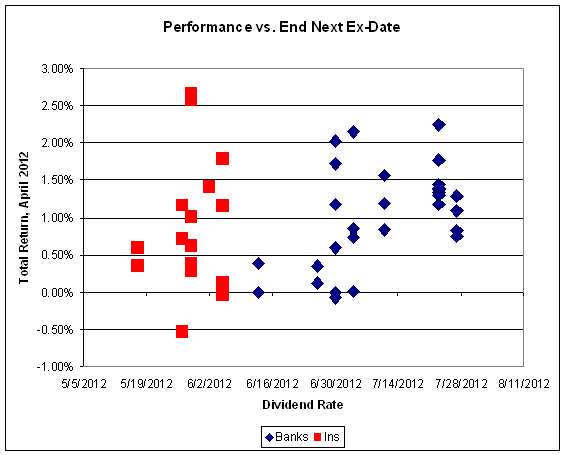
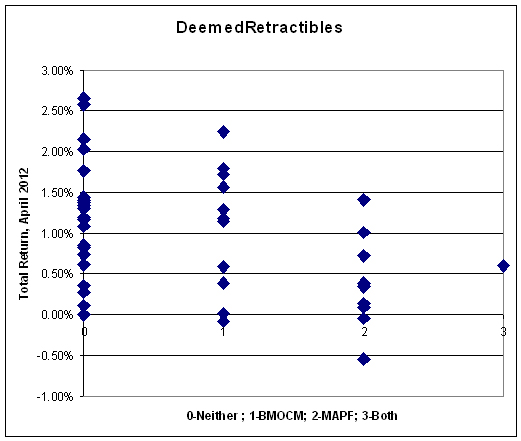
There was a large gyration in relative prices of bank and insurer DeemedRetractibles during the month, due to some long-awaited (by me, anyway!) issuance of Straight Perpetuals: GWO.PR.P, PWF.PR.R and POW.PR.G. The following chart shows the difference in bid price between CM.PR.J and GWO.PR.I, which pay the same annual dividend. No correction has been made for the difference in ex-Dividend dates:


Click for Big

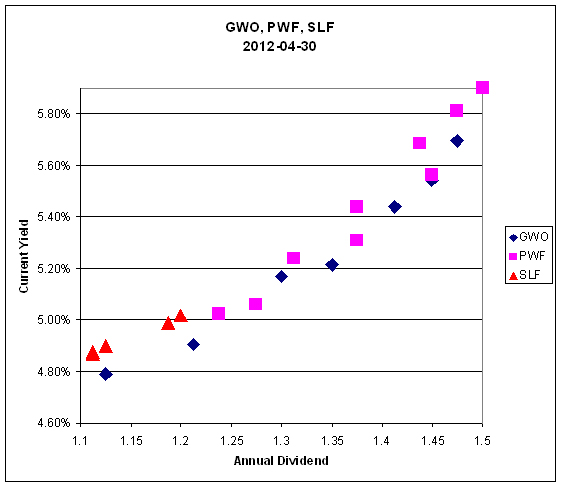
SLF DeemedRetractibles performed quite well over the month and may be compared with PWF and GWO:


Click for Big

Click for Big

It is quite apparent that the pricing difference between SLF and similar issues has narrowed – and also that the market continues to treat regulated issues (SLF, GWO) no differently from unregulated issues (PWF).

The extent of the remaining SLF exceptionalism is better illustrated by a chart showing the current yield against the bid price:


Click for Big

Amazingly, SLF now trades comparably to WN, instead of cheaper!:


Click for Big

In order to rationalize the relationship between the Current Yields we are asked to believe:

  • That the additional credit quality of SLF is worthless
    • It is possible, of course, to argue that WN is actually a better credit than SLF, or that the scarcity value of a non-financial preferred outweighs the difference in credit. I have not yet heard these arguments being made
  • The option value of the issuer’s call is worthless
    • This can be phrased as ‘The potential capital gain for the SLF issues prior to a call, relative to that of the WN issues, is worthless’
  • The potential of a regulatory inspired call for the SLF issues is worthless
    • the SLF issues are currently Tier 1 Capital at the holding company level, but do not have an NVCC clause

Sometimes everything works … sometimes it’s 50-50 … sometimes nothing works. The fund seeks to earn incremental return by selling liquidity (that is, taking the other side of trades that other market participants are strongly motivated to execute), which can also be referred to as ‘trading noise’. There were a lot of strongly motivated market participants during the Panic of 2007, generating a lot of noise! Unfortunately, the conditions of the Panic may never be repeated in my lifetime … but the fund will simply attempt to make trades when swaps seem profitable, without worrying about the level of monthly turnover.

There’s plenty of room for new money left in the fund. I have shown in recent issues of PrefLetter that market pricing for FixedResets is demonstrably stupid and I have lots of confidence – backed up by my bond portfolio management experience in the markets for Canadas and Treasuries, and equity trading on the NYSE & TSX – that there is enough demand for liquidity in any market to make the effort of providing it worthwhile (although the definition of “worthwhile” in terms of basis points of outperformance changes considerably from market to market!) I will continue to exert utmost efforts to outperform but it should be borne in mind that there will almost inevitably be periods of underperformance in the future.

The yields available on high quality preferred shares remain elevated, which is reflected in the current estimate of sustainable income.

Calculation of MAPF Sustainable Income Per Unit
Month NAVPU Portfolio
Average
YTW
Leverage
Divisor
Securities
Average
YTW
Capital
Gains
Multiplier
Sustainable
Income
per
current
Unit
June, 2007 9.3114 5.16% 1.03 5.01% 1.3240 0.3524
September 9.1489 5.35% 0.98 5.46% 1.3240 0.3773
December, 2007 9.0070 5.53% 0.942 5.87% 1.3240 0.3993
March, 2008 8.8512 6.17% 1.047 5.89% 1.3240 0.3938
June 8.3419 6.034% 0.952 6.338% 1.3240 $0.3993
September 8.1886 7.108% 0.969 7.335% 1.3240 $0.4537
December, 2008 8.0464 9.24% 1.008 9.166% 1.3240 $0.5571
March 2009 $8.8317 8.60% 0.995 8.802% 1.3240 $0.5872
June 10.9846 7.05% 0.999 7.057% 1.3240 $0.5855
September 12.3462 6.03% 0.998 6.042% 1.3240 $0.5634
December 2009 10.5662 5.74% 0.981 5.851% 1.1141 $0.5549
March 2010 10.2497 6.03% 0.992 6.079% 1.1141 $0.5593
June 10.5770 5.96% 0.996 5.984% 1.1141 $0.5681
September 11.3901 5.43% 0.980 5.540% 1.1141 $0.5664
December 2010 10.7659 5.37% 0.993 5.408% 1.0298 $0.5654
March, 2011 11.0560 6.00% 0.994 5.964% 1.0298 $0.6403
June 11.1194 5.87% 1.018 5.976% 1.0298 $0.6453
September 10.2709 6.10%
Note
1.001 6.106% 1.0298 $0.6090
December, 2011 10.0793 5.63%
Note
1.031 5.805% 1.0000 $0.5851
February, 2012 10.6167 4.88%
Note
0.999 4.875% 1.0000 $0.5176
NAVPU is shown after quarterly distributions of dividend income and annual distribution of capital gains.
Portfolio YTW includes cash (or margin borrowing), with an assumed interest rate of 0.00%
The Leverage Divisor indicates the level of cash in the account: if the portfolio is 1% in cash, the Leverage Divisor will be 0.99
Securities YTW divides “Portfolio YTW” by the “Leverage Divisor” to show the average YTW on the securities held; this assumes that the cash is invested in (or raised from) all securities held, in proportion to their holdings.
The Capital Gains Multiplier adjusts for the effects of Capital Gains Dividends. On 2009-12-31, there was a capital gains distribution of $1.989262 which is assumed for this purpose to have been reinvested at the final price of $10.5662. Thus, a holder of one unit pre-distribution would have held 1.1883 units post-distribution; the CG Multiplier reflects this to make the time-series comparable. Note that Dividend Distributions are not assumed to be reinvested.
Sustainable Income is the resultant estimate of the fund’s dividend income per current unit, before fees and expenses. Note that a “current unit” includes reinvestment of prior capital gains; a unitholder would have had the calculated sustainable income with only, say, 0.9 units in the past which, with reinvestment of capital gains, would become 1.0 current units.
DeemedRetractibles are comprised of all Straight Perpetuals (both PerpetualDiscount and PerpetualPremium) issued by BMO, BNS, CM, ELF, GWO, HSB, IAG, MFC, NA, RY, SLF and TD, which are not exchangable into common at the option of the company (definition refined in May). These issues are analyzed as if their prospectuses included a requirement to redeem at par on or prior to 2022-1-31, in addition to the call schedule explicitly defined. See OSFI Does Not Grandfather Extant Tier 1 Capital, CM.PR.D, CM.PR.E, CM.PR.G: Seeking NVCC Status and the January, February, March and June, 2011, editions of PrefLetter for the rationale behind this analysis.
Yields for September, 2011, to January, 2012, were calculated by imposing a cap of 10% on the yields of YLO issues held, in order to avoid their extremely high calculated yields distorting the calculation and to reflect the uncertainty in the marketplace that these yields will be realized. Commencing February, 2012, yields on these issues have been set to zero.

Significant positions were held in DeemedRetractible and FixedReset issues on February 29; all of the former and most of the latter currently have their yields calculated with the presumption that they will be called by the issuers at par prior to 2022-1-31. This presents another complication in the calculation of sustainable yield. The fund also holds a position in SplitShare issues (mainly BNA.PR.C) which also have their yields calculated with the expectation of a maturity at par.

The decline in the calculated sustainable yield is due to a significant shortening of term in the year to date, together with the elimination of expected dividends from the YLO issues – the recent run-up in the prices of longer-term issues has made it prudent to increase the investment in shorter-term, better-credit, lower-yielding FixedResets, although the weighting in this asset class remains well below index levels.

I will no longer show calculations that assume the conversion of the entire portfolio into PerpetualDiscounts, as there are currently only seven such issues of investment grade, from only three issuer groups. Additionally, the fund has now eliminated its holdings of these issues.

Different assumptions lead to different results from the calculation, but the overall positive trend is apparent. I’m very pleased with the results! It will be noted that if there was no trading in the portfolio, one would expect the sustainable yield to be constant (before fees and expenses). The success of the fund’s trading is showing up in

  • the very good performance against the index
  • the long term increases in sustainable income per unit

As has been noted, the fund has maintained a credit quality equal to or better than the index; outperformance is due to constant exploitation of trading anomalies.

Again, there are no predictions for the future! The fund will continue to trade between issues in an attempt to exploit market gaps in liquidity, in an effort to outperform the index and keep the sustainable income per unit – however calculated! – growing.

MAPF Portfolio Composition: February, 2012

March 3rd, 2012

Turnover picked up again in February, to about 20%.

Most of the trading involved shuffling in between DeemedRetractibles, with an overall movement from the lower-coupon GWO issues to their higher-coupon counterparts, GWO.PR.L, GWO.PR.M and GWO.PR.P. Additionally, some trading was done among the SLF issues.

Sectoral distribution of the MAPF portfolio on February 29 was as follows:

MAPF Sectoral Analysis 2012-2-29
HIMI Indices Sector Weighting YTW ModDur
Ratchet 0% N/A N/A
FixFloat 0% N/A N/A
Floater 0% N/A N/A
OpRet 0% N/A N/A
SplitShare 10.2% (+0.2) 5.94% 5.78
Interest Rearing 0% N/A N/A
PerpetualPremium 0.0% (0) N/A N/A
PerpetualDiscount 0.0% (-1.4) N/A N/A
Fixed-Reset 20.3% (+0.9) 2.72% 2.11
Deemed-Retractible 59.7% (+1.2) 5.27% 7.43
Scraps (Various) 9.9% (-0.8) 5.74% (see note) 10.73 (see note)
Cash -0.1% (-0.1) 0.00% 0.00
Total 100% 4.88% 6.52
Yields for the YLO preferreds have been set at 0% for calculation purposes, and their durations at 0.00, to the the company’s decision to suspend preferred dividends.
Totals and changes will not add precisely due to rounding. Bracketted figures represent change from January month-end. Cash is included in totals with duration and yield both equal to zero.
DeemedRetractibles are comprised of all Straight Perpetuals (both PerpetualDiscount and PerpetualPremium) issued by BMO, BNS, CM, ELF, GWO, HSB, IAG, MFC, NA, RY, SLF and TD, which are not exchangable into common at the option of the company. These issues are analyzed as if their prospectuses included a requirement to redeem at par on or prior to 2022-1-31, in addition to the call schedule explicitly defined. See OSFI Does Not Grandfather Extant Tier 1 Capital, CM.PR.D, CM.PR.E, CM.PR.G: NVCC Status Confirmed and the January, February, March and June, 2011, editions of PrefLetter for the rationale behind this analysis.

The “total” reflects the un-leveraged total portfolio (i.e., cash is included in the portfolio calculations and is deemed to have a duration and yield of 0.00.). MAPF will often have relatively large cash balances, both credit and debit, to facilitate trading. Figures presented in the table have been rounded to the indicated precision.

Credit distribution is:

MAPF Credit Analysis 2012-2-29
DBRS Rating Weighting
Pfd-1 0 (0)
Pfd-1(low) 53.9% (+2.2)
Pfd-2(high) 26.1% (-0.1)
Pfd-2 0 (0)
Pfd-2(low) 10.2% (-1.1)
Pfd-3(high) 0.0% (-1.1)
Pfd-3 6.8% (+2.0)
Pfd-4 2.6% (+0.1)
Pfd-4(low) 0.0% (-1.8)
Pfd-5(low) 0.4% (+0.4)
Cash -0.1 (-0.1)
Totals will not add precisely due to rounding. Bracketted figures represent change from January month-end.
A position held in CSE preferreds has been assigned to Pfd-3

Liquidity Distribution is:

MAPF Liquidity Analysis 2012-2-29
Average Daily Trading Weighting
<$50,000 0.0% (-1.2)
$50,000 – $100,000 12.9% (+1.9)
$100,000 – $200,000 34.0% (+0.8)
$200,000 – $300,000 21.3% (-15.5)
>$300,000 32.0% (+14.2)
Cash -0.1 (-0.1)
Totals will not add precisely due to rounding. Bracketted figures represent change from January month-end.

MAPF is, of course, Malachite Aggressive Preferred Fund, a “unit trust” managed by Hymas Investment Management Inc. Further information and links to performance, audited financials and subscription information are available the fund’s web page. The fund may be purchased either directly from Hymas Investment Management or through a brokerage account at Odlum Brown Limited. A “unit trust” is like a regular mutual fund, but is sold by offering memorandum rather than prospectus. This is cheaper, but means subscription is restricted to “accredited investors” (as defined by the Ontario Securities Commission) or those who subscribe for $150,000+. Fund past performances are not a guarantee of future performance. You can lose money investing in MAPF or any other fund.

A similar portfolio composition analysis has been performed on the Claymore Preferred Share ETF (symbol CPD) as of August 31, 2011, and published in the October, 2011, PrefLetter. While direct comparisons are difficult due to the introduction of the DeemedRetractible class of preferred share (see above) it is fair to say:

  • MAPF credit quality is better
  • MAPF liquidity is a higher
  • MAPF Yield is higher
  • Weightings in
    • MAPF is much more exposed to DeemedRetractibles
    • MAPF is much less exposed to Operating Retractibles
    • MAPF is much more exposed to SplitShares
    • MAPF is less exposed to FixFloat / Floater / Ratchet
    • MAPF weighting in FixedResets is much lower

March 2, 2012

March 2nd, 2012

IIROC has repealed the tick-test on short sales, effective 2012-9-1. But fear not, regulation fans! They will also be “enhancing monitoring of short sales and failed trades”, so there will still be plenty of paperwork.

Moody’s cut Greece:

Greece’s credit ratings were cut to “C” by Moody’s Investors Service after it negotiated the biggest sovereign debt restructuring ever.

Moody’s dropped Greece’s rating to the lowest level from Ca, saying in a statement today that investors who participate in the nation’s debt exchange will get about 70 percent less than the face value of their holdings. The deal constitutes “a distressed exchange, and hence a default,” the New York-based rating company said.

It was a relatively uneventful day for the Canadian preferred share market, with PerpetualPremiums unchanged, FixedResets up 9bp and DeemedRetractibles down 4bp; however the Performance Highlights table is fairly lengthy considering the lack of overall movement. Volume was below average – and surprisingly, only one of the recent new issues made the Volume Highlights list.

HIMIPref™ Preferred Indices
These values reflect the December 2008 revision of the HIMIPref™ Indices

Values are provisional and are finalized monthly
Index Mean
Current
Yield
(at bid)
Median
YTW
Median
Average
Trading
Value
Median
Mod Dur
(YTW)
Issues Day’s Perf. Index Value
Ratchet 0.00 % 0.00 % 0 0.00 0 0.7506 % 2,382.3
FixedFloater 4.53 % 3.91 % 39,661 17.45 1 0.0956 % 3,438.8
Floater 3.01 % 3.04 % 50,782 19.56 3 0.7506 % 2,572.3
OpRet 4.87 % 2.83 % 52,352 1.27 6 -0.1906 % 2,513.9
SplitShare 5.27 % -0.93 % 87,183 0.77 4 0.2994 % 2,680.2
Interest-Bearing 0.00 % 0.00 % 0 0.00 0 -0.1906 % 2,298.7
Perpetual-Premium 5.39 % -1.65 % 113,693 0.16 25 0.0008 % 2,218.0
Perpetual-Discount 5.06 % 5.11 % 192,502 15.24 7 -0.2450 % 2,435.5
FixedReset 5.04 % 2.86 % 212,449 2.24 66 0.0872 % 2,389.1
Deemed-Retractible 4.92 % 3.72 % 236,029 2.92 46 -0.0356 % 2,315.7
Performance Highlights
Issue Index Change Notes
IAG.PR.C FixedReset -2.39 % YTW SCENARIO
Maturity Type : Call
Maturity Date : 2013-12-31
Maturity Price : 25.00
Evaluated at bid price : 25.75
Bid-YTW : 4.22 %
IFC.PR.C FixedReset -1.14 % YTW SCENARIO
Maturity Type : Call
Maturity Date : 2016-09-30
Maturity Price : 25.00
Evaluated at bid price : 25.91
Bid-YTW : 3.52 %
BAM.PR.R FixedReset 1.10 % YTW SCENARIO
Maturity Type : Limit Maturity
Maturity Date : 2042-03-02
Maturity Price : 23.66
Evaluated at bid price : 26.62
Bid-YTW : 3.65 %
PWF.PR.P FixedReset 1.13 % YTW SCENARIO
Maturity Type : Limit Maturity
Maturity Date : 2042-03-02
Maturity Price : 23.54
Evaluated at bid price : 25.95
Bid-YTW : 2.94 %
HSE.PR.A FixedReset 1.22 % YTW SCENARIO
Maturity Type : Limit Maturity
Maturity Date : 2042-03-02
Maturity Price : 23.55
Evaluated at bid price : 26.05
Bid-YTW : 3.01 %
MFC.PR.C Deemed-Retractible 1.28 % YTW SCENARIO
Maturity Type : Hard Maturity
Maturity Date : 2022-01-31
Maturity Price : 25.00
Evaluated at bid price : 23.65
Bid-YTW : 5.20 %
BAM.PR.B Floater 1.33 % YTW SCENARIO
Maturity Type : Limit Maturity
Maturity Date : 2042-03-02
Maturity Price : 17.54
Evaluated at bid price : 17.54
Bid-YTW : 3.02 %
BAM.PR.X FixedReset 1.85 % YTW SCENARIO
Maturity Type : Limit Maturity
Maturity Date : 2042-03-02
Maturity Price : 23.24
Evaluated at bid price : 25.31
Bid-YTW : 3.38 %
Volume Highlights
Issue Index Shares
Traded
Notes
BMO.PR.P FixedReset 174,753 TD crossed blocks of 25,000 shares, 50,000 and 59,300, all at 26.87. RBC crossed 25,000 at the same price.
YTW SCENARIO
Maturity Type : Call
Maturity Date : 2015-02-25
Maturity Price : 25.00
Evaluated at bid price : 26.87
Bid-YTW : 2.82 %
BMO.PR.K Deemed-Retractible 81,555 RBC crossed 35,000 at 26.54.
YTW SCENARIO
Maturity Type : Call
Maturity Date : 2012-11-25
Maturity Price : 26.00
Evaluated at bid price : 26.51
Bid-YTW : 2.48 %
SLF.PR.F FixedReset 78,035 RBC crossed blocks of 35,800 and 13,900, both at 26.60. Desjardins crossed 25,000 at the same price.
YTW SCENARIO
Maturity Type : Call
Maturity Date : 2014-06-30
Maturity Price : 25.00
Evaluated at bid price : 26.64
Bid-YTW : 3.52 %
POW.PR.G Perpetual-Premium 65,602 Recent new issue.
YTW SCENARIO
Maturity Type : Call
Maturity Date : 2021-04-15
Maturity Price : 25.00
Evaluated at bid price : 25.75
Bid-YTW : 5.22 %
BMO.PR.J Deemed-Retractible 30,590 YTW SCENARIO
Maturity Type : Call
Maturity Date : 2016-02-25
Maturity Price : 25.00
Evaluated at bid price : 25.76
Bid-YTW : 3.72 %
BAM.PR.H OpRet 27,797 TD crossed 12,300 at 25.35.
YTW SCENARIO
Maturity Type : Option Certainty
Maturity Date : 2012-04-01
Maturity Price : 25.00
Evaluated at bid price : 25.36
Bid-YTW : -0.03 %
There were 25 other index-included issues trading in excess of 10,000 shares.
Wide Spread Highlights
Issue Index Quote Data and Yield Notes
IGM.PR.B Perpetual-Premium Quote: 26.95 – 27.30
Spot Rate : 0.3500
Average : 0.2314

YTW SCENARIO
Maturity Type : Call
Maturity Date : 2014-12-31
Maturity Price : 26.00
Evaluated at bid price : 26.95
Bid-YTW : 4.50 %

TCA.PR.Y Perpetual-Premium Quote: 52.27 – 52.65
Spot Rate : 0.3800
Average : 0.2963

YTW SCENARIO
Maturity Type : Call
Maturity Date : 2014-03-05
Maturity Price : 50.00
Evaluated at bid price : 52.27
Bid-YTW : 3.50 %

MFC.PR.B Deemed-Retractible Quote: 23.78 – 24.13
Spot Rate : 0.3500
Average : 0.2732

YTW SCENARIO
Maturity Type : Hard Maturity
Maturity Date : 2022-01-31
Maturity Price : 25.00
Evaluated at bid price : 23.78
Bid-YTW : 5.29 %

GWO.PR.I Deemed-Retractible Quote: 24.21 – 24.48
Spot Rate : 0.2700
Average : 0.1946

YTW SCENARIO
Maturity Type : Hard Maturity
Maturity Date : 2022-01-31
Maturity Price : 25.00
Evaluated at bid price : 24.21
Bid-YTW : 4.89 %

PWF.PR.H Perpetual-Premium Quote: 25.51 – 25.79
Spot Rate : 0.2800
Average : 0.2092

YTW SCENARIO
Maturity Type : Call
Maturity Date : 2012-04-01
Maturity Price : 25.00
Evaluated at bid price : 25.51
Bid-YTW : -12.72 %

NA.PR.M Deemed-Retractible Quote: 27.05 – 27.33
Spot Rate : 0.2800
Average : 0.2126

YTW SCENARIO
Maturity Type : Call
Maturity Date : 2013-05-15
Maturity Price : 26.00
Evaluated at bid price : 27.05
Bid-YTW : 2.56 %

March 1, 2012

March 2nd, 2012

I found this ISDA ruling rather odd:

Default insurance on Greek debt won’t be paid out even after the nation negotiated the biggest sovereign-debt restructuring in history, the International Swaps & Derivatives Association ruled today.

The ECB’s exchange of Greek bonds for new securities that are exempt from losses being imposed on private investors hasn’t triggered $3.25 billion of outstanding credit-default swaps. ISDA’s determinations committee said the switch didn’t constitute subordination, one of the criteria for a payout under a restructuring credit event.

But actual implementation of (what I consider) the subordination may trigger payouts:

“The situation in the Hellenic Republic is still evolving” and today’s decisions “do not affect the right or ability to submit further questions,” ISDA said in a statement. The decision is not an expression of the committee’s “view as to whether a credit event could occur at a later date,” the association said.

A swaps payout may still happen if Greece uses collective action clauses on private investors who refuse to take so-called haircuts on their debt holdings, according to ISDA’s rules. Officials including former ECB President Jean-Claude Trichet have opposed triggering swaps because they’re concerned traders would be encouraged to bet against failing nations and worsen Europe’s debt crisis.

It costs $7.3 million in advance and $100,000 annually to insure $10 million of Greek debt for five years, signaling a 95 percent probability of default within that time. Greek 10-year bonds slumped to a record 19.14 cents on the euro after the ruling.

While Greece is negotiating the biggest ever debt restructuring, the volume of credit-default swaps on the line has tumbled. The net amount of debt protected is no more than for some companies and represents less than one percent of the nation’s bonds and loans outstanding.

Credit-default swaps on Greece now cover $3.25 billion of debt, down from about $6 billion last year, according to the Depository Trust & Clearing Corp. That compares with a swaps settlement of $5.2 billion on Lehman Brothers Holdings Inc. in 2008.

Leave it to the banks to find a cross-selling opportunity!

We all know economic times have been tough. But if you happen to have an extra $25 million that you are willing to let JPMorgan Chase manage for you, there is at least one perk you can expect to receive that you won’t find anywhere else: The J.P. Morgan Palladium Card.

The card has been around for three years — although us hoi polloi wouldn’t know it — and a couple thousand have been issued. The card itself is actually made with palladium and 23-karat gold — reportedly putting its cost in materials alone at about $1,000 — giving it real heft when you hold it in your hand. It was also the first U.S. card with a smart chip on the front, making it a breeze for international travel (swipe technology is so passé abroad), along with some form of J.P. Morgan’s (the man’s) signature embossed on the front and your own signature embossed on the back.

And, on another light note, this report has been highlighted by PrefBlog’s Stereotypes Exist for a Reason! Department:

Which sites Canadians visited depended largely on their household incomes.

Those with a household income above $60,000 spent more time on sites dedicated to politics, education, online trading, books and business news. Those under that threshold? Their focus is on sites about dating, travel, gambling, music and cars.

Visits to pornographic websites were not included in the report.

March came in like a lion for the Canadian preferred share market, with PerpetualPremiums up 28bp, FixedResets up 21bp and DeemedRetractibles winning 35bp. All entries on the Performance Highlights table are winners. Volume was on the low side of average.

HIMIPref™ Preferred Indices
These values reflect the December 2008 revision of the HIMIPref™ Indices

Values are provisional and are finalized monthly
Index Mean
Current
Yield
(at bid)
Median
YTW
Median
Average
Trading
Value
Median
Mod Dur
(YTW)
Issues Day’s Perf. Index Value
Ratchet 0.00 % 0.00 % 0 0.00 0 0.6197 % 2,364.6
FixedFloater 4.54 % 3.91 % 39,945 17.44 1 -0.3333 % 3,435.5
Floater 3.03 % 3.06 % 51,333 19.51 3 0.6197 % 2,553.1
OpRet 4.86 % 2.69 % 52,786 1.22 6 0.1591 % 2,518.7
SplitShare 5.29 % 0.06 % 87,840 0.77 4 0.3505 % 2,672.2
Interest-Bearing 0.00 % 0.00 % 0 0.00 0 0.1591 % 2,303.1
Perpetual-Premium 5.39 % -0.40 % 112,242 0.17 25 0.2808 % 2,218.0
Perpetual-Discount 5.05 % 5.07 % 195,142 15.30 7 0.3865 % 2,441.4
FixedReset 5.04 % 2.83 % 215,285 2.24 66 0.2121 % 2,387.0
Deemed-Retractible 4.91 % 3.65 % 238,273 2.62 46 0.3468 % 2,316.5
Performance Highlights
Issue Index Change Notes
SLF.PR.H FixedReset 1.01 % YTW SCENARIO
Maturity Type : Hard Maturity
Maturity Date : 2022-01-31
Maturity Price : 25.00
Evaluated at bid price : 24.06
Bid-YTW : 4.29 %
BNS.PR.J Deemed-Retractible 1.08 % YTW SCENARIO
Maturity Type : Call
Maturity Date : 2013-10-29
Maturity Price : 25.00
Evaluated at bid price : 26.30
Bid-YTW : 2.32 %
RY.PR.H Deemed-Retractible 1.23 % YTW SCENARIO
Maturity Type : Call
Maturity Date : 2013-05-24
Maturity Price : 26.00
Evaluated at bid price : 27.16
Bid-YTW : 1.82 %
PWF.PR.O Perpetual-Premium 1.41 % YTW SCENARIO
Maturity Type : Call
Maturity Date : 2018-10-31
Maturity Price : 25.00
Evaluated at bid price : 26.61
Bid-YTW : 4.78 %
BAM.PR.K Floater 1.69 % YTW SCENARIO
Maturity Type : Limit Maturity
Maturity Date : 2042-03-01
Maturity Price : 17.40
Evaluated at bid price : 17.40
Bid-YTW : 3.04 %
IFC.PR.C FixedReset 1.75 % YTW SCENARIO
Maturity Type : Call
Maturity Date : 2016-09-30
Maturity Price : 25.00
Evaluated at bid price : 26.21
Bid-YTW : 3.24 %
SLF.PR.G FixedReset 2.18 % YTW SCENARIO
Maturity Type : Hard Maturity
Maturity Date : 2022-01-31
Maturity Price : 25.00
Evaluated at bid price : 24.36
Bid-YTW : 3.76 %
Volume Highlights
Issue Index Shares
Traded
Notes
MFC.PR.D FixedReset 98,271 Nesbitt sold 20,700 to RBC at 26.70, then crossed 40,000 at the same price. RBC crossed blocks of 12,000 at 26.87 and 12,100 at 26.90.
YTW SCENARIO
Maturity Type : Call
Maturity Date : 2014-06-19
Maturity Price : 25.00
Evaluated at bid price : 26.63
Bid-YTW : 3.51 %
GWO.PR.P Deemed-Retractible 91,021 Recent new issue.
YTW SCENARIO
Maturity Type : Hard Maturity
Maturity Date : 2022-01-31
Maturity Price : 25.00
Evaluated at bid price : 25.80
Bid-YTW : 5.03 %
POW.PR.G Perpetual-Premium 75,845 Recent new issue.
YTW SCENARIO
Maturity Type : Call
Maturity Date : 2021-04-15
Maturity Price : 25.00
Evaluated at bid price : 25.70
Bid-YTW : 5.25 %
PWF.PR.R Perpetual-Premium 70,066 Recent new issue.
YTW SCENARIO
Maturity Type : Call
Maturity Date : 2021-04-30
Maturity Price : 25.00
Evaluated at bid price : 25.70
Bid-YTW : 5.16 %
BMO.PR.J Deemed-Retractible 30,399 Desjardins crossed 11,000 at 25.70.
YTW SCENARIO
Maturity Type : Call
Maturity Date : 2016-02-25
Maturity Price : 25.00
Evaluated at bid price : 25.77
Bid-YTW : 3.70 %
CM.PR.J Deemed-Retractible 27,711 Desjardins crossed 16,000 at 26.12.
YTW SCENARIO
Maturity Type : Call
Maturity Date : 2015-04-30
Maturity Price : 25.25
Evaluated at bid price : 26.06
Bid-YTW : 3.51 %
There were 29 other index-included issues trading in excess of 10,000 shares.
Wide Spread Highlights
Issue Index Quote Data and Yield Notes
MFC.PR.D FixedReset Quote: 26.63 – 26.99
Spot Rate : 0.3600
Average : 0.1977

YTW SCENARIO
Maturity Type : Call
Maturity Date : 2014-06-19
Maturity Price : 25.00
Evaluated at bid price : 26.63
Bid-YTW : 3.51 %

BAM.PR.X FixedReset Quote: 24.85 – 25.20
Spot Rate : 0.3500
Average : 0.2561

YTW SCENARIO
Maturity Type : Limit Maturity
Maturity Date : 2042-03-01
Maturity Price : 23.09
Evaluated at bid price : 24.85
Bid-YTW : 3.47 %

PWF.PR.O Perpetual-Premium Quote: 26.61 – 26.85
Spot Rate : 0.2400
Average : 0.1676

YTW SCENARIO
Maturity Type : Call
Maturity Date : 2018-10-31
Maturity Price : 25.00
Evaluated at bid price : 26.61
Bid-YTW : 4.78 %

FTS.PR.H FixedReset Quote: 25.64 – 26.00
Spot Rate : 0.3600
Average : 0.2901

YTW SCENARIO
Maturity Type : Limit Maturity
Maturity Date : 2042-03-01
Maturity Price : 23.55
Evaluated at bid price : 25.64
Bid-YTW : 2.79 %

RY.PR.T FixedReset Quote: 27.15 – 27.35
Spot Rate : 0.2000
Average : 0.1350

YTW SCENARIO
Maturity Type : Call
Maturity Date : 2014-08-24
Maturity Price : 25.00
Evaluated at bid price : 27.15
Bid-YTW : 2.72 %

NA.PR.M Deemed-Retractible Quote: 27.15 – 27.35
Spot Rate : 0.2000
Average : 0.1388

YTW SCENARIO
Maturity Type : Call
Maturity Date : 2013-05-15
Maturity Price : 26.00
Evaluated at bid price : 27.15
Bid-YTW : 2.23 %

BPO.PR.I To Be Redeemed

March 1st, 2012

Brookfield Office Properties has announced:

that that it intends to redeem all of its outstanding Class AAA Preference Shares, Series I (the “Series I Shares”) on March 30, 2012. The Redemption Price will be C$25.00 per Series I Share.

There are currently 6,138,022 outstanding Series I Shares, which are listed on the Toronto Stock Exchange under the symbol BPO.PR.I. All of the Series I Shares are held beneficially through CDS & Co., as nominee of CDS Clearing and Depositary Services Inc.

Notice of Redemption has been sent to CDS & Co. Payment of the Redemption Price will be made to all beneficial holders of the Series I Shares on or after March 30, 2012 through the facilities of CDS & Co.

BPO.PR.I is an interesting issue, since (as discussed in the post BPO.PR.I: What is the Meaning of Existence?), it has been both redeemable and retractible at par for quite some time … but both the issuer and the holders have been perfectly content to let it trade. BPO.PR.I is tracked by HIMIPref™ but has been relegated to the Scraps index on credit concerns.

February 29, 2012

March 1st, 2012

This is US data, but more evidence that the western world is regulating itself to death:

Consumers pay about 21 percent more in fees for basic checking accounts than they did six years ago, according to a study released today.

An average consumer may pay about $7.72 a month in a combination of monthly and automated teller machine fees this year compared with about $6.36 in 2006, according to the study by Pleasanton, California-based Javelin Strategy & Research, which looked at fees on basic checking accounts offered by 30 financial institutions.

Fees have increased as regulations have curtailed some of banks’ related revenue sources, Javelin said. Rules requiring banks to get consumers’ consent for overdraft protection, and limiting what banks may charge merchants on debit transactions, have cost the industry about $12.2 billion annually, according to the study.

It was a good solid day for the Canadian preferred share market, with PerpetualPremiums gaining 10bp, FixedResets up 4bp and DeemedRetractibles winning 24bp. Good volatility, with Floaters notable among the losers and SLF dominating the winners. Volume was average.

HIMIPref™ Preferred Indices
These values reflect the December 2008 revision of the HIMIPref™ Indices

Values are provisional and are finalized monthly
Index Mean
Current
Yield
(at bid)
Median
YTW
Median
Average
Trading
Value
Median
Mod Dur
(YTW)
Issues Day’s Perf. Index Value
Ratchet 0.00 % 0.00 % 0 0.00 0 -1.6149 % 2,350.0
FixedFloater 4.52 % 3.90 % 38,323 17.47 1 0.0000 % 3,447.0
Floater 2.84 % 3.05 % 53,316 19.55 3 -1.6149 % 2,537.4
OpRet 4.87 % 2.84 % 54,528 1.28 6 0.4602 % 2,514.7
SplitShare 5.31 % 0.30 % 88,160 0.78 4 0.0651 % 2,662.8
Interest-Bearing 0.00 % 0.00 % 0 0.00 0 0.4602 % 2,299.5
Perpetual-Premium 5.37 % 2.84 % 114,763 0.17 28 0.1000 % 2,211.7
Perpetual-Discount 5.08 % 4.98 % 196,824 15.43 4 -0.0728 % 2,432.0
FixedReset 5.05 % 2.84 % 213,914 2.31 66 0.0362 % 2,382.0
Deemed-Retractible 4.93 % 3.80 % 239,858 2.93 46 0.2410 % 2,308.5
Performance Highlights
Issue Index Change Notes
PWF.PR.A Floater -3.68 % YTW SCENARIO
Maturity Type : Limit Maturity
Maturity Date : 2042-03-01
Maturity Price : 20.95
Evaluated at bid price : 20.95
Bid-YTW : 2.52 %
IAG.PR.A Deemed-Retractible -1.69 % YTW SCENARIO
Maturity Type : Hard Maturity
Maturity Date : 2022-01-31
Maturity Price : 25.00
Evaluated at bid price : 23.27
Bid-YTW : 5.49 %
BAM.PR.X FixedReset -1.23 % YTW SCENARIO
Maturity Type : Limit Maturity
Maturity Date : 2042-03-01
Maturity Price : 23.07
Evaluated at bid price : 24.80
Bid-YTW : 3.48 %
BAM.PR.K Floater -1.10 % YTW SCENARIO
Maturity Type : Limit Maturity
Maturity Date : 2042-03-01
Maturity Price : 17.11
Evaluated at bid price : 17.11
Bid-YTW : 3.10 %
IAG.PR.E Deemed-Retractible -1.09 % YTW SCENARIO
Maturity Type : Call
Maturity Date : 2014-12-31
Maturity Price : 26.00
Evaluated at bid price : 26.26
Bid-YTW : 5.23 %
SLF.PR.B Deemed-Retractible 1.04 % YTW SCENARIO
Maturity Type : Hard Maturity
Maturity Date : 2022-01-31
Maturity Price : 25.00
Evaluated at bid price : 24.20
Bid-YTW : 5.35 %
BAM.PR.J OpRet 1.15 % YTW SCENARIO
Maturity Type : Call
Maturity Date : 2014-03-31
Maturity Price : 26.00
Evaluated at bid price : 27.30
Bid-YTW : 3.13 %
GWO.PR.M Deemed-Retractible 1.22 % YTW SCENARIO
Maturity Type : Call
Maturity Date : 2015-03-31
Maturity Price : 26.00
Evaluated at bid price : 26.33
Bid-YTW : 4.99 %
SLF.PR.A Deemed-Retractible 1.46 % YTW SCENARIO
Maturity Type : Hard Maturity
Maturity Date : 2022-01-31
Maturity Price : 25.00
Evaluated at bid price : 24.26
Bid-YTW : 5.27 %
SLF.PR.D Deemed-Retractible 1.61 % YTW SCENARIO
Maturity Type : Hard Maturity
Maturity Date : 2022-01-31
Maturity Price : 25.00
Evaluated at bid price : 23.37
Bid-YTW : 5.43 %
FTS.PR.E OpRet 1.68 % YTW SCENARIO
Maturity Type : Call
Maturity Date : 2013-06-01
Maturity Price : 25.75
Evaluated at bid price : 27.20
Bid-YTW : 0.25 %
SLF.PR.E Deemed-Retractible 1.69 % YTW SCENARIO
Maturity Type : Hard Maturity
Maturity Date : 2022-01-31
Maturity Price : 25.00
Evaluated at bid price : 23.50
Bid-YTW : 5.42 %
SLF.PR.C Deemed-Retractible 1.74 % YTW SCENARIO
Maturity Type : Hard Maturity
Maturity Date : 2022-01-31
Maturity Price : 25.00
Evaluated at bid price : 23.41
Bid-YTW : 5.41 %
Volume Highlights
Issue Index Shares
Traded
Notes
PWF.PR.R Perpetual-Premium 147,851 Recent new issue.
YTW SCENARIO
Maturity Type : Call
Maturity Date : 2021-04-30
Maturity Price : 25.00
Evaluated at bid price : 25.57
Bid-YTW : 5.23 %
POW.PR.G Perpetual-Premium 140,285 Recent new issue.
YTW SCENARIO
Maturity Type : Call
Maturity Date : 2021-04-15
Maturity Price : 25.00
Evaluated at bid price : 25.65
Bid-YTW : 5.28 %
BNS.PR.Z FixedReset 139,079 RBC crossed 99,900 at 25.16.
YTW SCENARIO
Maturity Type : Hard Maturity
Maturity Date : 2022-01-31
Maturity Price : 25.00
Evaluated at bid price : 25.16
Bid-YTW : 3.10 %
BNS.PR.M Deemed-Retractible 97,742 RBC crossed 50,000 at 25.75.
YTW SCENARIO
Maturity Type : Call
Maturity Date : 2016-07-27
Maturity Price : 25.00
Evaluated at bid price : 25.74
Bid-YTW : 3.87 %
PWF.PR.M FixedReset 54,350 Nesbitt crossed 50,000 at 26.44.
YTW SCENARIO
Maturity Type : Call
Maturity Date : 2014-01-31
Maturity Price : 25.00
Evaluated at bid price : 26.41
Bid-YTW : 3.22 %
RY.PR.L FixedReset 42,400 Desjardins crossed 38,200 at 26.40.
YTW SCENARIO
Maturity Type : Call
Maturity Date : 2014-02-24
Maturity Price : 25.00
Evaluated at bid price : 26.50
Bid-YTW : 2.54 %
There were 33 other index-included issues trading in excess of 10,000 shares.
Wide Spread Highlights
Issue Index Quote Data and Yield Notes
BAM.PR.G FixedFloater Quote: 21.00 – 24.00
Spot Rate : 3.0000
Average : 1.6553

YTW SCENARIO
Maturity Type : Limit Maturity
Maturity Date : 2042-03-01
Maturity Price : 21.80
Evaluated at bid price : 21.00
Bid-YTW : 3.90 %

PWF.PR.A Floater Quote: 20.95 – 22.00
Spot Rate : 1.0500
Average : 0.7450

YTW SCENARIO
Maturity Type : Limit Maturity
Maturity Date : 2042-03-01
Maturity Price : 20.95
Evaluated at bid price : 20.95
Bid-YTW : 2.52 %

IAG.PR.A Deemed-Retractible Quote: 23.27 – 24.00
Spot Rate : 0.7300
Average : 0.5207

YTW SCENARIO
Maturity Type : Hard Maturity
Maturity Date : 2022-01-31
Maturity Price : 25.00
Evaluated at bid price : 23.27
Bid-YTW : 5.49 %

GWO.PR.N FixedReset Quote: 24.39 – 24.80
Spot Rate : 0.4100
Average : 0.2517

YTW SCENARIO
Maturity Type : Hard Maturity
Maturity Date : 2022-01-31
Maturity Price : 25.00
Evaluated at bid price : 24.39
Bid-YTW : 3.33 %

TCA.PR.X Perpetual-Premium Quote: 52.30 – 52.80
Spot Rate : 0.5000
Average : 0.3728

YTW SCENARIO
Maturity Type : Call
Maturity Date : 2013-10-15
Maturity Price : 50.00
Evaluated at bid price : 52.30
Bid-YTW : 2.98 %

ELF.PR.G Perpetual-Discount Quote: 23.05 – 23.45
Spot Rate : 0.4000
Average : 0.2851

YTW SCENARIO
Maturity Type : Limit Maturity
Maturity Date : 2042-03-01
Maturity Price : 22.64
Evaluated at bid price : 23.05
Bid-YTW : 5.20 %

ABK.PR.B: Partial Call for Redemption

February 29th, 2012

Scotia Managed Companies has announced:

Allbanc Split Corp. (the “Company”) announced today that it has called 239,120 Preferred Shares for cash redemption on March 9, 2012 (in accordance with the Company’s Articles) representing approximately 24.893% of the outstanding Preferred Shares as a result of the special annual retraction of 239,120 Capital Shares by the holders thereof. The Preferred Shares shall be redeemed on a pro rata basis, so that each holder of Preferred Shares of record on March 7, 2012 will have approximately 24.893% of their Preferred Shares redeemed. The redemption price for the Preferred Shares will be $26.75 per share.

In addition, holders of a further 284,500 Capital Shares and 284,500 Preferred Shares have deposited such shares concurrently for retraction on March 9, 2012. As a result, a total of 523,620 Capital Shares and 523,620 Preferred Shares, or approximately 42.05499% of both classes of shares currently outstanding, will be redeemed.

Holders of Preferred Shares that are on record for dividends but have been called for redemption will be entitled to receive dividends thereon which have been declared but remain unpaid up to but not including March 9, 2012.

Payment of the amount due to holders of Preferred Shares will be made by the Company on March 9, 2012. From and after March 9, 2012 the holders of Preferred Shares that have been called for redemption will not be entitled to dividends or to exercise any right in respect of such shares except to receive the amount due on redemption.

Allbanc Split Corp. is a mutual fund Corporation created to hold a portfolio of publicly listed common shares of selected Canadian chartered banks. Class A Capital Shares and Class B Preferred Shares of Allbanc Split Corp. are listed for trading on The Toronto Stock Exchange under the symbols ABK.A and ABK.PR.B respectively.

ABK.PR.B was last mentioned on PrefBlog on February 27, when DBRS confirmed their credit rating. ABK.PR.B is not tracked by HIMIPref™.

February 28, 2012

February 29th, 2012

I could not agree more with Stephen Gordon’s Ode to a High Exchange Rate:

Exports are costs. The goal of international trade is to import goods and services; exports are the price we pay in return. If a higher exchange rate allows Ontario to import more and export less, Ontarians are better off.

I’m perpetually astonished by political attitudes towards exchange rates and dumping. If some foreigner wants to sell me something cheap, I tell ’em “Fine! Back up the truck!”

There’s some interesting colour regarding pain in pension land:

General Electric Co. (GE), Boeing Co. (BA) and 3M Co. (MMM) will join big U.S. employers in making a record $100 billion in 2012 pension contributions, 67 percent more than two years ago, as low interest rates boost companies’ liabilities.

Payments may total $400 billion from 2011 through 2015 to ease underfunding at the 100 largest defined-benefit programs, according to consultant Milliman Inc., which estimated that assets in January were enough to cover less than three-fourths of projected payouts.

There was an excellent result in the latest Vikings vs. Pirates match:

The navy said its ship, the Absalon, had been tracking the pirate vessel for several days near the Somali coast. As the pirate ship tried to leave the coast, the warship called on it to stop, firing warning shots. When the pirate ship didn’t respond, the Danish warship opened fire, according to the statement. The vessel had been used as a base by the pirates for attacks in the region, the navy said.

The only thing I don’t understand is: why did they bother tracking it for several days? I hope this was for intelligence-gathering purposes, because ideally it would have been blown out of the water on sight.

It was another good day for the Canadian preferred share market, with PerpetualPremiums winning 17bp, FixedResets flat and DeemedRetractibles gaining 15bp. The good sized Performance Highlights table is highly skewed to the upside. Volume was below average.

HIMIPref™ Preferred Indices
These values reflect the December 2008 revision of the HIMIPref™ Indices

Values are provisional and are finalized monthly
Index Mean
Current
Yield
(at bid)
Median
YTW
Median
Average
Trading
Value
Median
Mod Dur
(YTW)
Issues Day’s Perf. Index Value
Ratchet 0.00 % 0.00 % 0 0.00 0 0.2134 % 2,388.6
FixedFloater 4.52 % 3.90 % 38,303 17.47 1 -0.4739 % 3,447.0
Floater 2.80 % 3.06 % 55,420 19.51 3 0.2134 % 2,579.0
OpRet 4.89 % 2.84 % 56,779 1.28 6 0.1665 % 2,503.2
SplitShare 5.31 % 0.18 % 85,942 0.78 4 -0.4688 % 2,661.1
Interest-Bearing 0.00 % 0.00 % 0 0.00 0 0.1665 % 2,288.9
Perpetual-Premium 5.38 % 2.11 % 115,902 0.17 28 0.1713 % 2,209.5
Perpetual-Discount 5.08 % 4.96 % 197,117 15.45 4 0.3441 % 2,433.8
FixedReset 5.05 % 2.85 % 205,586 2.27 66 -0.0017 % 2,381.1
Deemed-Retractible 4.94 % 3.83 % 239,222 2.94 46 0.1465 % 2,303.0
Performance Highlights
Issue Index Change Notes
FBS.PR.C SplitShare -1.32 % YTW SCENARIO
Maturity Type : Call
Maturity Date : 2012-12-15
Maturity Price : 10.00
Evaluated at bid price : 10.46
Bid-YTW : 0.18 %
SLF.PR.H FixedReset 1.05 % YTW SCENARIO
Maturity Type : Hard Maturity
Maturity Date : 2022-01-31
Maturity Price : 25.00
Evaluated at bid price : 24.05
Bid-YTW : 4.29 %
BAM.PR.K Floater 1.05 % YTW SCENARIO
Maturity Type : Limit Maturity
Maturity Date : 2042-02-28
Maturity Price : 17.30
Evaluated at bid price : 17.30
Bid-YTW : 3.06 %
IAG.PR.E Deemed-Retractible 1.10 % YTW SCENARIO
Maturity Type : Call
Maturity Date : 2014-12-31
Maturity Price : 26.00
Evaluated at bid price : 26.55
Bid-YTW : 4.80 %
ELF.PR.F Perpetual-Discount 1.19 % YTW SCENARIO
Maturity Type : Limit Maturity
Maturity Date : 2042-02-28
Maturity Price : 24.52
Evaluated at bid price : 24.76
Bid-YTW : 5.42 %
SLF.PR.G FixedReset 1.45 % YTW SCENARIO
Maturity Type : Hard Maturity
Maturity Date : 2022-01-31
Maturity Price : 25.00
Evaluated at bid price : 23.76
Bid-YTW : 4.06 %
IAG.PR.A Deemed-Retractible 1.59 % YTW SCENARIO
Maturity Type : Hard Maturity
Maturity Date : 2022-01-31
Maturity Price : 25.00
Evaluated at bid price : 23.67
Bid-YTW : 5.27 %
FTS.PR.E OpRet 2.14 % YTW SCENARIO
Maturity Type : Call
Maturity Date : 2013-06-01
Maturity Price : 25.75
Evaluated at bid price : 26.75
Bid-YTW : 1.61 %
Volume Highlights
Issue Index Shares
Traded
Notes
POW.PR.G Perpetual-Premium 594,733 New issue settled today.
YTW SCENARIO
Maturity Type : Call
Maturity Date : 2021-04-15
Maturity Price : 25.00
Evaluated at bid price : 25.47
Bid-YTW : 5.37 %
RY.PR.E Deemed-Retractible 90,883 TD crossed 50,000 at 25.70; Desjardins crossed 30,000 at the same price.
YTW SCENARIO
Maturity Type : Call
Maturity Date : 2016-02-24
Maturity Price : 25.00
Evaluated at bid price : 25.70
Bid-YTW : 3.77 %
PWF.PR.I Perpetual-Premium 80,252 Desjardins crossed blocks of 40,000 shares, 10,000 and 15,000, all at 25.55.
YTW SCENARIO
Maturity Type : Call
Maturity Date : 2012-03-29
Maturity Price : 25.25
Evaluated at bid price : 25.60
Bid-YTW : -5.45 %
PWF.PR.R Perpetual-Premium 65,525 Recent new issue.
YTW SCENARIO
Maturity Type : Call
Maturity Date : 2021-04-30
Maturity Price : 25.00
Evaluated at bid price : 25.45
Bid-YTW : 5.30 %
TD.PR.S FixedReset 58,729 RBC crossed 56,800 at 25.85.
YTW SCENARIO
Maturity Type : Call
Maturity Date : 2013-07-31
Maturity Price : 25.00
Evaluated at bid price : 25.83
Bid-YTW : 2.90 %
TD.PR.G FixedReset 55,690 RBC crossed 49,000 at 27.05.
YTW SCENARIO
Maturity Type : Call
Maturity Date : 2014-04-30
Maturity Price : 25.00
Evaluated at bid price : 27.04
Bid-YTW : 2.59 %
There were 26 other index-included issues trading in excess of 10,000 shares.
Wide Spread Highlights
Issue Index Quote Data and Yield Notes
IAG.PR.F Deemed-Retractible Quote: 26.10 – 26.58
Spot Rate : 0.4800
Average : 0.3670

YTW SCENARIO
Maturity Type : Hard Maturity
Maturity Date : 2022-01-31
Maturity Price : 25.00
Evaluated at bid price : 26.10
Bid-YTW : 5.29 %

BAM.PR.J OpRet Quote: 26.99 – 27.53
Spot Rate : 0.5400
Average : 0.4277

YTW SCENARIO
Maturity Type : Call
Maturity Date : 2014-03-31
Maturity Price : 26.00
Evaluated at bid price : 26.99
Bid-YTW : 3.71 %

GWO.PR.G Deemed-Retractible Quote: 25.62 – 25.95
Spot Rate : 0.3300
Average : 0.2555

YTW SCENARIO
Maturity Type : Call
Maturity Date : 2013-12-31
Maturity Price : 25.00
Evaluated at bid price : 25.62
Bid-YTW : 4.28 %

RY.PR.B Deemed-Retractible Quote: 25.82 – 25.98
Spot Rate : 0.1600
Average : 0.0926

YTW SCENARIO
Maturity Type : Call
Maturity Date : 2015-08-24
Maturity Price : 25.00
Evaluated at bid price : 25.82
Bid-YTW : 3.73 %

BNS.PR.Q FixedReset Quote: 25.91 – 26.09
Spot Rate : 0.1800
Average : 0.1249

YTW SCENARIO
Maturity Type : Call
Maturity Date : 2013-10-25
Maturity Price : 25.00
Evaluated at bid price : 25.91
Bid-YTW : 2.99 %

BAM.PR.R FixedReset Quote: 26.40 – 26.65
Spot Rate : 0.2500
Average : 0.1954

YTW SCENARIO
Maturity Type : Limit Maturity
Maturity Date : 2042-02-28
Maturity Price : 23.61
Evaluated at bid price : 26.40
Bid-YTW : 3.69 %