Flash Crash: Incompetence, Position Limits, Retail

October 1st, 2010

The SEC & CFTC have released the FINDINGS REGARDING THE MARKET EVENTS OF MAY 6, 2010:

At 2:32 p.m., against this backdrop of unusually high volatility and thinning liquidity, a large fundamental5 trader (a mutual fund complex) initiated a sell program to sell a total of 75,000 E-Mini contracts (valued at approximately $4.1 billion) as a hedge to an existing equity position.

This large fundamental trader chose to execute this sell program via an automated execution algorithm (“Sell Algorithm”) that was programmed to feed orders into the June 2010 E-Mini market to target an execution rate set to 9% of the trading volume calculated over the previous minute, but without regard to price or time.

As noted by Bloomberg, the identity of the seller is no mystery:

While the report doesn’t name the seller, two people with knowledge of the findings said it was Waddell & Reed Financial Inc. The mutual-fund company’s action may not have caused a crash if there weren’t already concern in the market about the European debt crisis, the people said.

“When you don’t put a limit price on orders, that’s what can happen,” said Paul Zubulake, senior analyst at Boston-based research firm Aite Group LLC. “This is not a manipulation or an algorithm that ran amok. It was told to be aggressive and not use a price. The market-making community actually absorbed a lot of the selling, but then they had to hedge their own risk.”

According to a recent press release:

At June 30, 2010, the company had approximately $68 billion in total assets under management.

So my questions for Waddel Reed are:

  • Why is the sale of $4.1-bilion (about 6% of AUM) in securities a binary decision?
  • Why are you putting in market orders for $4.1-billion?
  • Is there anybody there with any brains at all?

So this is simply the old market-impact costs rigamarole writ large: Bozo Trader wakes up one morning, finds his big toe hurts and concludes that he should sell X and buy Y. At the market! No further analysis needed.

Back to the report. Amusingly:

However, on May 6, when markets were already under stress, the Sell Algorithm chosen by the large trader to only target trading volume, and neither price nor time, executed the sell program extremely rapidly in just 20 minutes.(footnote)

Footnote: At a later date, the large fundamental trader executed trades over the course of more than 6 hours to offset the net short position accumulated on May 6.

I guess his big toe wasn’t hurting the following week. Still, from a market perspective, I think it’s pretty impressive that the market was able to absorb that much selling while limiting the market impact to what was actually experienced.

HFTs and intermediaries were the likely buyers of the initial batch of orders submitted by the Sell Algorithm, and, as a result, these buyers built up temporary long positions. Specifically, HFTs accumulated a net long position of about 3,300 contracts. However, between 2:41 p.m. and 2:44 p.m., HFTs aggressively sold about 2,000 E-Mini contracts in order to reduce their temporary long positions. At the same time, HFTs traded nearly 140,000 E-Mini contracts or over 33% of the total trading volume. This is consistent with the HFTs’ typical practice of trading a very large number of contracts, but not accumulating an aggregate inventory beyond three to four thousand contracts in either direction.

The Sell Algorithm used by the large trader responded to the increased volume by increasing the rate at which it was feeding the orders into the market, even though orders that it already sent to the market were arguably not yet fully absorbed by fundamental buyers or cross-market arbitrageurs. In fact, especially in times of significant volatility, high trading volume is not necessarily a reliable indicator of market liquidity.

3,300 contracts is about $180-million. So now we know how much money the HFT guys are prepared to risk.

Still lacking sufficient demand from fundamental buyers or cross-market arbitrageurs, HFTs began to quickly buy and then resell contracts to each other – generating a “hot-potato” volume effect as the same positions were rapidly passed back and forth. Between 2:45:13 and 2:45:27, HFTs traded over 27,000 contracts, which accounted for about 49 percent of the total trading volume, while buying only about 200 additional contracts net.

At this time, buy-side market depth in the E-Mini fell to about $58 million, less than 1% of its depth from that morning’s level.

So they’re saying that total depth in the morning was $5.8-billion, but it is certainly possible that a lot of that was duplicates. There is not necessarily a high correlation between the amount of bids you have on the table and the amount of money you’re prepared to risk: you might intend on pulling some orders as others get filled, or immediately hedging your exposure as each order is executed in turn.

[Further explanation added 2010-10-2: For instance, we might have two preferred share issues trading, A & B, both quoted at 23.00-20. I want to sell A and buy B, but since I have a functioning brain cell I want to do this at a fixed spread. For purposes of this example, I want to execute the swap as long as I can do both sides at the same price. I don’t care much what that price is.

What I might do is enter an offer on A at 23.20 and a bid on B at 23.00. If one side of the order is executed, I will then change the price of the other. If things work out right, I’ll get a bit of my trade done. It could be that only one side of the trade will execute and the other won’t – that’s simply part of the risks of trading and that’s what I get paid to judge and control: if I get it right often enough, my clients will make more money than they would otherwise.

The point is that my bid on B is contingent. If the quote on A moves, I’m going to move my bid on B. If the market gets so wild that I judge that I can’t count on executing either side at a good price after the first side is executed, I’m going to pull the whole thing and wait until things have settled down. I do not want to change my total exposure to the preferred share market, I only want to swap within it.

Therefore, you can not necessarily look at the order book of B, see my bid order there, and conclude that it’s irrevocably part of the depth that will prevent big market moves.

Once you start to become suspicious that you cannot, in fact, lay off your exposure instantly, well then, the first thing you do is start cancelling your surplus orders…

Between 2:32 p.m. and 2:45 p.m., as prices of the E-Mini rapidly declined, the Sell Algorithm sold about 35,000 E-Mini contracts (valued at approximately $1.9 billion) of the 75,000 intended. During the same time, all fundamental sellers combined sold more than 80,000 contracts net, while all fundamental buyers bought only about 50,000 contracts net, for a net fundamental imbalance of 30,000 contracts. This level of net selling by fundamental sellers is about 15 times larger compared to the same 13-minute interval during the previous three days, while this level of net buying by the fundamental buyers is about 10 times larger compared to the same time period during the previous three days.

In the report, they provide a definition:

We define fundamental sellers and fundamental buyers as market participants who are trading to accumulate or reduce a net long or short position. Reasons for fundamental buying and selling include gaining long-term exposure to a market as well as hedging already-existing exposures in related markets.

They would have been better off sticking to the street argot of “Real money” and “hot money”. Using the word “fundamental” implies the traders know what they’re doing, when I suspect most of the are simply cowboys and high-school students, marketting their keen insights into quantitative momentum-based computer-driven macro-strategies.

Many over-the-counter (“OTC”) market makers who would otherwise internally execute as principal a significant fraction of the buy and sell orders they receive from retail customers (i.e., “internalizers”) began routing most, if not all, of these orders directly to the public exchanges where they competed with other orders for immediately available, but dwindling, liquidity.

Even though after 2:45 p.m. prices in the E-Mini and SPY were recovering from their severe declines, sell orders placed for some individual securities and ETFs (including many retail stop-loss orders, triggered by declines in prices of those securities) found reduced buying interest, which led to further price declines in those securities.

OK, so a lot of stop-loss orders were routed through internalizers. Remember that; we’ll return to this point.

However, as liquidity completely evaporated in a number of individual securities and ETFs,11 participants instructed to sell (or buy) at the market found no immediately available buy interest (or sell interest) resulting in trades being executed at irrational prices as low as one penny or as high as $100,000. These trades occurred as a result of so-called stub quotes, which are quotes generated by market makers (or the exchanges on their behalf) at levels far away from the current market in order to fulfill continuous two-sided quoting obligations even when a market maker has withdrawn from active trading.

Stub quotes have to represent yet another triumph of the box-tickers. I mean, if you’re asking for continuous two-way markets as the price of privilege … shouldn’t you ensure that they’re meaningful two-way markets?

The summary briefly mentions the latency problem:

Although we do not believe significant market data delays were the primary factor in causing the events of May 6, our analyses of that day reveal the extent to which the actions of market participants can be influenced by uncertainty about, or delays in, market data.

The latency problem was discussed on August 9.

Now back to stop-losses:

For instance, some OTC internalizers reduced their internalization on sell-orders but continued to internalize buy-orders, as their position limit parameters were triggered. Other internalizers halted their internalization altogether. Among the rationales for lower rates of internalization were: very heavy sell pressure due to retail market and stop-loss orders, an unwillingness to further buy against those sells, data integrity questions due to rapid prices moves (and in some cases data latencies), and intra-day changes in P&L that triggered predefined limits.

As noted previously, many internalizers of retail order flow stopped executing as principal for their customers that afternoon, and instead sent orders to the exchanges, putting further pressure on the liquidity that remained in those venues. Many trades that originated from retail customers as stop-loss orders or market orders were converted to limit orders by internalizers prior to routing to the exchanges for execution. If that limit order could not be filled because the market continued to fall, then the internalizer set a new lower limit price and resubmitted the order, following the price down and eventually reaching unrealistically-low bids. Since internalizers were trading as riskless principal, many of these orders were marked as short even though the ultimate retail seller was not necessarily short.51 This partly helps explain the data in Table 7 of the Preliminary Report in which we had found that 70-90% of all trades executed at less than five cents were marked short.

That had really bothered me, so I’m glad that’s cleared up.

Detailed analysis of trade and order data revealed that one large internalizer (as a seller) and one large market maker (as a buyer) were party to over 50% of the share volume of broken trades, and for more than half of this volume they were counterparties to each other (i.e., 25% of the broken trade share volume was between this particular seller and buyer). Furthermore, in total, data show that internalizers were the sellers for almost half of all broken trade share volume. Given that internalizers generally process and route retail trading interest, this suggests that at least half of all broken trade share volume was due to retail customer sell orders.

In summary, our analysis of trades broken on May 6 reveals they were concentrated primarily among a few market participants. A significant number of those trades were driven by sell orders from retail customers sent to internalizers for immediate execution at then-current market prices. Internalizers, in turn, routed these orders to the public exchanges for execution at the NBBO. However, for those securities in which market makers had withdrawn their liquidity, there was insufficient buy interest, and many trades were executed at very low (and sometimes very high) prices, including stub quotes.

Stop-Loss: the world’s dumbest order-type.

In summary, this just shows that while the pool of hot money acting as a market-making buffer on price changes is very large, it can be exhausted … and when it’s exhausted, the same thing happens as when any buffer runs out.

Update: The Financial Post picked up a Reuters story:

The so-called flash crash sent the Dow Jones industrial average down some 700 points in minutes, exposing flaws in the electronic marketplace dominated by high-frequency trading.

I see no support for this statement at all. This was, very simply, just another case of market impact cost, distinguished only by its size. But blaming the HFT guys is fashionable this week…

Themis Trading has predicted:

  • Alter the existing single stock circuit breaker to include a limit up/down feature….
  • Eliminate stop-loss market orders….
  • Eliminate stub quotes and allow one-sided quotes (a stub quote is basically a place holder that a market maker uses in order to provide a two-sided quote)…Exchanges also recently proposed a ban on stub quotes. They requested that all market makers be mandated to quote no more than 8% away from the NBBO for stocks in the circuit breaker pilot program and during the hours that the circuit breakers are in effect (9:45am-3:35pm ET). Exchanges proposed that market makers be mandated to quote no further than 20% away from the NBBO during the 15 minutes after the opening and 25 minutes before the close….
  • Increase market maker requirements, including a minimal time for market makers to quote on the NBBO…..In addition, the larger HFTs believe that market makers should have higher capital requirements. Some smaller HFTs have not supported these proposed obligations, however. They fear that the larger HFTs will be able to meet these obligations and, in return, the larger HFTs will receive advantages from the exchanges that market makers usually enjoy. According to these smaller HFT’s, these advantages would include preferential access to the markets, lower fees and informational advantages. Smaller HFTs have warned that competition could be degraded and barriers to entry could be raised.

Ah, the good old compete-via-regulatory-capital-requirements game. Very popular, particularly in Canada.

And there’s at least one influential politician, Paul E. Kanjorski (D-PA), who wants to use the report to further his completely unrelated agenda:

“The SEC and CFTC report confirms that faster markets do not always lead to better markets,” said Chairman Kanjorski. “While automated, high-frequency trading may provide our markets with some benefits, it can also carry the potential for serious harm and market mischief. Extreme volatility of the kind we experienced on May 6 could happen again, as demonstrated by the volatility in individual stocks since then. To limit recurrences of that roller-coaster day and to bolster individual investor confidence, our regulators must expeditiously review and revise the rules governing market structure. Congress must also conduct oversight of these matters and, if necessary, put in place new rules of the road to ensure the fair, orderly and efficient functioning of the U.S. capital markets. The CFTC-SEC staff report will greatly assist in working toward these important policy goals.”

Update: FT Alphaville points out:

The CFTC, which wrote the report alongside the SEC, had previously downplayed that version of events but said it was looking into Nanex’s data. But Friday’s report explicitly contradicts Nanex’s take.

The Nanex explanation was last discussed on PrefBlog on August 17. The relevant section of the report, highlighted by FT Alphaville, is:

Some market participants and firms in the market data business have analyzed the CTS and CQS data delays of May 6, as well as the quoting patterns observed on a variety of other days. It has been hypothesized that these delays are due to a manipulative practice called “quote-stuffing” in which high volumes of quotes are purposely sent to exchanges in order to create data delays that would afford the firm sending these quotes a trading advantage.

Our investigation to date reveals that the largest and most erratic price moves observed on May 6 were caused by withdrawals of liquidity and the subsequent execution of trades at stub quotes. We have interviewed many of the participants who withdrew their liquidity, including those who were party to significant numbers of buys and sells that occurred at stub quote prices. As described throughout this report each market participant had many and varied reasons for its specific actions and decisions on May 6. For the subset of those liquidity providers who rely on CTS and CQS data for trading decisions or data- integrity checks, delays in those feeds would have influenced their actions. However, the evidence does not support the hypothesis that delays in the CTS and CQS feeds triggered or otherwise caused the extreme volatility in security prices observed that day.

Update: The report has some very cool graphs of market depth – some of the Accenture ones are:


Accenture Order Book Depth – Day
Click for big


Accenture Order Book Depth – Close-up
Click for big


Legend
Click for big

Update, 2010-10-3: The report notes:

Some firms use multiple data sources as inputs to their data-integrity checks, and when those sources do not agree, a pause can be triggered. As discussed in Section 3, latency issues regarding a subset of pricing data on the consolidated market data feeds for NYSE-traded stocks triggered data-integrity checks in the systems of some firms. We refer to these as “feed-driven integrity pauses.”

Whenever data integrity was questioned for any reason, firms temporarily paused trading in either the offending security, or in a group of securities. As a firm paused its trading, any liquidity the firm may have been providing to the market became unavailable, and other firms that were still providing liquidity to the markets had to absorb continued order flow. To the extent that this led to more concentrated price pressure, additional rapid price moves would in turn trigger yet more price-driven integrity pauses.

Most market makers cited data integrity as a primary driver in their decision as to whether to provide liquidity at all, and if so, the manner (size and price) in which they would do so. On May 6, a number of market makers reported that rapid price moves in the E-Mini and individual securities triggered price-driven integrity pauses. Some, who also monitor the consolidated market data feeds, reported feed-driven integrity pauses. We note that even in instances where a market maker was not concerned (or even knowledgeable) about external issues related to feed latencies, or declarations of self-help, the very speed of price moves led some to question the accuracy of price information and, thus, to automatically withdraw liquidity. According to a number of market makers, their internal monitoring continuously triggered visual and audio alarms as multiple securities breached a variety of risk limits one after another.

For instance, market makers that track the prices of securities that are underlying components of an ETF are more likely to pause their trading if there are price-driven, or data feed-driven, integrity questions about those prices.37 Moreover, extreme volatility in component stocks makes it very difficult to accurately value an ETF in real-time. When this happens, market participants who would otherwise provide liquidity for such ETFs may widen their quotes or stop providing liquidity (in some cases by using stub quotes) until they can determine the reason for the rapid price movement or pricing irregularities.

This points to two potentially useful regulatory measures: imposing data-throughput minima on the exchanges providing data feeds; and the imposition of short trading halts (“circuit-breakers”) under certain conditions.

Update, 2015-4-22: The UK arrest of Navinder Singh Sarao has brought some interesting incompetence to light:

When Washington regulators did a five-month autopsy in 2010 of the plunge that briefly erased almost $1 trillion from U.S. stock prices, they didn’t consider individuals manipulating the market with fake orders because they used incomplete data.

Their analysis was upended Tuesday with the arrest of Navinder Singh Sarao — a U.K.-based trader accused by U.S. authorities of abusive algorithmic trading dating back to 2009. The episode shows fundamental cracks in the way some of the world’s most important markets are regulated, from the exchanges that get to police themselves to the government departments that complain they don’t have adequate resources to do their jobs.

It turns out regulators may have missed Sarao’s activity because they weren’t looking at the right data, according to former CFTC Chief Economist Andrei Kirilenko, who co-authored the report. He said in an interview that the CFTC and SEC based their study of the sorts of futures Sarao traded primarily on completed transactions, which wouldn’t include the thousands of allegedly deceitful orders that Sarao submitted and immediately canceled.

On the day of the flash crash, Sarao used “layering” and “spoofing” algorithms to enter orders for thousands of futures on the Standard & Poor’s 500 Index. The orders amounted to about $200 million worth of bets that the market would fall, a trade that represented between 20 percent and 29 percent of all sell orders at the time. The orders were then replaced or modified 19,000 times before being canceled in the afternoon. None were filled, according to the affidavit.

SEC Commissioner Michael Piwowar, speaking Wednesday at an event in Montreal, said there needs to be a full investigation into whether the SEC or CFTC botched the flash crash analysis.

“I fully expect Congress to be involved in this,” he said.

Senator Richard Shelby, the Alabama Republican who heads the banking committee, said in a statement Wednesday that he intends to look into questions raised by Sarao’s arrest.

Mark Wetjen, a CFTC commissioner speaking at the same event, echoed Piwowar’s concerns about regulators’ understanding of the events.

“Everyone needs to have a deeper, better understanding of interconnections of derivatives markets on one hand and whatever related market is at issue,” Wetjen said. “It doesn’t seem like that was really addressed or looked at in that report.”

September 30, 2010

September 30th, 2010

Fabulous Fab, the bond salesman scapegoated for personally causing the Panic of 2007, and useful misdirection from the SEC’s incompetence, has claimed the SEC has no jurisdiction anyway:

The Securities and Exchange Commission can’t sue Fabrice Tourre over a Goldman Sachs Group Inc. deal involving collateralized debt obligations because the transaction wasn’t in the U.S., his lawyers told a judge.

The U.S. Supreme Court ruled in June that U.S. securities laws don’t apply to claims of foreign buyers of non-U.S. securities on foreign exchanges, lawyers for the Goldman executive director said in a court filing yesterday. The collateralized debt obligations known as Abacus at issue in the SEC’s complaint weren’t listed on any exchange and the sole investor in the notes was a foreign bank that purchased them overseas, according to the filing.

Another junk fund is starting:

Brompton Advantaged Tactical Yield Fund is an investment fund established under the laws of the Province of Ontario and governed by the Declaration of Trust. See “Overview of the Legal Structure of the Fund”.

Rationale The Fund has been created to provide investors with the opportunity to gain exposure to a diversified Portfolio focused on North American High-Yield Bond and Dividend Paying Equity securities, which offer attractive yields along with upside participation in the ongoing economic recovery. The Portfolio Manager expects that the Portfolio will initially be invested as to approximately 70% in High-Yield Bonds, 20% in Dividend Paying Equity securities, and 10% in Investment Grade Bonds.

This comes after the launch of the nonsensical iShares(R) DEX HYBrid Bond Index Fund, which has nothing to do with hybrid bonds, as the term is understood by the entire world except for the TMX and Blackrock’s marketting team. They just needed a word with HY in it (for High Yield, since “junk” is considered pejoritive) and didn’t want to use “HYacinth” … or “HYundai” … or … um … er … “HYmas” (licencing fees on that one would have been astronomical).

And, of course, all the junk coming out of new preferred issues. This is going to end badly.

Mixed results in the Canadian preferred share market on continued heavy volume, as PerpetualDiscounts were almost precisely flat on the day while FixedResets continued their recent slide by losing 16bp.

PerpetualDiscounts now yield 5.53%, equivalent to 7.74% interest at the standard equivalency factor of 1.4x. Long Corporates now yield about 5.15%, so the pre-tax interest-equivalent spread (also called the Seniority Spread) is now about 260bp, a meaningless apparent tightening from the 265bp reported September 29.

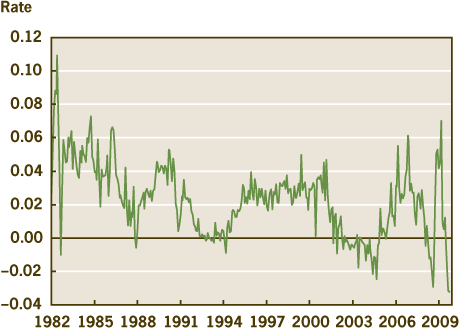
Long corporates have been on a tear this month:


Click for big

And that’s a wrap for another month and another quarter!

HIMIPref™ Preferred Indices
These values reflect the December 2008 revision of the HIMIPref™ Indices

Values are provisional and are finalized monthly
Index Mean
Current
Yield
(at bid)
Median
YTW
Median
Average
Trading
Value
Median
Mod Dur
(YTW)
Issues Day’s Perf. Index Value
Ratchet 0.00 % 0.00 % 0 0.00 0 1.1681 % 2,144.0
FixedFloater 0.00 % 0.00 % 0 0.00 0 1.1681 % 3,248.0
Floater 2.84 % 3.26 % 77,956 19.07 3 1.1681 % 2,315.0
OpRet 4.89 % 3.21 % 76,290 0.17 9 -0.0258 % 2,371.7
SplitShare 5.96 % -26.36 % 67,588 0.09 2 0.0000 % 2,360.7
Interest-Bearing 0.00 % 0.00 % 0 0.00 0 -0.0258 % 2,168.7
Perpetual-Premium 5.69 % 5.23 % 141,706 5.32 14 -0.1756 % 1,994.6
Perpetual-Discount 5.52 % 5.53 % 206,213 14.53 63 -0.0007 % 1,978.8
FixedReset 5.26 % 3.18 % 323,260 3.27 47 -0.1578 % 2,260.5
Performance Highlights
Issue Index Change Notes
BMO.PR.L Perpetual-Premium -1.53 % YTW SCENARIO
Maturity Type : Call
Maturity Date : 2017-06-24
Maturity Price : 25.00
Evaluated at bid price : 25.80
Bid-YTW : 5.37 %
GWO.PR.I Perpetual-Discount -1.38 % YTW SCENARIO
Maturity Type : Limit Maturity
Maturity Date : 2040-09-30
Maturity Price : 20.07
Evaluated at bid price : 20.07
Bid-YTW : 5.64 %
CM.PR.I Perpetual-Discount -1.23 % YTW SCENARIO
Maturity Type : Limit Maturity
Maturity Date : 2040-09-30
Maturity Price : 21.39
Evaluated at bid price : 21.68
Bid-YTW : 5.41 %
HSB.PR.D Perpetual-Discount -1.06 % YTW SCENARIO
Maturity Type : Limit Maturity
Maturity Date : 2040-09-30
Maturity Price : 23.04
Evaluated at bid price : 23.25
Bid-YTW : 5.40 %
PWF.PR.F Perpetual-Discount -1.05 % YTW SCENARIO
Maturity Type : Limit Maturity
Maturity Date : 2040-09-30
Maturity Price : 23.28
Evaluated at bid price : 23.55
Bid-YTW : 5.66 %
TRI.PR.B Floater 1.56 % YTW SCENARIO
Maturity Type : Limit Maturity
Maturity Date : 2040-09-30
Maturity Price : 23.11
Evaluated at bid price : 23.37
Bid-YTW : 2.21 %
TD.PR.O Perpetual-Discount 1.57 % YTW SCENARIO
Maturity Type : Limit Maturity
Maturity Date : 2040-09-30
Maturity Price : 23.64
Evaluated at bid price : 23.89
Bid-YTW : 5.15 %
Volume Highlights
Issue Index Shares
Traded
Notes
MFC.PR.C Perpetual-Discount 79,200 RBC crossed 55,100 at 19.37.
YTW SCENARIO
Maturity Type : Limit Maturity
Maturity Date : 2040-09-30
Maturity Price : 19.35
Evaluated at bid price : 19.35
Bid-YTW : 5.87 %
RY.PR.X FixedReset 73,636 RBC crossed 49,000 at 28.10.
YTW SCENARIO
Maturity Type : Call
Maturity Date : 2014-09-23
Maturity Price : 25.00
Evaluated at bid price : 27.98
Bid-YTW : 3.24 %
MFC.PR.B Perpetual-Discount 68,448 RBC crossed 55,000 at 20.02.
YTW SCENARIO
Maturity Type : Limit Maturity
Maturity Date : 2040-09-30
Maturity Price : 19.88
Evaluated at bid price : 19.88
Bid-YTW : 5.90 %
RY.PR.Y FixedReset 64,900 RBC crossed 50,000 at 28.07.
YTW SCENARIO
Maturity Type : Call
Maturity Date : 2014-12-24
Maturity Price : 25.00
Evaluated at bid price : 28.03
Bid-YTW : 3.20 %
CL.PR.B Perpetual-Premium 60,044 Nesbitt crossed 12,300 at 25.51; TD crossed 20,700 at the same price.
YTW SCENARIO
Maturity Type : Call
Maturity Date : 2010-10-30
Maturity Price : 25.25
Evaluated at bid price : 25.46
Bid-YTW : -3.87 %
RY.PR.I FixedReset 53,945 RBC crossed 50,000 at 26.70.
YTW SCENARIO
Maturity Type : Call
Maturity Date : 2014-03-26
Maturity Price : 25.00
Evaluated at bid price : 26.60
Bid-YTW : 3.15 %
There were 57 other index-included issues trading in excess of 10,000 shares.

September 29, 2010

September 29th, 2010

Germany will make its final Great War reparations payment on the weekend:

West Germany, formed after defeat in 1945, took on responsibility for most of the outstanding principle and interest, settling the bill in 1983.

But there was a clause in the so-called London Debt Agreement of 1953 that interest on multi-million pound foreign loans taken out in the Weimar Republic era, to pay off the reparations bill, should themselves be repaid if Germany were ever reunited.

Payments on this interest began again in 1996.

‘On Sunday the last bill is due and the First World War finally, financially at least, terminates for Germany,’ said Bild, the country’s biggest selling newspaper.

Most of the money goes to private individuals, pension funds and corporations holding debenture bonds as agreed under the Treaty of Versailles.

The German government did not reveal how the money will be disbursed but it is understood that it is transferred to a holding account before being sent to the relevant bond and debt holders.
Most of these are American and French.

The Ontario prostitution ruling is on-line. The judge’s opinion of the experts (paras 352-358) is hiliarious.

The Canadian preferred share market slid again today, with PerpetualDiscounts losing 10bp and FixedResets down 11bp. After the redemption of CM.PR.R and CM.PR.A was announced, I wondered what would happen to TD.PR.M and TD.PR.N. Well … they’re both on the unpleasant side of the performance highlights table, but nothing too terrible has happened … yet.

PerpetualDiscounts now yield 5.54%, equivalent to 7.76% interest at the standard equivalency factor of 1.4x. Long corporates now yield about 5.1% (!) so the pre-tax interest-equivalent spread (also called the Seniority Spread) now stands at about 265bp, a sharp increase from the 245bp reported September 22, as long corporate yields have plummetted about 20bp while PerpetualDiscount yields are unchanged.

HIMIPref™ Preferred Indices
These values reflect the December 2008 revision of the HIMIPref™ Indices

Values are provisional and are finalized monthly
Index Mean
Current
Yield
(at bid)
Median
YTW
Median
Average
Trading
Value
Median
Mod Dur
(YTW)
Issues Day’s Perf. Index Value
Ratchet 0.00 % 0.00 % 0 0.00 0 -0.3275 % 2,119.3
FixedFloater 0.00 % 0.00 % 0 0.00 0 -0.3275 % 3,210.5
Floater 2.87 % 3.29 % 78,023 19.00 3 -0.3275 % 2,288.3
OpRet 4.89 % 3.29 % 76,058 0.17 9 -0.1672 % 2,372.3
SplitShare 5.96 % -27.35 % 64,383 0.09 2 -0.3688 % 2,360.7
Interest-Bearing 0.00 % 0.00 % 0 0.00 0 -0.1672 % 2,169.3
Perpetual-Premium 5.68 % 5.08 % 140,758 5.33 14 -0.2869 % 1,998.1
Perpetual-Discount 5.52 % 5.54 % 205,447 14.53 63 -0.1031 % 1,978.8
FixedReset 5.26 % 3.16 % 324,180 3.27 47 -0.1061 % 2,264.1
Performance Highlights
Issue Index Change Notes
HSB.PR.C Perpetual-Discount -1.63 % YTW SCENARIO
Maturity Type : Limit Maturity
Maturity Date : 2040-09-29
Maturity Price : 23.26
Evaluated at bid price : 23.50
Bid-YTW : 5.45 %
TD.PR.N OpRet -1.49 % YTW SCENARIO
Maturity Type : Call
Maturity Date : 2011-05-30
Maturity Price : 25.50
Evaluated at bid price : 25.86
Bid-YTW : 3.50 %
NA.PR.K Perpetual-Premium -1.20 % YTW SCENARIO
Maturity Type : Call
Maturity Date : 2012-06-14
Maturity Price : 25.00
Evaluated at bid price : 25.55
Bid-YTW : 4.97 %
BAM.PR.R FixedReset -1.20 % YTW SCENARIO
Maturity Type : Call
Maturity Date : 2016-07-30
Maturity Price : 25.00
Evaluated at bid price : 26.45
Bid-YTW : 4.25 %
TD.PR.M OpRet -1.13 % YTW SCENARIO
Maturity Type : Call
Maturity Date : 2010-10-29
Maturity Price : 25.75
Evaluated at bid price : 26.15
Bid-YTW : -5.09 %
BMO.PR.P FixedReset -1.04 % YTW SCENARIO
Maturity Type : Call
Maturity Date : 2015-03-27
Maturity Price : 25.00
Evaluated at bid price : 27.51
Bid-YTW : 3.08 %
BMO.PR.L Perpetual-Premium -1.02 % YTW SCENARIO
Maturity Type : Call
Maturity Date : 2017-06-24
Maturity Price : 25.00
Evaluated at bid price : 26.20
Bid-YTW : 5.08 %
GWO.PR.J FixedReset 1.23 % YTW SCENARIO
Maturity Type : Call
Maturity Date : 2014-01-30
Maturity Price : 25.00
Evaluated at bid price : 27.14
Bid-YTW : 3.29 %
BAM.PR.O OpRet 1.49 % YTW SCENARIO
Maturity Type : Option Certainty
Maturity Date : 2013-06-30
Maturity Price : 25.00
Evaluated at bid price : 26.51
Bid-YTW : 2.72 %
Volume Highlights
Issue Index Shares
Traded
Notes
CM.PR.A OpRet 413,500 Called for redemption.
YTW SCENARIO
Maturity Type : Call
Maturity Date : 2010-11-30
Maturity Price : 25.00
Evaluated at bid price : 24.97
Bid-YTW : 3.29 %
BNS.PR.P FixedReset 353,300 Nesbitt crossed blocks of 250,000 and 100,000, both at 26.75.
YTW SCENARIO
Maturity Type : Call
Maturity Date : 2013-05-25
Maturity Price : 25.00
Evaluated at bid price : 26.71
Bid-YTW : 2.59 %
BNS.PR.R FixedReset 63,880 Nesbitt bought four blocks from anonymous: 10,000 at 26.85, two blocks of 11,000 each, both at 26.89, and 11,000 at 26.90.
YTW SCENARIO
Maturity Type : Call
Maturity Date : 2014-02-25
Maturity Price : 25.00
Evaluated at bid price : 26.75
Bid-YTW : 3.03 %
TD.PR.P Perpetual-Discount 60,528 Nesbitt crossed 50,000 at 24.75.
YTW SCENARIO
Maturity Type : Limit Maturity
Maturity Date : 2040-09-29
Maturity Price : 24.43
Evaluated at bid price : 24.66
Bid-YTW : 5.40 %
HSB.PR.E FixedReset 52,185 RBC crossed 24,200 at 28.15.
YTW SCENARIO
Maturity Type : Call
Maturity Date : 2014-07-30
Maturity Price : 25.00
Evaluated at bid price : 28.03
Bid-YTW : 3.26 %
IGM.PR.B Perpetual-Discount 47,000 Desjardins crossed 38,400 at 25.10.
YTW SCENARIO
Maturity Type : Call
Maturity Date : 2019-01-30
Maturity Price : 25.00
Evaluated at bid price : 25.05
Bid-YTW : 5.83 %
There were 59 other index-included issues trading in excess of 10,000 shares.

September 28, 2010

September 28th, 2010

John Hempton of Bronte Capital is keeping the Universal Travel Group pot boiling:

The only communication I have had from Universal Travel Group was a kind email from the acting Chief Financial Officer saying that I needed to provide proof that I was a shareholder to participate in the conference call that they are having on Wednesday, September 29, 2010, to discuss and answer any questions investors may have regarding the Company’s business and financial statements.

I have some questions and I forwarded them in advance to the company as requested.

The purpose of this post is to put the questions on the record in the hope that they are answered and not to entertain my regular readers.

The Fed’s Shared National Credit Review was positive:

Reasons for improvement included improved borrower operating performance, debt restructurings and bankruptcy resolutions, and improved borrower access to bond and equity markets. Industries contributing to improvement in credit quality included automotive, materials and commodities, and finance and insurance. The volume of poorly underwritten credits originated in 2006 and 2007 continued to adversely affect the overall credit quality of the portfolio. Refinancing risk within the portfolio is significant, with nearly 67 percent of criticized assets maturing between 2012 and 2014

I see that the prostitution laws have been struck down, which is a very good thing (unless, of course, you believe that morality can be legistlated). In an amazingly intelligent remark, the judge said:

Judge Himel also said that pimps who threaten or commit violence against prostitutes can still be prosecuted using other sections of the Criminal Code.

When defenders of the faith law wring their hands about human trafficking (it used to be called white slavery), they never explain why such actions don’t fall under the heading of extortion.

However, Judge Himel gave the Crown a 30-day window in which to make arguments against legalizing bawdy houses on account of a concern that “unlicenced brothels may be operated in a way that may not be in the public interest.”

You want to see a bawdy house? Go peek at any of the downtown hotels.

“Any time you are alone with a john, it is dangerous,” federal Crown Michael Morris told Judge Himel. “There is no safe haven when you are involved in prostitution. There is overwhelming evidence that johns can become violent at any moment.”

However, Mr. Young countered that prohibiting communication renders prostitutes unable to “screen” potential clients, hire security or move behind the relative safety of closed doors.

I supposed that somewhere in Canada there is someone who thought Morris’ argument was the killer line, and whose faith in justice would have been shaken if the lawyers had not dutifully plodded through it and its obvious refutation … but it horrifies me to learn I’m paying for the Crown to spout such nonsense, and for the court reporter to write it down, and for courtroom rental while the argument is made, and for the judge to listen to it and note it in her ruling… That’s what’s wrong with the justice system: its being smothered in trivia. Used to be that a murder trial took two days – now it might take two years and I’m not convinced the justice dispensed is commensuraly more just.

The Canadian preferred share market slid again today, with PerpetualDiscounts losing 17bp and FixedResets down 31bp – the median wieghted average yield to worst on the latter index is back up to 3.09%.

HIMIPref™ Preferred Indices
These values reflect the December 2008 revision of the HIMIPref™ Indices

Values are provisional and are finalized monthly
Index Mean
Current
Yield
(at bid)
Median
YTW
Median
Average
Trading
Value
Median
Mod Dur
(YTW)
Issues Day’s Perf. Index Value
Ratchet 0.00 % 0.00 % 0 0.00 0 0.1275 % 2,126.3
FixedFloater 0.00 % 0.00 % 0 0.00 0 0.1275 % 3,221.0
Floater 2.87 % 3.30 % 77,354 18.99 3 0.1275 % 2,295.8
OpRet 4.88 % -2.32 % 75,765 0.17 9 -0.0771 % 2,376.3
SplitShare 5.94 % -31.40 % 63,847 0.09 2 -0.4284 % 2,369.5
Interest-Bearing 0.00 % 0.00 % 0 0.00 0 -0.0771 % 2,172.9
Perpetual-Premium 5.65 % 5.03 % 141,885 5.33 14 0.0389 % 2,003.8
Perpetual-Discount 5.51 % 5.55 % 205,648 14.54 63 -0.1667 % 1,980.9
FixedReset 5.25 % 3.09 % 324,943 3.28 47 -0.3142 % 2,266.5
Performance Highlights
Issue Index Change Notes
TRP.PR.C FixedReset -2.29 % YTW SCENARIO
Maturity Type : Limit Maturity
Maturity Date : 2040-09-28
Maturity Price : 25.55
Evaluated at bid price : 25.60
Bid-YTW : 3.79 %
BAM.PR.J OpRet -1.94 % YTW SCENARIO
Maturity Type : Soft Maturity
Maturity Date : 2018-03-30
Maturity Price : 25.00
Evaluated at bid price : 26.28
Bid-YTW : 4.61 %
RY.PR.F Perpetual-Discount -1.88 % YTW SCENARIO
Maturity Type : Limit Maturity
Maturity Date : 2040-09-28
Maturity Price : 21.37
Evaluated at bid price : 21.37
Bid-YTW : 5.27 %
GWO.PR.I Perpetual-Discount -1.70 % YTW SCENARIO
Maturity Type : Limit Maturity
Maturity Date : 2040-09-28
Maturity Price : 20.20
Evaluated at bid price : 20.20
Bid-YTW : 5.61 %
GWO.PR.J FixedReset -1.65 % YTW SCENARIO
Maturity Type : Call
Maturity Date : 2014-01-30
Maturity Price : 25.00
Evaluated at bid price : 26.81
Bid-YTW : 3.69 %
BNS.PR.L Perpetual-Discount -1.59 % YTW SCENARIO
Maturity Type : Limit Maturity
Maturity Date : 2040-09-28
Maturity Price : 21.41
Evaluated at bid price : 21.71
Bid-YTW : 5.25 %
BNS.PR.M Perpetual-Discount -1.50 % YTW SCENARIO
Maturity Type : Limit Maturity
Maturity Date : 2040-09-28
Maturity Price : 21.40
Evaluated at bid price : 21.71
Bid-YTW : 5.25 %
BNS.PR.K Perpetual-Discount -1.34 % YTW SCENARIO
Maturity Type : Limit Maturity
Maturity Date : 2040-09-28
Maturity Price : 22.60
Evaluated at bid price : 22.80
Bid-YTW : 5.35 %
SLF.PR.E Perpetual-Discount -1.23 % YTW SCENARIO
Maturity Type : Limit Maturity
Maturity Date : 2040-09-28
Maturity Price : 20.00
Evaluated at bid price : 20.00
Bid-YTW : 5.66 %
ELF.PR.G Perpetual-Discount -1.11 % YTW SCENARIO
Maturity Type : Limit Maturity
Maturity Date : 2040-09-28
Maturity Price : 20.47
Evaluated at bid price : 20.47
Bid-YTW : 5.93 %
CM.PR.H Perpetual-Discount -1.11 % YTW SCENARIO
Maturity Type : Limit Maturity
Maturity Date : 2040-09-28
Maturity Price : 21.89
Evaluated at bid price : 22.26
Bid-YTW : 5.37 %
BMO.PR.M FixedReset -1.04 % YTW SCENARIO
Maturity Type : Call
Maturity Date : 2013-09-24
Maturity Price : 25.00
Evaluated at bid price : 26.56
Bid-YTW : 2.88 %
SLF.PR.G FixedReset 1.37 % YTW SCENARIO
Maturity Type : Limit Maturity
Maturity Date : 2040-09-28
Maturity Price : 23.43
Evaluated at bid price : 25.85
Bid-YTW : 3.38 %
W.PR.J Perpetual-Discount 1.38 % YTW SCENARIO
Maturity Type : Limit Maturity
Maturity Date : 2040-09-28
Maturity Price : 24.34
Evaluated at bid price : 24.65
Bid-YTW : 5.68 %
BAM.PR.I OpRet 1.74 % YTW SCENARIO
Maturity Type : Call
Maturity Date : 2010-10-28
Maturity Price : 25.50
Evaluated at bid price : 26.25
Bid-YTW : -28.09 %
Volume Highlights
Issue Index Shares
Traded
Notes
HSB.PR.E FixedReset 61,151 Desjardins bought 25,000 from anonymous at 28.12, then crossed 25,000 at the same price.
YTW SCENARIO
Maturity Type : Call
Maturity Date : 2014-07-30
Maturity Price : 25.00
Evaluated at bid price : 28.06
Bid-YTW : 3.22 %
BMO.PR.J Perpetual-Discount 58,691 RBC crossed 25,000 at 22.00.
YTW SCENARIO
Maturity Type : Limit Maturity
Maturity Date : 2040-09-28
Maturity Price : 21.54
Evaluated at bid price : 21.88
Bid-YTW : 5.18 %
TD.PR.K FixedReset 48,350 RBC crossed 15,000 at 28.20.
YTW SCENARIO
Maturity Type : Call
Maturity Date : 2014-08-30
Maturity Price : 25.00
Evaluated at bid price : 28.16
Bid-YTW : 3.10 %
BNS.PR.M Perpetual-Discount 47,030 YTW SCENARIO
Maturity Type : Limit Maturity
Maturity Date : 2040-09-28
Maturity Price : 21.40
Evaluated at bid price : 21.71
Bid-YTW : 5.25 %
CM.PR.H Perpetual-Discount 31,198 YTW SCENARIO
Maturity Type : Limit Maturity
Maturity Date : 2040-09-28
Maturity Price : 21.89
Evaluated at bid price : 22.26
Bid-YTW : 5.37 %
BNS.PR.K Perpetual-Discount 29,195 YTW SCENARIO
Maturity Type : Limit Maturity
Maturity Date : 2040-09-28
Maturity Price : 22.60
Evaluated at bid price : 22.80
Bid-YTW : 5.35 %
There were 60 other index-included issues trading in excess of 10,000 shares.

CM.PR.R & CM.PR.A To Be Redeemed

September 28th, 2010

The Canadian Imperial Bank of Commerce has announced:

its intention to redeem all of its issued and outstanding Non-cumulative Class A Preferred Shares, Series 19 and all of its issued and outstanding Non-cumulative Class A Preferred Shares Series 23, for cash. The redemptions will occur on October 31, 2010. The redemption price is $25.45 per Series 19 share and $25.00 per Series 23 share.

The final quarterly dividend of $0.309375 per Series 19 share and $0.331250 dividend per Series 23 share for the period from August 1, 2010 to October 31, 2010 will be paid in the usual manner on October 28, 2010 to holders of record on September 28, 2010.

Beneficial holders who are not directly the registered holder of these shares should contact the financial institution, broker or other intermediary through which they hold their shares to confirm how they will receive their redemption proceeds. Formal notices and instructions for the redemption of Series 19 shares and Series 23 shares will be forwarded to registered shareholders.

Series 19 is CM.PR.R, which was listed 1998-03-26 and closed at 26.05-24 on September 27, is an OperatingRetractible with the option schedule:

Retraction 2013-04-30 INFINITE DATE 26.040000
Redemption 2008-04-30 2009-04-29 25.750000
Redemption 2009-04-30 2010-04-29 25.600000
Redemption 2010-04-30 2011-04-29 25.450000
Redemption 2011-04-30 2012-04-29 25.300000
Redemption 2012-04-30 2013-04-29 25.150000
Redemption 2013-04-30 2999-12-29 25.000000

The YTW Scenario as of last night’s close was for an immediate call at 25.45 to yield -27.01% … and that’s what happened. Investors were presumably counting on it to last until its softMaturity 2013-4-29 to yield 3.29%. This issue was relegated to the Scraps index on volume concerns.

Series 23 is CM.PR.A, which was listed 2001-02-06 and closed at 25.10-29 on September 27, is an OperatingRetractible with the option schedule:

Redemption 2007-10-31 2008-10-30 25.750000
Redemption 2008-10-31 2009-10-30 25.500000
Redemption 2009-10-31 2010-10-30 25.250000
Redemption 2010-10-31 INFINITE DATE 25.000000
Retraction 2011-07-31 INFINITE DATE 26.040000

The YTW scenario as of the close last night was for a call 2010-11-30 at 25.25 to yield 0.20% … pretty close! Investors were presumably counting on it to last until its softMaturity 2011-7-30 to yield 4.25%.

DBRS comments that it:

has reviewed the announcement by Canadian Imperial Bank of Commerce (CIBC or the Bank) to redeem all of the outstanding Non-Cumulative Class A Preferred Shares, Series 19 and Series 23. The redemption has no rating implications for CIBC at this time.

DBRS believes this transaction will reduce the Bank’s Tier 1 capital ratio by approximately 50 basis points (bps), which still leaves the ratio at the top end of its Canadian peer group range. At the end of Q3 2010, CIBC’s Tier 1 capital ratio was 14.2%. No impact is expected on the tangible common equity to risk-weighted assets ratio, which was 9.0% at the end of Q3 2010, as DBRS already excludes preferred shares from this calculation.

Given changes in Basel capital requirements and international accounting standards, the redemption of these two series of preferred shares is not unexpected.

After these redemptions, there will be only eight members left in the OperatingRetractible index. It will be interesting to see what happens to TD.PR.M and TD.PR.N tomorrow!

PrefLetter Site Access Restored

September 28th, 2010

The PrefLetter website was inaccessible for a day, but all has now been restored. There was nothing wrong with the site itself, but there was a DNS problem that meant that only the IP address was recognized – not the domain name.

September 27, 2010

September 27th, 2010

Nothing has happened since Friday.

Oh, well, I might as well mention Universal Travel Group, a story brought to my attention by the Divestor. It was savaged by John Hempton of Bronte Capital in a September 15 post … Mr. Hempton makes some very interesting points, which should be trivially easy to refute by a clean company:

It is pretty clear from this analysis that the main reason for owning the stock of Universal Travel Group is dubious. The online booking engine is dysfunctional – and the massive margins that it claims (84 percent for plane tickets) are thus also dubious.

All the profits that the company claimed it made out of the travel booking business (by far the bulk of its claimed profits) are similarly dubious – though there is a real travel company which might be making some profits.

The company claims in its most recent quarterly balance sheet to be carrying 43 million in cash and accounts receivable of almost 20 million. If the airline and hotel business are dubious then the profits generated that cash are dubious. In that case the cash itself is dubious.

I know people will buy this as Ben Graham net-net stock if it collapses. Unless this company can get a big four audit firm to sign-off for them I think you can – at least for the moment question the entire balance sheet.

What makes it interesting is the weakness of the response. On the day the blog post appeared, they issued a press release:

Universal Travel Group (NYSE: UTA) (“Universal Travel Group” or the “Company”), a leading travel services provider in China, today responded to allegations that appeared in the online blog by Bronte Capital. Universal Travel categorically denies all the allegations contained in the blog. The Company is consulting with its legal counsel as to the legal options available to it and will be aggressively pursuing all legal remedies against Bronte Capital and John Hempton for the damages caused to the Company and its shareholders.

“Categorically denies all the allegations”, eh? Very nice. Where’s the detail? Maybe there will be something in the conference call:

Universal Travel Group (NYSE: UTA) (“Universal Travel Group” or the “Company”), a leading travel services provider in China, today announced that it will hold a conference call at 9:00 a.m. ET on Wednesday, September 29, 2010, to discuss and answer any questions investors may have regarding the Company’s business and financial statements.

To participate in the call, please dial (877) 779-7834 five minutes prior to the 9:00 a.m. start time and reference conference ID number 12534724. International callers should dial +1 (706) 902-2087.

A replay of the call will be available for 14 days beginning Wednesday, September 29, 2010, at 10:00 a.m. Eastern Time. To listen to the replay, dial (800) 642-1687 and enter the conference ID number 12534724. International callers should dial +1 (706) 645-9291. An audio recording will also be available on the Company’s website at http://us.cnutg.com .

The Company’s headquarters and main base of operations is in Shenzhen in the Pearl River Delta region of China. More recently, Universal Travel Group has expanded its business into Western China, opening a second home base in the Chongqing Delta region, and other attractive, under-penetrated tier-two travel markets throughout the country.

C”mon, now! Shenzhen is not exactly the end of the earth any more. It’s basically next door to Hong Kong. And they couldn’t even get one western business reporter to walk around their headquarters and meet some of their “more than 200 professional staff”? Even Enron managed a better Potemkin village than that!

What gets me, though, is the complete lack of analysis I’ve been able to find. It has been over a week since the post appeared – and the stock took a big hit – but representative analysis is:

Universal Travel (NYSE: UTA): This is the latest casualty of a short attack based on rumor in innuendo this week. The free fall was precipitated by a professional short seller- John Hempton of Bronte Capital wrote a scathing “expose” wherein he demonstrated the company’s web sites didn’t provide him with Western style online travel services. He concluded the company is nothing but a phone in travel service, and claimed their numbers must be fraudulent based on their labor overhead vs their revenues. Conveniently, Hempton is located in Australia, and therefore enjoys a level of insulation from both civil law suit and SEC investigation.

There’s a few more examples of companies falling victim to either their own self induced foibles or fabricated attacks from those standing to gain. It’s the perfect storm for the short sellers to have their way with the public- the market environment is one in which investors will sell first to preserve capital, and find out the truth later. This group of short sellers is extremely well organized and knows how to work the media to their benefit.

Not a single point is addressed other than the condescending (and puzzling, considering their bias) sneer that we can’t judge Chinese web design by western standards. Just an ad hominem attack on short-sellers and vagueness.

I take no view on this stock. Before I took a view I would get my guy in Hong Kong to go across the border for an afternoon and knock on their door, among many other things. But the weakness of the management response is … interesting.

Wonder of wonders, the Canadian preferred share market actually fell today, with PerpetualDiscounts down 18bp and FixedResets losing 27bp – taking the median weighted-average yield of the latter back up to 3.00%. Volume continued to be heavy.

HIMIPref™ Preferred Indices
These values reflect the December 2008 revision of the HIMIPref™ Indices

Values are provisional and are finalized monthly
Index Mean
Current
Yield
(at bid)
Median
YTW
Median
Average
Trading
Value
Median
Mod Dur
(YTW)
Issues Day’s Perf. Index Value
Ratchet 0.00 % 0.00 % 0 0.00 0 -0.0546 % 2,123.5
FixedFloater 0.00 % 0.00 % 0 0.00 0 -0.0546 % 3,216.9
Floater 2.87 % 3.28 % 77,922 19.03 3 -0.0546 % 2,292.9
OpRet 4.88 % 0.20 % 76,105 0.17 9 0.1158 % 2,378.1
SplitShare 5.92 % -32.35 % 62,609 0.09 2 -0.2645 % 2,379.7
Interest-Bearing 0.00 % 0.00 % 0 0.00 0 0.1158 % 2,174.6
Perpetual-Premium 5.66 % 5.03 % 141,991 5.33 14 -0.0278 % 2,003.1
Perpetual-Discount 5.50 % 5.51 % 203,842 14.59 63 -0.1757 % 1,984.2
FixedReset 5.23 % 3.00 % 326,029 3.28 47 -0.2676 % 2,273.7
Performance Highlights
Issue Index Change Notes
SLF.PR.G FixedReset -2.37 % YTW SCENARIO
Maturity Type : Limit Maturity
Maturity Date : 2040-09-27
Maturity Price : 25.45
Evaluated at bid price : 25.50
Bid-YTW : 3.61 %
TRP.PR.B FixedReset -1.72 % YTW SCENARIO
Maturity Type : Limit Maturity
Maturity Date : 2040-09-27
Maturity Price : 25.11
Evaluated at bid price : 25.16
Bid-YTW : 3.48 %
POW.PR.C Perpetual-Discount -1.40 % YTW SCENARIO
Maturity Type : Limit Maturity
Maturity Date : 2040-09-27
Maturity Price : 24.36
Evaluated at bid price : 24.65
Bid-YTW : 5.89 %
CM.PR.K FixedReset -1.28 % YTW SCENARIO
Maturity Type : Call
Maturity Date : 2014-08-30
Maturity Price : 25.00
Evaluated at bid price : 27.01
Bid-YTW : 2.98 %
SLF.PR.C Perpetual-Discount -1.04 % YTW SCENARIO
Maturity Type : Limit Maturity
Maturity Date : 2040-09-27
Maturity Price : 20.00
Evaluated at bid price : 20.00
Bid-YTW : 5.60 %
BAM.PR.J OpRet 1.13 % YTW SCENARIO
Maturity Type : Call
Maturity Date : 2014-04-30
Maturity Price : 26.00
Evaluated at bid price : 26.80
Bid-YTW : 4.28 %
GWO.PR.H Perpetual-Discount 1.33 % YTW SCENARIO
Maturity Type : Limit Maturity
Maturity Date : 2040-09-27
Maturity Price : 21.72
Evaluated at bid price : 22.05
Bid-YTW : 5.51 %
Volume Highlights
Issue Index Shares
Traded
Notes
BNS.PR.Q FixedReset 76,625 Scotia crossed 30,000 at 26.70; TD crossed 25,000 at the same price.
YTW SCENARIO
Maturity Type : Call
Maturity Date : 2013-11-24
Maturity Price : 25.00
Evaluated at bid price : 26.65
Bid-YTW : 2.99 %
TD.PR.G FixedReset 51,698 TD crossed 20,000 at 28.21.
YTW SCENARIO
Maturity Type : Call
Maturity Date : 2014-05-30
Maturity Price : 25.00
Evaluated at bid price : 28.15
Bid-YTW : 2.93 %
RY.PR.I FixedReset 49,999 RBC crossed 40,000 at 26.70.
YTW SCENARIO
Maturity Type : Call
Maturity Date : 2014-03-26
Maturity Price : 25.00
Evaluated at bid price : 26.65
Bid-YTW : 3.08 %
SLF.PR.C Perpetual-Discount 45,657 Nesbitt crossed 32,000 at 20.21.
YTW SCENARIO
Maturity Type : Limit Maturity
Maturity Date : 2040-09-27
Maturity Price : 20.00
Evaluated at bid price : 20.00
Bid-YTW : 5.60 %
RY.PR.R FixedReset 45,040 RBC crossed 25,000 at 27.85; Desjardins crossed 11,000 at the same price.
YTW SCENARIO
Maturity Type : Call
Maturity Date : 2014-03-26
Maturity Price : 25.00
Evaluated at bid price : 27.79
Bid-YTW : 3.07 %
RY.PR.A Perpetual-Discount 34,540 YTW SCENARIO
Maturity Type : Limit Maturity
Maturity Date : 2040-09-27
Maturity Price : 21.54
Evaluated at bid price : 21.85
Bid-YTW : 5.13 %
There were 53 other index-included issues trading in excess of 10,000 shares.

FIG.PR.A To Merge into FCS

September 27th, 2010

Faircourt Asset Management has announced:

The adjourned special meeting of unitholders of Faircourt Income & Growth Split Trust (“FIG”) which was originally held on September 13, 2010 but was adjourned for lack of quorum, was held today at which the unitholders of FIG approved the merger (the “Merger”) of FIG into and Faircourt Split Trust (“FCS”), as the continuing fund, as described in the joint management information circular dated August 13, 2010 (the “Circular”). The Merger is expected to occur on or about September 30, 2010.

The Merger is, in part, a response to expected changes in the taxation of income funds. As a result of these changes, there are now an insufficient number of “income funds” for FIG to continue to meet its investment restrictions. Concurrent with the Merger, the investment mandate of FCS, as the continuing trust, will be expanded to remedy this situation and FCS will be able to invest in a broader range of securities and adjust its portfolio in the future as and when required to respond to market movements, as described in the Circular.

The prior stage in this process was the approval by FIG.PR.A holders; today’s approval was by holders of FIG.UN.

FIG.PR.A is tracked by HIMIPref™ but is relegated to the Scraps index on credit concerns.

New Issue: FFH FixedReset 5.00%+285

September 27th, 2010

Fairfax Financial Holdings Limited has announced:

that it will issue in Canada 8 million Preferred Shares, Series I at a price of $25.00 per share, for aggregate gross proceeds of $200 million, on a bought deal basis to a syndicate of Canadian underwriters.

Holders of the Preferred Shares, Series I will be entitled to receive a cumulative quarterly fixed dividend yielding 5.0% annually for the initial five year period ending December 31, 2015. Thereafter, the dividend rate will be reset every five years at a rate equal to the then current 5-year Government of Canada bond yield plus 2.85%.

Holders of Preferred Shares, Series I will have the right, at their option, to convert their shares into Preferred Shares, Series J, subject to certain conditions, on December 31, 2015, and on December 31 every five years thereafter. Holders of the Preferred Shares, Series J will be entitled to receive cumulative quarterly floating dividends at a rate equal to the then current three-month Government of Canada Treasury Bill yield plus 2.85%.

Fairfax has granted the underwriters an option, exercisable in whole or in part at any time up to 9:00 am on the date that is two business days prior to the closing date, to purchase an additional 2 million Preferred Shares, Series I at the same offering price for additional gross proceeds of $50 million.

Fairfax intends to use the net proceeds of the offering to augment its cash position, to increase short term investments and marketable securities held at the holding company level, to retire outstanding debt and other corporate obligations from time to time, and for general corporate purposes. The offering is expected to close on or about October 5, 2010.

Fairfax intends to file a prospectus supplement to its short form base shelf prospectus dated September 25, 2009, in respect of this offering with the applicable Canadian securities regulatory authorities. Details of this offering will be set out in the prospectus supplement, which will be available on the SEDAR website for the Company at www.sedar.com.

It is my understanding that the deal has been biggie-sized to $250-million, with a $50-million greenshoe. The junk just keeps coming!

Update: Fairfax has announced:

that as a result of strong investor demand for its previously announced offering of Preferred Shares, Series I, the size of the offering has been increased to 10 million shares. The aggregate gross proceeds will now be $250 million. The offering will be underwritten on a bought deal basis to a syndicate of Canadian underwriters.

Fairfax has granted the underwriters an option, exercisable in whole or in part at any time up to 9:00 am on the date that is two business days prior to the closing date, to purchase an additional 2 million Preferred Shares, Series I at the same offering price for additional gross proceeds of $50 million.

Server & eMail Problems

September 27th, 2010

The power supply on my offsite server failed at 2am last night, resulting in my various websites being down for about eight hours.

Things are now back to normal, but all eMail directed to me during the period was bounced. If you sent me anything between, say, 2am and 10am on Monday September 27, please resend it!