The International Monetary Fund has released the January 2010 Market Update to the Global Financial Stability Report, which contained some items of interest:
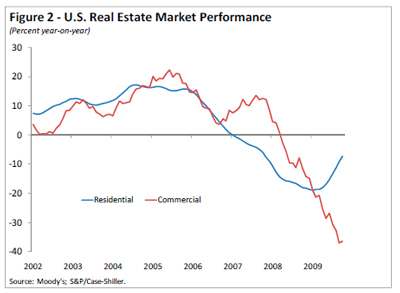
Credit losses arising from commercial real estate exposures are expected to increase substantially (Figure 2). The expected writedowns are concentrated in countries that experienced the largest run-ups in prices and subsequent corrections and are in line with our previous estimates.
And without wishing to become too think-tanky, I interpret the following as a warning shot against Comrade Peace-Prize’s unilateralism:
Policymakers should be mindful of the costs associated with uncertainty about future regulation, as this may hinder financial institutions’ plans regarding their business lines and credit provision. But they should also avoid the risks associated with too rapid deployment of new regulations without proper overall impact studies. It also continues to be vitally important that differences in international implementation of the new regulatory framework are minimized to avoid an uneven playing field and regulatory arbitrage that could compromise financial stability.
… but at least one guy thinks that nobody cares anyway, not even Comrade PP himself:
Philip Swagel, a former U.S. Treasury Department official who teaches at Georgetown University in Washington, said G7 officials would be wise not to worry too much about whether Mr. Obama’s boldest proposals will see the light of day, let alone fret about the U.S. gaining – or even seeking – enough global support that other countries end up having to replicate the measures.
“It’s not that they’re dead on arrival, they were never intended to be initiatives to push forward in the international agenda,” Mr. Swagel said in an interview. “They were aimed at domestic consumption, signalling to the American people that the President is as mad as they are.”
YES WE CAN indulge ourselves with cynical grandstanding!
A mixed day for Canadian preferreds with PerpetualDiscounts up 5bp and FixedResets losing 14bp. The market was well-behaved, with only four issues on the performance highlights list; one of the losers was our old friend POW.PR.C, gradually winding down toward normalcy. Volume continued at elevated levels.
| HIMIPref™ Preferred Indices These values reflect the December 2008 revision of the HIMIPref™ Indices Values are provisional and are finalized monthly |
|||||||
| Index | Mean Current Yield (at bid) |
Median YTW |
Median Average Trading Value |
Median Mod Dur (YTW) |
Issues | Day’s Perf. | Index Value |
| Ratchet | 0.00 % | 0.00 % | 0 | 0.00 | 0 | 0.3490 % | 1,718.7 |
| FixedFloater | 5.62 % | 3.71 % | 36,038 | 19.38 | 1 | 0.1554 % | 2,811.7 |
| Floater | 2.28 % | 2.65 % | 106,680 | 20.64 | 3 | 0.3490 % | 2,147.1 |
| OpRet | 4.85 % | -3.82 % | 116,109 | 0.09 | 13 | -0.0532 % | 2,315.6 |
| SplitShare | 6.35 % | -1.52 % | 162,772 | 0.08 | 2 | 0.4176 % | 2,116.7 |
| Interest-Bearing | 0.00 % | 0.00 % | 0 | 0.00 | 0 | -0.0532 % | 2,117.4 |
| Perpetual-Premium | 5.81 % | 5.65 % | 151,503 | 13.76 | 12 | -0.0597 % | 1,888.6 |
| Perpetual-Discount | 5.75 % | 5.79 % | 180,492 | 14.20 | 63 | 0.0514 % | 1,828.3 |
| FixedReset | 5.42 % | 3.60 % | 343,870 | 3.82 | 42 | -0.1369 % | 2,179.6 |
| Performance Highlights | |||
| Issue | Index | Change | Notes |
| POW.PR.D | Perpetual-Discount | -1.34 % | YTW SCENARIO Maturity Type : Limit Maturity Maturity Date : 2040-01-26 Maturity Price : 21.31 Evaluated at bid price : 21.31 Bid-YTW : 5.92 % |
| TD.PR.O | Perpetual-Discount | -1.33 % | YTW SCENARIO Maturity Type : Limit Maturity Maturity Date : 2040-01-26 Maturity Price : 22.09 Evaluated at bid price : 22.23 Bid-YTW : 5.48 % |
| POW.PR.C | Perpetual-Discount | -1.16 % | YTW SCENARIO Maturity Type : Limit Maturity Maturity Date : 2040-01-26 Maturity Price : 24.22 Evaluated at bid price : 24.61 Bid-YTW : 5.93 % |
| PWF.PR.K | Perpetual-Discount | 1.18 % | YTW SCENARIO Maturity Type : Limit Maturity Maturity Date : 2040-01-26 Maturity Price : 21.51 Evaluated at bid price : 21.51 Bid-YTW : 5.79 % |
| Volume Highlights | |||
| Issue | Index | Shares Traded |
Notes |
| CM.PR.L | FixedReset | 107,119 | Nesbitt crossed two blocks of 40,000 each, both at 27.75. CIBC sold 20,000 to RBC at 27.75. YTW SCENARIO Maturity Type : Call Maturity Date : 2014-05-30 Maturity Price : 25.00 Evaluated at bid price : 27.75 Bid-YTW : 3.76 % |
| TRP.PR.A | FixedReset | 87,073 | Nesbitt crossed 11,200 at 26.00. YTW SCENARIO Maturity Type : Call Maturity Date : 2015-01-30 Maturity Price : 25.00 Evaluated at bid price : 26.02 Bid-YTW : 3.78 % |
| W.PR.J | Perpetual-Discount | 51,000 | Nesbitt crossed 50,000 at 23.04. YTW SCENARIO Maturity Type : Limit Maturity Maturity Date : 2040-01-26 Maturity Price : 22.71 Evaluated at bid price : 23.00 Bid-YTW : 6.13 % |
| CM.PR.M | FixedReset | 47,275 | Nesbitt crossed 40,000 at 27.87. YTW SCENARIO Maturity Type : Call Maturity Date : 2014-08-30 Maturity Price : 25.00 Evaluated at bid price : 27.72 Bid-YTW : 3.91 % |
| NA.PR.N | FixedReset | 43,100 | TD crossed 25,000 at 26.45; RBC crossed 16,000 at the same price. YTW SCENARIO Maturity Type : Call Maturity Date : 2013-09-14 Maturity Price : 25.00 Evaluated at bid price : 26.46 Bid-YTW : 3.53 % |
| HSB.PR.E | FixedReset | 36,520 | RBC crossed 10,000 at 28.00. YTW SCENARIO Maturity Type : Call Maturity Date : 2014-07-30 Maturity Price : 25.00 Evaluated at bid price : 28.00 Bid-YTW : 3.85 % |
| There were 42 other index-included issues trading in excess of 10,000 shares. | |||