On December 31 I mentioned the scourge of windmill-promoting enviro-weenies. I now see there is a huge run to the trough in the UK:
The U.K. is targeting 15 percent of energy from renewable sources in 2020, of which 70 percent will have to come from offshore projects, according to the Carbon Trust.
The Crown Estate is seeking to add 25,000 megawatts in the third round, up from a combined 8,000 megawatts in the first rounds, and estimates potential market investment at 100 billion pounds. The U.K. has nine operating offshore farms with capacity of about 690 megawatts, enough for 400,000 homes, according to the British Wind Energy Association.
This disingenuous organization claims:
The BWEA Chief Executive rebutted claims about wind energy as ‘bizarre pseudo-science’, specifically she pointed out that:
- •There is no Government subsidy for building wind farms. As much as £2 billion of private investment has been made in the UK wind industry.
- •The support mechanism – Renewable Obligations Certificates (ROC) – is only available for electricity that wind farms have already produced and supplied to utilities
- •In 30 years of monitoring there have been no days when the wind has not blown throughout the UK.
- •Wind farms generate power for approximately 85% of the time.
- •The wind supplies over 2 GW of electricity in the UK, which is 1.5% of UK electricity needs.
Point three is the most entertaining, although point one is most objectionable.
An organization called No Wind Farm At Parham did some credible calculations to determine the monetary value to the pseudo-industry of the ROC system:
Seventy percent is even more than the figure I calculated for Ontario, but it should be noted that the Ontario figure is only the headline number; I feel confident that a thorough investigation would reveal less honest subsidies.
Unfortunately, this is one of the (many) areas of modern politics in which the average interested citizen will never, ever hear a rational and informative debate. The vested interests have taken over – and when the trough is as full as it is, the piggies will defend it to the death.
Sorry for all this windmill news – just call me Don Quixote – but there’s not much of interest to report that is more directly relevant to fixed income! It’s not like last year at this time when news was, shall we say, somewhat more gripping. Besides, the windmill story was on Bloomberg, so there!
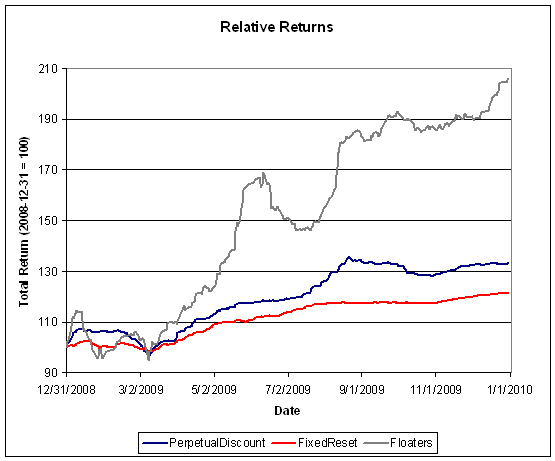
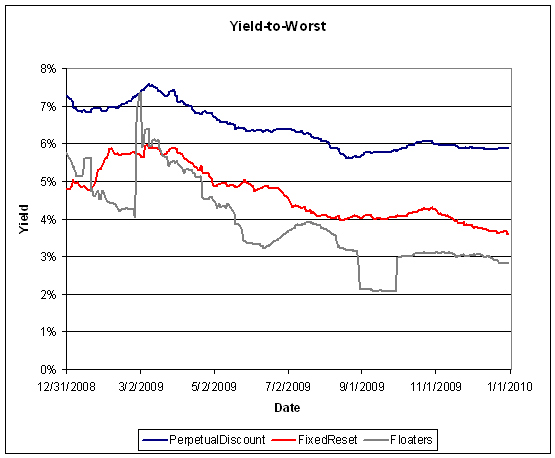
It was a happy day for preferred share owners, as Floaters continued their stunning ascent, PerpetualDiscounts gained 32bp and FixedResets gained 4bp (yields down to 3.52%!) on heavy volume.
| HIMIPref™ Preferred Indices These values reflect the December 2008 revision of the HIMIPref™ Indices Values are provisional and are finalized monthly |
|||||||
| Index | Mean Current Yield (at bid) |
Median YTW |
Median Average Trading Value |
Median Mod Dur (YTW) |
Issues | Day’s Perf. | Index Value |
| Ratchet | 0.00 % | 0.00 % | 0 | 0.00 | 0 | 1.7255 % | 1,664.2 |
| FixedFloater | 5.66 % | 3.82 % | 35,785 | 19.00 | 1 | 0.0000 % | 2,750.7 |
| Floater | 2.36 % | 2.71 % | 102,725 | 20.50 | 3 | 1.7255 % | 2,079.1 |
| OpRet | 4.82 % | -6.28 % | 114,965 | 0.09 | 13 | -0.4208 % | 2,324.6 |
| SplitShare | 6.39 % | -2.63 % | 188,084 | 0.08 | 2 | 0.0220 % | 2,102.8 |
| Interest-Bearing | 0.00 % | 0.00 % | 0 | 0.00 | 0 | -0.4208 % | 2,125.7 |
| Perpetual-Premium | 5.75 % | 5.64 % | 148,669 | 5.94 | 12 | 0.0953 % | 1,896.2 |
| Perpetual-Discount | 5.77 % | 5.82 % | 183,470 | 14.16 | 63 | 0.3224 % | 1,816.9 |
| FixedReset | 5.38 % | 3.52 % | 318,140 | 3.84 | 41 | 0.0355 % | 2,180.5 |
| Performance Highlights | |||
| Issue | Index | Change | Notes |
| BAM.PR.J | OpRet | -3.60 % | YTW SCENARIO Maturity Type : Soft Maturity Maturity Date : 2018-03-30 Maturity Price : 25.00 Evaluated at bid price : 26.22 Bid-YTW : 4.72 % |
| BMO.PR.J | Perpetual-Discount | -1.75 % | YTW SCENARIO Maturity Type : Limit Maturity Maturity Date : 2040-01-05 Maturity Price : 20.75 Evaluated at bid price : 20.75 Bid-YTW : 5.50 % |
| BMO.PR.K | Perpetual-Discount | 1.06 % | YTW SCENARIO Maturity Type : Limit Maturity Maturity Date : 2040-01-05 Maturity Price : 23.56 Evaluated at bid price : 23.75 Bid-YTW : 5.60 % |
| ELF.PR.G | Perpetual-Discount | 1.20 % | YTW SCENARIO Maturity Type : Limit Maturity Maturity Date : 2040-01-05 Maturity Price : 17.72 Evaluated at bid price : 17.72 Bid-YTW : 6.74 % |
| IAG.PR.A | Perpetual-Discount | 1.86 % | YTW SCENARIO Maturity Type : Limit Maturity Maturity Date : 2040-01-05 Maturity Price : 19.70 Evaluated at bid price : 19.70 Bid-YTW : 5.89 % |
| BAM.PR.B | Floater | 2.25 % | YTW SCENARIO Maturity Type : Limit Maturity Maturity Date : 2040-01-05 Maturity Price : 14.57 Evaluated at bid price : 14.57 Bid-YTW : 2.71 % |
| BAM.PR.K | Floater | 2.59 % | YTW SCENARIO Maturity Type : Limit Maturity Maturity Date : 2040-01-05 Maturity Price : 14.26 Evaluated at bid price : 14.26 Bid-YTW : 2.77 % |
| Volume Highlights | |||
| Issue | Index | Shares Traded |
Notes |
| BAM.PR.P | FixedReset | 193,631 | Nesbitt crossed three blocks at 27.25, of 100,000 shares, 25,000 shares and 20,000 shares. YTW SCENARIO Maturity Type : Call Maturity Date : 2014-10-30 Maturity Price : 25.00 Evaluated at bid price : 27.20 Bid-YTW : 4.99 % |
| RY.PR.A | Perpetual-Discount | 145,994 | RBC crossed 42,700 at 20.25. YTW SCENARIO Maturity Type : Limit Maturity Maturity Date : 2040-01-05 Maturity Price : 20.25 Evaluated at bid price : 20.25 Bid-YTW : 5.57 % |
| GWO.PR.J | FixedReset | 140,959 | RBC crossed blocks of 75,000 and 35,000 at 27.29, then one of 30,800 at 27.30. YTW SCENARIO Maturity Type : Call Maturity Date : 2014-01-30 Maturity Price : 25.00 Evaluated at bid price : 27.32 Bid-YTW : 3.56 % |
| GWO.PR.H | Perpetual-Discount | 126,104 | RBC crossed three blocks at 20.70: one of 15,700, one of 83,600 and the last of 16,400 shares. YTW SCENARIO Maturity Type : Limit Maturity Maturity Date : 2040-01-05 Maturity Price : 20.61 Evaluated at bid price : 20.61 Bid-YTW : 5.93 % |
| PWF.PR.H | Perpetual-Discount | 111,760 | Desjardins crossed two blocks of 50,000 each at 24.65. YTW SCENARIO Maturity Type : Limit Maturity Maturity Date : 2040-01-05 Maturity Price : 24.14 Evaluated at bid price : 24.52 Bid-YTW : 5.96 % |
| MFC.PR.B | Perpetual-Discount | 97,227 | Nesbitt crossed 13,000 at 20.00, while RBC crossed 75,000 at 20.15. YTW SCENARIO Maturity Type : Limit Maturity Maturity Date : 2040-01-05 Maturity Price : 20.00 Evaluated at bid price : 20.00 Bid-YTW : 5.88 % |
| There were 50 other index-included issues trading in excess of 10,000 shares. | |||