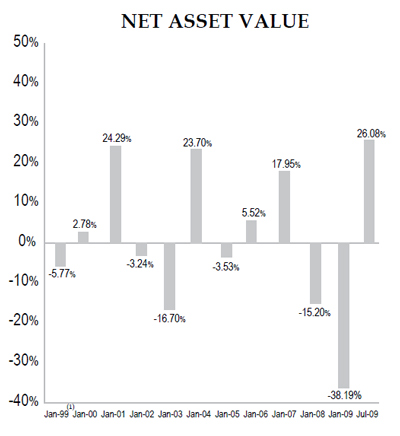
RPB.PR.A: Preferred Dividends Remain Suspended

September 4th, 2009

Connor, Clark & Lunn Capital Markets have advised:

ROC Pref III Corp. ( the “Company”) announced today that the preferred share dividend will remain suspended and will not resume for the quarter ending September 30th 2009. Connor, Clark & Lunn Capital Markets Inc. (the “Manager”) and Connor Clark & Lunn Investment Management Ltd. ( the “Investment Manager”) have taken this action in order to have the funds available for potential use, if necessary, as part of a restructuring plan for the Company that the Manager and Investment Manager are currently working on in conjunction with the independent members of the Board of Directors.

Given the events of the credit market over the past year and the credit events that have occurred in the underlying portfolio, the Manager and Investment Manager believe that a restructuring may be necessary in order to preserve the maximum value available to preferred shareholders. The funds that would have been used to pay the dividend will remain in the Company.

The Company expects to be in a position to announce a restructuring plan during the fourth quarter of 2009, but if it is not able to do so then the decision whether to pay the dividend will be reviewed on a quarterly basis.

Note that this structured investment has no capital units; the “preferred” is considered by some (e.g., S&P, the TSX and the issuer) to be appropriate since there is subordination in the underlying investment.

RPB.PR.A was last mentioned on PrefBlog when the Lear credit event nudged it closer to default. RPB.PR.A is not tracked by HIMIPref™.

MAPF Performance: August 2009

September 4th, 2009

The fund performed well as the preferred share recovery now looks pretty solid. As noted in the report of Index Performance, August 2009, PerpetualDiscounts posted very strong gains over the month, while FixedResets managed to outperform their currently very low expectations.

The fund’s performance was helped by its overweighting in PerpetualDiscount issues, as shown in the post MAPF Portfolio Composition, but managed to outperform even the pure measure of PerpetualDiscount total return due to security selection and frequent trading. This has been accomplished while remaining fully invested in a portfolio with an overall composition that did not change much through the month – which is exactly what I seek to accomplish in managing the fund.

The fund’s Net Asset Value per Unit as of the close August 31 was $12.6695.

Returns to August 31, 2009
Period MAPF Index CPD
according to
Claymore
One Month +7.20% +4.76% +3.08%
Three Months +21.02% +11.18% +8.01%
One Year +58.57% +8.45% +5.88%
Two Years (annualized) +25.09% +1.26%  
Three Years (annualized) +17.39% +0.97%  
Four Years (annualized) +14.41% +1.63%  
Five Years (annualized) +12.79% +2.29%  
Six Years (annualized) +13.65% +2.89%  
Seven Years (annualized) +14.31% +3,38%  
Eight Years (annualized) +13.39% +3.37%  
The Index is the BMO-CM “50”
MAPF returns assume reinvestment of dividends, and are shown after expenses but before fees.
CPD Returns are for the NAV and are after all fees and expenses.
Figures for Omega Preferred Equity (which are after all fees and expenses) for 1-, 3- and 12-months are +3.6%, +10.1% and +6.0%, respectively, according to Morningstar after all fees & expenses
Figures for Jov Leon Frazer Preferred Equity Fund (which are after all fees and expenses) for 1-, 3- and 12-months are N/A, N/A & N/A, respectively, according to Morningstar and the Globe and Mail
Figures for AIC Preferred Income Fund (which are after all fees and expenses) for 1-, 3- and 12-months are +2.8%, +6.2% & N/A, respectively

MAPF returns assume reinvestment of dividends, and are shown after expenses but before fees. Past performance is not a guarantee of future performance. You can lose money investing in Malachite Aggressive Preferred Fund or any other fund. For more information, see the fund’s main page.

I am very pleased with the returns, but implore Assiduous Readers not to project this level of outperformance for the indefinite future. The past year in the preferred share market has been filled with episodes of panic and euphoria, together with many new entrants who do not appear to know what they are doing; perfect conditions for a disciplined quantitative approach.

All I can say about the fund’s relative returns in the past year is … sometimes everything works. The fund seeks to earn incremental return by selling liquidity (that is, taking the other side of trades that other market participants are strongly motivated to execute), which can also be referred to as ‘trading noise’. There have been a lot of strongly motivated market participants in the past year, generating a lot of noise! Things won’t always be this good … but for as long as it lasts the fund will attempt to make hay while the sun shines.

There’s plenty of room for new money left in the fund. Just don’t expect the current level of outperformance every year, OK? While I will continue to exert utmost efforts to outperform, it should be borne in mind that beating the index by 500bp represents a good year, and there will almost inevitably be periods of underperformance in the future.

The yields available on high quality preferred shares remain elevated, which is reflected in the current estimate of sustainable income.

Calculation of MAPF Sustainable Income Per Unit
Month NAVPU Portfolio
Average
YTW
Leverage
Divisor
Securities
Average
YTW
Sustainable
Income
June, 2007 9.3114 5.16% 1.03 5.01% 0.4665
September 9.1489 5.35% 0.98 5.46% 0.4995
December, 2007 9.0070 5.53% 0.942 5.87% 0.5288
March, 2008 8.8512 6.17% 1.047 5.89% 0.5216
June 8.3419 6.034% 0.952 6.338% $0.5287
September 8.1886 7.108% 0.969 7.335% $0.6006
December, 2008 8.0464 9.24% 1.008 9.166% $0.7375
March 2009 $8.8317 8.60% 0.995 8.802% $0.7633
June 10.9846 7.05% 0.999 7.057% $0.7752
August 2009 12.6695 5.85% 1.008 5.804% $0.7353
NAVPU is shown after quarterly distributions.
“Portfolio YTW” includes cash (or margin borrowing), with an assumed interest rate of 0.00%
“Securities YTW” divides “Portfolio YTW” by the “Leverage Divisor” to show the average YTW on the securities held; this assumes that the cash is invested in (or raised from) all securities held, in proportion to their holdings.
“Sustainable Income” is the resultant estimate of the fund’s dividend income per unit, before fees and expenses.

As discussed in the post MAPF Portfolio Composition: August 2009, the fund has positions in splitShares (almost all BNA.PR.C) and an operating retractible (YPG.PR.B), both of which have high yields that are not sustainable: at some point they will be called or mature and the funds will have to be reinvested. Therefore, both of these positions skew the calculation upwards.. Since the yield on these positions is higher than that of the perpetuals despite the fact that the term is limited, the sustainability of the calculated “sustainable yield” is suspect, as discussed in August, 2008.

Significant positions were also held in Fixed-Reset issues on August 31; all of which currently have their yields calculated with the presumption that they will be called by the issuers at par at the first possible opportunity. It is the increase in exposure to the lower-yielding Fixed-Reset class that accounts for the apparent stall in the increase of sustainable income per unit in the past seven months. In December 2008, FixedReset exposure was zero; it is now 17.4%. Exposure to the extraordinarily high-yielding SplitShare class has also been reduced since December due to credit concerns.

However, if the entire portfolio except for the PerpetualDiscounts were to be sold and reinvested in these issues, the yield of the portfolio would be the 5.71% shown in the August 31 Portfolio Composition analysis (which is slightly in excess of the 5.66% index yield on August 31). Given such reinvestment, the sustainable yield would be 12.6695 * 0.0571 = 0.7234, a slight decrease from the $0.7256 derived by a similar calculation last month.

The decrease may be attributed to the slight portfolio shift into FixedResets, which did not have such extraordinarily good performance as the PerpetualDiscounts and also yield less going forward.

Different assumptions lead to different results from the calculation, but the overall positive trend is apparent. I’m very pleased with the results! It will be noted that if there was no trading in the portfolio, one would expect the sustainable yield to be constant (before fees and expenses). The success of the fund’s trading is showing up in

  • the very good performance against the index
  • the long term increases in sustainable income per unit

As has been noted, the fund has maintained a credit quality equal to or better than the index; outperformance is due to constant exploitation of trading anomalies.

Again, there are no predictions for the future! The fund will continue to trade between issues in an attempt to exploit market gaps in liquidity, in an effort to outperform the index and keep the sustainable income per unit – however calculated! – growing.

RBS Sub-Debt Will Not Be Called

September 4th, 2009

Royal Bank of Scotland has announced:

In the context of ongoing discussions between the UK Government and European Commission about the RBS restructuring plan and the Commission’s recent communication on restructuring, which states that, where possible, banks subject to restructuring under State aid rules should not use this aid to remunerate their own equity and subordinated debt, the FSA has objected to RBS calling at this time the following four subordinated debt instruments with call-dates in October 2009:

National Westminster Bank plc securities: Upper Tier 2 securities, EUR 400m, callable 5 October

National Westminster Bank plc securities: Upper Tier 2 securities, EUR 100m, callable 5 October

Royal Bank of Scotland plc securities: Lower Tier 2 securities, AUD 590m, callable 28 October

Royal Bank of Scotland plc securities: Lower Tier 2 securities, AUD 410m, callable 28 October

RBS is therefore not calling these subordinated debt instruments, consistent with their terms and conditions. Further, future decisions on whether or not to call capital instruments will be subject to consultation with the same parties, as well as circumstances (economic or other) prevailing at the time, pending the European Commission’s decision on RBS’s restructuring plan.

The terms of this sub-debt are not stated in the Annual Report 2008, but it is safe to assume that RBC could not borrow on commercial terms at the step-up rate.

Bloomberg reviews other European issues:

The executive arm of the European Union is insisting investors share with taxpayers the burden of saving banks, and already told Bayerische Landesbank, Germany’s second-largest state-owned lender and Anglo Irish Bank Corp. to defer payments on subordinated debt.

As well as not calling junior notes, some European banks bailed out with state funds have skipped interest payments on the debt. Northern Rock Plc, the first lender nationalized by the U.K. in the deepest credit crisis in decades, said last month it would defer coupons on eight subordinated bonds with an aggregate face value of about $2.74 billion.

Earlier this year Moody’s, DBRS and S&P downgraded bank hybrids on fears that exactly this would happen: that banks would be forced to treat their sub-debt in a businesslike fashion.

The issue of bank sub-debt redemptions has been previously discussed on PrefBlog.

Update, 2009-9-28: See also Hybrid Debt Attack: A Posse of Regulators is on the way.

Should Central Banks Target the Price Level?

September 4th, 2009

The Kansas City Fed has published a paper by George A. Kahn titled Beyond Inflation Targeting: Should Central Banks Target the Price Level?

The PDF is copy-protected – jerks!

Price Level Targetting was also discussed in the BoC Spring 2009 Review.

September 3, 2009

September 3rd, 2009

There’s an interesting twist in emerging Credit Rating Agency law:

A U.S. judge refused to dismiss a lawsuit against Moody’s Investors Service Inc. and Standard & Poor’s, rejecting arguments that investors can’t sue over deceptive ratings of private-placement notes because those opinions are protected by free-speech rights.

U.S. District Judge Shira Scheindlin in New York rejected the ratings firms’ arguments yesterday, forcing them and Morgan Stanley, which was also sued, to respond to fraud charges in a class-action by investors claiming the raters hid the risks of securities linked to subprime mortgages.

Scheindlin said in her ruling that the First Amendment of the U.S. Constitution doesn’t provide a defense the case because the rating firms’ comments were distributed privately to a select group of investors and not to the general public.

Without ruling on the merits of the lawsuit, the judge said opinions by the ratings companies may be the basis for a lawsuit “if the speaker does not genuinely and reasonably believe it or if it is without basis in fact.” She said there are enough facts alleged against the two agencies and Morgan Stanley, the sixth-biggest U.S. bank by assets, for the lawsuit to go forward with evidence gathering needed for any trial.

It seems pretty strange to me, but I’m prepared to concede that Scheindlin knows American constitutional law than I do! I don’t understand, however, why the CRAs have a duty to tell the truth. So they lie. So? The only person who’s paying them is the issuer. It also seems to me to be a reasonably easy lawsuit to defend: the CRAs simply have to show that they used a reasonable model such as the one they used for everything else.

Private Equity methodology is changing:

The world’s biggest private-equity firms, shut out of the market for leveraged buyouts as banks curtail lending, are turning to bankruptcy courts to make acquisitions.

KKR & Co., the New York takeover firm co-founded by Henry Kravis, is part of a group converting loans made to Lear Corp. into a controlling stake in the bankrupt car-seat maker. Late yesterday, Hayes Lemmerz International Inc. said it reached an agreement with the lenders who financed its bankruptcy, giving them an equity stake in the maker of wheels for cars. This year, 162 companies merged or were bought out of bankruptcy, a 60 percent jump from the same period in 2008 and almost triple the amount in 2007, according to data compiled by Bloomberg.

“It’s not a tactic that private-equity firms have historically employed, but it seems to be an idea whose time has come,” said Steven Smith, global head of leveraged finance and restructuring at UBS AG in New York. “This is clearly one of the new and most distinctive features of the current wave of restructurings.”

PerpetualDiscounts continued to give ground today, losing 31bp agains a FixedReset gain of 6bp; all this happened on relatively light volume and muted volatility: the Performance Highlights chart is pretty skimpy today.

HIMIPref™ Preferred Indices
These values reflect the December 2008 revision of the HIMIPref™ Indices

Values are provisional and are finalized monthly
Index Mean
Current
Yield
(at bid)
Median
YTW
Median
Average
Trading
Value
Median
Mod Dur
(YTW)
Issues Day’s Perf. Index Value
Ratchet 0.00 % 0.00 % 0 0.00 0 -0.6751 % 1,431.1
FixedFloater 5.84 % 4.11 % 60,099 18.46 1 0.5946 % 2,628.1
Floater 2.55 % 2.14 % 32,858 22.03 4 -0.6751 % 1,787.8
OpRet 4.86 % -11.08 % 127,226 0.09 15 -0.0128 % 2,278.7
SplitShare 6.49 % 6.74 % 1,163,998 4.07 2 -0.7554 % 2,037.0
Interest-Bearing 0.00 % 0.00 % 0 0.00 0 -0.0128 % 2,083.7
Perpetual-Premium 5.76 % 5.55 % 151,681 2.59 12 0.0132 % 1,880.5
Perpetual-Discount 5.70 % 5.75 % 205,091 14.29 59 -0.3099 % 1,800.5
FixedReset 5.50 % 4.06 % 473,283 4.11 40 0.0619 % 2,104.9
Performance Highlights
Issue Index Change Notes
ELF.PR.G Perpetual-Discount -3.62 % YTW SCENARIO
Maturity Type : Limit Maturity
Maturity Date : 2039-09-03
Maturity Price : 18.62
Evaluated at bid price : 18.62
Bid-YTW : 6.49 %
TRI.PR.B Floater -2.58 % YTW SCENARIO
Maturity Type : Limit Maturity
Maturity Date : 2039-09-03
Maturity Price : 18.51
Evaluated at bid price : 18.51
Bid-YTW : 2.14 %
GWO.PR.H Perpetual-Discount -1.78 % YTW SCENARIO
Maturity Type : Limit Maturity
Maturity Date : 2039-09-03
Maturity Price : 20.92
Evaluated at bid price : 20.92
Bid-YTW : 5.81 %
RY.PR.H Perpetual-Premium -1.14 % YTW SCENARIO
Maturity Type : Call
Maturity Date : 2017-06-23
Maturity Price : 25.00
Evaluated at bid price : 25.26
Bid-YTW : 5.55 %
BNA.PR.C SplitShare -1.04 % YTW SCENARIO
Maturity Type : Hard Maturity
Maturity Date : 2019-01-10
Maturity Price : 25.00
Evaluated at bid price : 19.10
Bid-YTW : 8.02 %
Volume Highlights
Issue Index Shares
Traded
Notes
BNS.PR.P FixedReset 123,646 Nesbitt bought two blocks from Desjardins, 23,900 and 25,000 shares, both at 26.06. RBC crossed 15,000 and Desjardins crossed 50,000 at the same price.
YTW SCENARIO
Maturity Type : Call
Maturity Date : 2013-05-25
Maturity Price : 25.00
Evaluated at bid price : 26.06
Bid-YTW : 3.90 %
TD.PR.P Perpetual-Discount 75,462 Nesbitt crossed blocks of 22,300 and 45,000 shares, both at 23.50.
YTW SCENARIO
Maturity Type : Limit Maturity
Maturity Date : 2039-09-03
Maturity Price : 23.29
Evaluated at bid price : 23.47
Bid-YTW : 5.66 %
SLF.PR.A Perpetual-Discount 59,935 Scotia crossed 50,000 at 20.60.
YTW SCENARIO
Maturity Type : Limit Maturity
Maturity Date : 2039-09-03
Maturity Price : 20.60
Evaluated at bid price : 20.60
Bid-YTW : 5.78 %
PWF.PR.H Perpetual-Discount 57,285 RBC crossed blocks of 19,400 and 24,900 shares, both at 25.00.
YTW SCENARIO
Maturity Type : Limit Maturity
Maturity Date : 2039-09-03
Maturity Price : 24.56
Evaluated at bid price : 24.89
Bid-YTW : 5.84 %
BNS.PR.T FixedReset 56,625 Nesbitt crossed 50,000 shares at 27.90.
YTW SCENARIO
Maturity Type : Call
Maturity Date : 2014-05-25
Maturity Price : 25.00
Evaluated at bid price : 27.90
Bid-YTW : 3.74 %
GWO.PR.I Perpetual-Discount 55,650 Nesbitt crossed 50,000 at 19.80.
YTW SCENARIO
Maturity Type : Limit Maturity
Maturity Date : 2039-09-03
Maturity Price : 19.80
Evaluated at bid price : 19.80
Bid-YTW : 5.69 %
There were 29 other index-included issues trading in excess of 10,000 shares.

ENB.PR.A: Pricing Clue from Long Bonds

September 3rd, 2009

Enbridge has just issued thirty-year notes at 5.75%, according to DBRS:

DBRS has today assigned a rating of “A” with a Negative trend to Enbridge Inc.’s $400 million 4.77% unsecured medium-term notes (Notes) issue maturing September 2, 2019 and $200 million 5.75% unsecured medium-term notes (Notes) issue maturing September 2, 2039. The Notes are being issued under the pricing supplement dated August 28, 2009, to the prospectus dated June 6, 2008, and the Trust Indenture dated October 20, 1997, as supplemented and amended from time to time.

The Notes will rank equally with all of Enbridge Inc.’s existing senior unsecured medium-term notes and debentures. Net proceeds from the sale of the above-noted securities will be used for the repayment of outstanding commercial paper or credit facility borrowings, or both, and for other general corporate purposes.

This is good to know in light of ENB.PR.A, a 5.50% straight preferred that is currently redeemable at par and closed today at 25.25-40, 4×2.

Now, issuance of $200-million at 5.75% interest doesn’t mean they can issue more; and if they could issue more they might not want to, in order to keep shareholders’ equity where the regulators like it. Never-the-less, this is a clear signal that from a straight business perspective, Enbridge can probably consider this issue as representing fairly expensive money and that the decision to keep or call ENB.PR.A relies on non-interest-rate factors.

Treasury Announces Bank Capitalization Wish-List

September 3rd, 2009

Treasury has announced:

the core principles that should guide reform of the international regulatory capital and liquidity framework to better protect the safety and soundness of individual banking firms and the stability of the global financial system and economy.

There are eight of these core principles given a brief explanation in the detailed announcement:

Core Principle #1: Capital requirements should be designed to protect the stability of the financial system (as well as the solvency of individual banking firms).

Among other things, a macro-prudential approach to regulation means: (i) reducing the extent to which the capital and accounting frameworks permit risk to accumulate in boom times, exacerbating the volatility of credit cycles; (ii) incorporating features that encourage or force banking firms to build larger capital cushions in good times; (iii) raising capital requirements for bank and non-bank financial firms that pose a threat to financial stability because of their combination of size, leverage, interconnectedness, and liquidity risk (Tier 1 FHCs) and for systemically risky exposure types; and (iv) improving the ability of banking firms to withstand firm-specific and system-wide liquidity shocks that can set off deleveraging spirals.

The document refers to Tier 1 FHCs quite often, raising the disquieting potential that this status will officially bestowed, which is the wrong thing to do. Instead, it would be far superior to (i) assign a progressive surcharge onto Risk-Weighted Assets as the firm gets larger; e.g., if RWA=$250-billion, no surcharge; 10% surcharge on the next $50-billion; 20% on the next $50-billion; and so on. A dual-track regime (one for Tier 1 FHCs, another for also-rans) is just going to create problems; and (ii) eliminate the favoured status of bank paper in the risk-weighting, so that banks in general hold less of each other’s paper.

Core Principle #2: Capital requirements for all banking firms should be higher, and capital requirements for Tier 1 FHCs should be higher than capital requirements for other banking firms.

See above

Core Principle #3: The regulatory capital framework should put greater emphasis on higher quality forms of capital.

For these reasons, during good economic conditions, common equity should constitute a large majority of a banking firm’s tier 1 capital, and tier 1 capital should constitute a large majority of a banking firm’s total regulatory capital. In addition, the inclusion in regulatory capital of deferred tax assets and non-equity hybrid and other innovative securities should be subject to strict, internationally consistent qualitative and quantitative limits.
We also consider it important that voting common equity represent a large majority of a banking firm’s tier 1 capital.

In other words, they don’t like the extent to which preferred shares and Innovative Tier 1 Capital have been used and they really dislike sub-debt.

Core Principle #4: Risk-based capital requirements should be a function of the relative risk of a banking firm’s exposures, and risk-based capital ratios should better reflect a banking firm’s current financial condition.

Among other things, we must reduce to the extent possible the vulnerabilities that may arise from excessive regulatory reliance on internal banking firm models or ratings from credit rating agencies to measure risk.
Risk weights should be a function of the asset-specific risk of the various exposure types, but they also should reflect the systemic importance of the various exposure types. From a macro-prudential perspective, exposure types that exhibit a high correlation with the economic cycle, or whose prevalence is likely to contribute disproportionately to financial instability in times of economic stress, should attract higher risk-based capital charges than other exposure types that have the same level of expected risk. One of the key examples of a systemically risky exposure type during the recent crisis was the structured finance credit protection purchased by many banking firms from AIG, the monoline insurance companies, and other thinly capitalized special purpose derivatives products companies.

I think that this is as close as Treasury will every get to admitting it goofed big-time on allowing uncollateralized leverage credit protection to offset cash positions.

Core Principle #5: The procyclicality of the regulatory capital and accounting regimes should be reduced and consideration should be given to introducing countercyclical elements into the regulatory capital regime.

The regulatory capital and accounting frameworks should be modified in several ways to reduce their procyclicality. First, the regulatory capital regime should require banking firms to hold a buffer over their minimum capital requirements during good economic times (to be available for drawing down in bad economic times).

There’s a possibility that good times and bad times might become something of a political football, isn’t there? We should not forget that one reason why the FDIC has to increase rates charged to banks right now is because Congress gave a long contribution holiday for political reasons.

I am gratified to see:

Finally, we should examine the merits of providing favorable regulatory capital treatment for, or requiring some banking firms (such as Tier 1 FHCs) to issue, appropriately designed contingent capital instruments – including (i) long-term debt instruments that convert to equity capital in stressed conditions; or (ii) fully secured insurance arrangements that pay out to banking firms in stressed conditions.

See my essay on insurers’ risk transformation.

Core Principle #6: Banking firms should be subject to a simple, non-risk-based leverage constraint.

To mitigate potential adverse effects from an overly simplistic leverage constraint, the constraint should at a minimum incorporate off-balance sheet items.

They couldn’t get the Europeans to agree to the leverage ratio last time, and now they’re MAD!

Core Principle #7: Banking firms should be subject to a conservative, explicit liquidity standard.

The liquidity regime should be independent from the regulatory capital regime. The liquidity regime should make both individual banking firms and the broader financial system more resilient by limiting the externalities that banking firms can create by taking on imprudent levels and forms of funding mismatch. Introducing strict but flexible liquidity regulations would reduce the chances of destabilizing runs by enhancing the ability of debtor banking firms to withstand withdrawals of short-term funding and by making creditor banking firms less likely to withdraw short-term funding from other firms.

Much of this would be addressed by eliminating the favourable risk-weighting applied to inter-bank holdings, as noted above.

Core Principle #8: Stricter capital requirements for the banking system should not result in the re-emergence of an under-regulated non-bank financial sector that poses a threat to financial stability.

Money market mutual funds will be subject to tighter regulation, including tighter regulation of their credit and liquidity risks.

Basically, they want to regulate everything that moves, which will have bad effects on the economy. They should spend more time properly regulating the boundary between banks and non-banks, so that shadow-bank collapses will not have a severe effect on the highly regulated core banking system.

MAPF Portfolio Composition: August 2009

September 3rd, 2009

Turnover slowed markedly in August to a little under 60%. This was both a normal summer slowdown and the effect of a sharply rising market in PerpetualDiscounts, which often has the effect of lifting all boats equally.

Trades were, as ever, triggered by a desire to exploit transient mispricing in the preferred share market (which may the thought of as “selling liquidity”), rather than any particular view being taken on market direction, sectoral performance or credit anticipation.

MAPF Sectoral Analysis 2009-8-31
HIMI Indices Sector Weighting YTW ModDur
Ratchet 0% N/A N/A
FixFloat 0% N/A N/A
Floater 0% N/A N/A
OpRet 0% N/A N/A
SplitShare 10.4% (+0.3) 7.58%% 7.12
Interest Rearing 0% N/A N/A
PerpetualPremium 0.9% (+0.3) 3.4% 1.76
PerpetualDiscount 67.2% (-4.7) 5.71% 14.40
Fixed-Reset 17.4% (+6.1) 4.03% 4.12
Scraps (OpRet) 5.2% (0) 10.71% 5.98
Cash -0.8% (-1.5) 0.00% 0.00
Total 100% 5.85% 11.45
Totals and changes will not add precisely due to rounding. Bracketted figures represent change from July month-end. Cash is included in totals with duration and yield both equal to zero.

The “total” reflects the un-leveraged total portfolio (i.e., cash is included in the portfolio calculations and is deemed to have a duration and yield of 0.00.). MAPF will often have relatively large cash balances, both credit and debit, to facilitate trading. Figures presented in the table have been rounded to the indicated precision.

The small change in the sectoral distribution was due to some scrappy trades generated by the rapid increase in price of PerpetualDiscounts. In addition to changing yield relationships, this price rise was sufficient to cause the issuer’s redemption option to have an effect on valuation.

Trades Contributing to
the Shift from PerpetualDiscount to FixedReset
August, 2009
Date PWF.PR.F NA.PR.O TD.PR.I RY.PR.R
7/31
Bid
21.20 27.64 27.53 27.47
8/17 Sold
23.10
Bought
27.92
   
8/21   Sold
28.00
Bought
27.75
 
8/25   Sold
27.80
Sold
27.63
Bought
27.50
8/31
Closing Bid
22.93 27.81 27.75 27.60
Dividends
Ex-Date
       
This is an attempt to show fairly the effect of numerous trades in tabular form. The trades shown are not necessarily precise dollar-for-dollar swaps. Trade details will be released on the main MAPF web page in the future.

This is not the most immediately successful sequence of trades reported for MAPF, but it’s hardly a disaster! All I can do is trade the odds and recognize that not every trade will work out.

Credit distribution is:

MAPF Credit Analysis 2009-8-31
DBRS Rating Weighting
Pfd-1 0 (-0.3)
Pfd-1(low) 80.6% (-0.9)
Pfd-2(high) 3.8% (+1.8)
Pfd-2 1.3% (+1.0)
Pfd-2(low) 10.1% (+0.3)
Pfd-3(high) 5.2% (0)
Cash -0.8% (-1.5)
Totals will not add precisely due to rounding. Bracketted figures represent change from July month-end.

So credit quality is essentiall unchanged, while liquidity has improved somewhat:

Liquidity Distribution is:

MAPF Liquidity Analysis 2009-8-31
Average Daily Trading Weighting
<$50,000 0.3% (0)
$50,000 – $100,000 14.9% (+3.7)
$100,000 – $200,000 2.5% (-3.3)
$200,000 – $300,000 37.7% (-11.9)
>$300,000 45.6% (+13.7)
Cash -0.8% (-1.5)
Totals will not add precisely due to rounding. Bracketted figures represent change from June month-end.

MAPF is, of course, Malachite Aggressive Preferred Fund, a “unit trust” managed by Hymas Investment Management Inc. Further information and links to performance, audited financials and subscription information are available the fund’s web page. A “unit trust” is like a regular mutual fund, but is sold by offering memorandum rather than prospectus. This is cheaper, but means subscription is restricted to “accredited investors” (as defined by the Ontario Securities Commission) and those who subscribe for $150,000+. Fund past performances are not a guarantee of future performance. You can lose money investing in MAPF or any other fund.

A similar portfolio composition analysis has been performed on the Claymore Preferred Share ETF (symbol CPD) as of August 17. When comparing CPD and MAPF:

  • MAPF credit quality is better
  • MAPF liquidity is a little better
  • MAPF Yield is higher
  • Weightings in
    • MAPF is much more exposed to PerpetualDiscounts
    • MAPF is much less exposed to Operating Retractibles
    • MAPF is more exposed to SplitShares
    • MAPF is less exposed to FixFloat / Floater / Ratchet
    • MAPF weighting in FixedResets is much lower

September 2, 2009

September 2nd, 2009

The Boston Fed has prepared a foreclosure & house-price graphic for Massachussets:

This interactive graphic, showing changing patterns in foreclosure
rates and subprime mortgage originations across Massachusetts cities and towns since 1990 and their association with house-price changes, has been updated with 2008 data and enhanced with a new set of maps displaying the changing pattern of house-price changes from 1990 to 2008.

The slow pullback in the preferred share market continued, with PerpetualDiscounts losing 17bp and FixedResets down 7bp on the day. PerpetualDiscounts closed yielding 5.73%, equivalent to 8.02% interest at the standard equivalency factor of 1.4x. Long corporates now yield about 5.9%, so the pre-tax interest-equivalent spread is now roughly 210bp, up 10bp from August 31.

HIMIPref™ Preferred Indices
These values reflect the December 2008 revision of the HIMIPref™ Indices

Values are provisional and are finalized monthly
Index Mean
Current
Yield
(at bid)
Median
YTW
Median
Average
Trading
Value
Median
Mod Dur
(YTW)
Issues Day’s Perf. Index Value
Ratchet 0.00 % 0.00 % 0 0.00 0 -0.4003 % 1,440.8
FixedFloater 5.88 % 4.14 % 60,667 18.41 1 -2.6316 % 2,612.5
Floater 2.53 % 2.15 % 32,514 22.07 4 -0.4003 % 1,800.0
OpRet 4.86 % -11.31 % 128,074 0.09 15 -0.1249 % 2,279.0
SplitShare 6.44 % 6.60 % 1,204,317 4.08 2 -0.4204 % 2,052.5
Interest-Bearing 0.00 % 0.00 % 0 0.00 0 -0.1249 % 2,084.0
Perpetual-Premium 5.76 % 5.43 % 153,077 2.59 12 -0.5180 % 1,880.2
Perpetual-Discount 5.69 % 5.73 % 192,819 14.33 59 -0.1668 % 1,806.1
FixedReset 5.50 % 4.06 % 476,566 4.10 40 -0.0748 % 2,103.6
Performance Highlights
Issue Index Change Notes
BAM.PR.G FixedFloater -2.63 % YTW SCENARIO
Maturity Type : Limit Maturity
Maturity Date : 2039-09-02
Maturity Price : 25.00
Evaluated at bid price : 18.50
Bid-YTW : 4.14 %
GWO.PR.G Perpetual-Discount -2.35 % YTW SCENARIO
Maturity Type : Limit Maturity
Maturity Date : 2039-09-02
Maturity Price : 22.27
Evaluated at bid price : 22.42
Bid-YTW : 5.80 %
ENB.PR.A Perpetual-Premium -2.11 % YTW SCENARIO
Maturity Type : Call
Maturity Date : 2009-10-02
Maturity Price : 25.00
Evaluated at bid price : 25.06
Bid-YTW : 2.77 %
SLF.PR.D Perpetual-Discount -1.48 % YTW SCENARIO
Maturity Type : Limit Maturity
Maturity Date : 2039-09-02
Maturity Price : 19.32
Evaluated at bid price : 19.32
Bid-YTW : 5.77 %
BAM.PR.I OpRet -1.46 % YTW SCENARIO
Maturity Type : Soft Maturity
Maturity Date : 2013-12-30
Maturity Price : 25.00
Evaluated at bid price : 25.64
Bid-YTW : 5.12 %
BMO.PR.J Perpetual-Discount -1.43 % YTW SCENARIO
Maturity Type : Limit Maturity
Maturity Date : 2039-09-02
Maturity Price : 20.65
Evaluated at bid price : 20.65
Bid-YTW : 5.49 %
RY.PR.W Perpetual-Discount -1.36 % YTW SCENARIO
Maturity Type : Limit Maturity
Maturity Date : 2039-09-02
Maturity Price : 22.34
Evaluated at bid price : 22.50
Bid-YTW : 5.48 %
RY.PR.H Perpetual-Premium -1.12 % YTW SCENARIO
Maturity Type : Call
Maturity Date : 2017-06-23
Maturity Price : 25.00
Evaluated at bid price : 25.55
Bid-YTW : 5.36 %
BAM.PR.K Floater -1.12 % YTW SCENARIO
Maturity Type : Limit Maturity
Maturity Date : 2039-09-02
Maturity Price : 12.40
Evaluated at bid price : 12.40
Bid-YTW : 3.21 %
TD.PR.Q Perpetual-Premium -1.03 % YTW SCENARIO
Maturity Type : Limit Maturity
Maturity Date : 2039-09-02
Maturity Price : 24.81
Evaluated at bid price : 25.04
Bid-YTW : 5.65 %
W.PR.J Perpetual-Discount 1.13 % YTW SCENARIO
Maturity Type : Limit Maturity
Maturity Date : 2039-09-02
Maturity Price : 23.86
Evaluated at bid price : 24.11
Bid-YTW : 5.89 %
Volume Highlights
Issue Index Shares
Traded
Notes
BNS.PR.P FixedReset 105,025 RBC crossed 100,000 at 26.04.
YTW SCENARIO
Maturity Type : Call
Maturity Date : 2013-05-25
Maturity Price : 25.00
Evaluated at bid price : 26.09
Bid-YTW : 3.87 %
BNS.PR.O Perpetual-Premium 65,030 RBC crossed 62,000 at 25.20.
YTW SCENARIO
Maturity Type : Call
Maturity Date : 2017-05-26
Maturity Price : 25.00
Evaluated at bid price : 25.15
Bid-YTW : 5.63 %
MFC.PR.E FixedReset 63,160 RBC crossed 50,000 at 26.50.
YTW SCENARIO
Maturity Type : Call
Maturity Date : 2014-10-19
Maturity Price : 25.00
Evaluated at bid price : 26.50
Bid-YTW : 4.27 %
BAM.PR.N Perpetual-Discount 58,050 YTW SCENARIO
Maturity Type : Limit Maturity
Maturity Date : 2039-09-02
Maturity Price : 18.28
Evaluated at bid price : 18.28
Bid-YTW : 6.64 %
RY.PR.Y FixedReset 38,670 YTW SCENARIO
Maturity Type : Call
Maturity Date : 2014-12-24
Maturity Price : 25.00
Evaluated at bid price : 27.55
Bid-YTW : 4.03 %
BAM.PR.B Floater 32,265 YTW SCENARIO
Maturity Type : Limit Maturity
Maturity Date : 2039-09-02
Maturity Price : 12.40
Evaluated at bid price : 12.40
Bid-YTW : 3.21 %
There were 34 other index-included issues trading in excess of 10,000 shares.

WFS.PR.A: Capital Unit Dividend Still Suspended

September 2nd, 2009

Mulvihill has announced:

World Financial Split Corp. (the “Fund”) has declared its quarterly distribution of $0.13125 on each of its Preferred Shares payable September 30, 2009 to shareholders of record as of September 15, 2009. To the extent that any portion of the distributions are ordinary taxable dividends and not capital gains dividends, they will be eligible dividends. Distributions on its Class A shares continue to be suspended in accordance with the terms of the offering prospectus, which states “No distribution will be paid on the Class A shares if (i) the distributions payable on the Preferred shares are in arrears; or (ii) after the payment of the distribution by the Company, the NAV per unit would be less than $15.00.

Asset Coverage as of August 27 was 1.3+:1.

The Semi-Annual Report of 2009-6-30 makes no mention of the ballyhooed issuer bid, so we may assume that idea is inoperable, despite the significant discount of market price to NAV. Investors were not so shy, however: nearly 20% of the funds total liabilities (that is, including equity) are on the books as being “Redemptions Payable” on the June 30 statements. The number of units outstanding dropped to 9,091,210 on June 30 from 11,835,359 on Dec. 31, 2008.

Income coverage is horrible, with a mere $290,924 net investment income available to cover $1,143,513 in expenses and $3,012,518 in preferred share distributions.

WFS.PR.A was last mentioned on PrefBlog when it was upgraded to Pfd-4 by DBRS. WFS.PR.A is tracked by HIMIPref™ but has been relegated to the “Scraps” index on credit concerns.