Archive for March, 2010

March 22, 2010

Monday, March 22nd, 2010

The Office of the Chief Actuary (part of OSFI) has released its eighth actuarial study, titled Technical Aspects of the Financing of the Canada Pension Plan, complete with OSFI’s usual dollop of patronizing paternalistic Panglossian pablum:

The review panel expressed concern that most readers would be unduly distressed that the Canada Pension Plan (CPP or the “Plan”) is not expected to ever be even one-third funded. As such, the panel recommended minimizing or removing “point-in-time” funded status indicators from the actuarial report and to focus instead on the fact that the adequacy and stability of the steady-state contribution rate is the critical tool for judging the sustainability of the CPP, and that the funded ratio (ratio of assets to liabilities), if kept in the report, is at most an indicator of the projected mprovement in the funded level. This paper was thus written with the purpose of analyzing and comparing the financing of the CPP using different measures, in particular, the unfunded obligations (liabilities less assets) and funded ratios of the Plan under various closed and open group methodologies, including a methodology more consistent with that used for occupational defined benefit pension plans.

Let’s donate the Chief Actuary to Europe – he can help advise them on what to do about those CDS-trading terrorists, who caused the Greek crisis all by themselves.

Speaking of the Greek crisis:

Europe’s stalemate over possible aid for debt-encumbered Greece deepened as European Central Bank President Jean-Claude Trichet spoke out against offering low- interest loans for which the Greek government has pressed.

Trichet’s demand for stringent terms and German Chancellor Angela Merkel’s push for sanctions against nations that breach deficit limits heightened the chance that Greece will leave a March 25-26 summit empty-handed. That could force Prime Minister George Papandreou to decide whether he’s ready to fulfill his threat and turn instead to the International Monetary Fund.

Looks like there might finally be some action on the Fannie & Freddie front:

U.S. Treasury Secretary Timothy F. Geithner said the government should end the “ambiguity” over the government’s involvement in mortgage finance companies Fannie Mae and Freddie Mac.

“Private gains can no longer be supported by the umbrella of public protection, capital standards must be higher and excessive risk-taking must be appropriately restrained,” Geithner said in testimony prepared for the House Financial Services Committee that was obtained today by Bloomberg News. The hearing is scheduled for tomorrow at 10 a.m. in Washington.

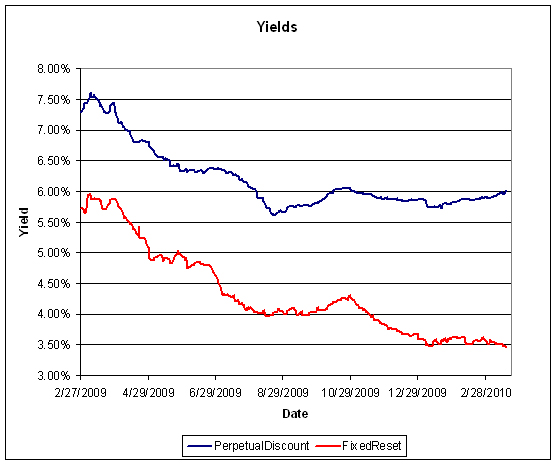
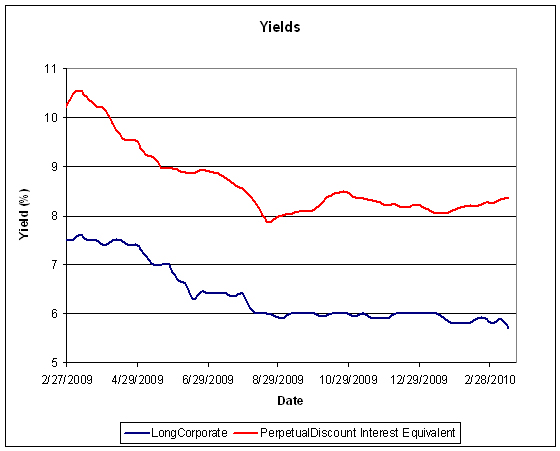
Volume jumped up as PerpetualDiscounts got hammered again, losing 36bp, while FixedResets continued to show strength, gaining 3bp which took yields on the latter down to 3.42%. Volatility was also pretty good.

HIMIPref™ Preferred Indices
These values reflect the December 2008 revision of the HIMIPref™ Indices

Values are provisional and are finalized monthly
Index Mean
Current
Yield
(at bid)
Median
YTW
Median
Average
Trading
Value
Median
Mod Dur
(YTW)
Issues Day’s Perf. Index Value
Ratchet 2.69 % 2.77 % 56,523 20.62 1 -0.0476 % 2,054.7
FixedFloater 5.09 % 3.21 % 45,194 19.92 1 -0.6047 % 3,106.8
Floater 1.95 % 1.74 % 47,415 23.19 4 0.1982 % 2,370.0
OpRet 4.90 % 2.84 % 96,061 0.19 13 -0.0328 % 2,309.2
SplitShare 6.40 % 6.41 % 125,527 3.67 2 0.1769 % 2,131.9
Interest-Bearing 0.00 % 0.00 % 0 0.00 0 -0.0328 % 2,111.5
Perpetual-Premium 5.93 % 6.02 % 120,049 13.78 7 -0.4554 % 1,875.9
Perpetual-Discount 5.96 % 6.00 % 181,177 13.88 71 -0.3649 % 1,772.8
FixedReset 5.35 % 3.42 % 346,549 3.68 43 0.0339 % 2,206.4
Performance Highlights
Issue Index Change Notes
HSB.PR.D Perpetual-Discount -2.72 % YTW SCENARIO
Maturity Type : Limit Maturity
Maturity Date : 2040-03-22
Maturity Price : 20.35
Evaluated at bid price : 20.35
Bid-YTW : 6.18 %
TD.PR.O Perpetual-Discount -1.84 % YTW SCENARIO
Maturity Type : Limit Maturity
Maturity Date : 2040-03-22
Maturity Price : 21.30
Evaluated at bid price : 21.30
Bid-YTW : 5.79 %
SLF.PR.A Perpetual-Discount -1.57 % YTW SCENARIO
Maturity Type : Limit Maturity
Maturity Date : 2040-03-22
Maturity Price : 19.40
Evaluated at bid price : 19.40
Bid-YTW : 6.16 %
BNS.PR.K Perpetual-Discount -1.34 % YTW SCENARIO
Maturity Type : Limit Maturity
Maturity Date : 2040-03-22
Maturity Price : 20.55
Evaluated at bid price : 20.55
Bid-YTW : 5.94 %
GWO.PR.H Perpetual-Discount -1.30 % YTW SCENARIO
Maturity Type : Limit Maturity
Maturity Date : 2040-03-22
Maturity Price : 19.75
Evaluated at bid price : 19.75
Bid-YTW : 6.17 %
GWL.PR.O Perpetual-Premium -1.18 % YTW SCENARIO
Maturity Type : Limit Maturity
Maturity Date : 2040-03-22
Maturity Price : 24.87
Evaluated at bid price : 25.20
Bid-YTW : 4.79 %
TD.PR.P Perpetual-Discount -1.07 % YTW SCENARIO
Maturity Type : Limit Maturity
Maturity Date : 2040-03-22
Maturity Price : 22.89
Evaluated at bid price : 23.05
Bid-YTW : 5.78 %
SLF.PR.B Perpetual-Discount -1.07 % YTW SCENARIO
Maturity Type : Limit Maturity
Maturity Date : 2040-03-22
Maturity Price : 19.45
Evaluated at bid price : 19.45
Bid-YTW : 6.20 %
IAG.PR.E Perpetual-Premium -1.03 % YTW SCENARIO
Maturity Type : Limit Maturity
Maturity Date : 2040-03-22
Maturity Price : 24.69
Evaluated at bid price : 24.91
Bid-YTW : 6.04 %
MFC.PR.C Perpetual-Discount 1.07 % YTW SCENARIO
Maturity Type : Limit Maturity
Maturity Date : 2040-03-22
Maturity Price : 18.90
Evaluated at bid price : 18.90
Bid-YTW : 6.00 %
Volume Highlights
Issue Index Shares
Traded
Notes
BAM.PR.N Perpetual-Discount 72,991 YTW SCENARIO
Maturity Type : Limit Maturity
Maturity Date : 2040-03-22
Maturity Price : 17.43
Evaluated at bid price : 17.43
Bid-YTW : 6.86 %
RY.PR.R FixedReset 71,140 National crossed 49,500 at 28.05.
YTW SCENARIO
Maturity Type : Call
Maturity Date : 2014-03-26
Maturity Price : 25.00
Evaluated at bid price : 27.97
Bid-YTW : 3.26 %
RY.PR.X FixedReset 67,137 RBC crossed 28,000 at 28.10.
YTW SCENARIO
Maturity Type : Call
Maturity Date : 2014-09-23
Maturity Price : 25.00
Evaluated at bid price : 28.10
Bid-YTW : 3.44 %
CM.PR.L FixedReset 65,521 National crossed 49,300 at 28.43.
YTW SCENARIO
Maturity Type : Call
Maturity Date : 2014-05-30
Maturity Price : 25.00
Evaluated at bid price : 28.46
Bid-YTW : 3.24 %
TD.PR.K FixedReset 44,670 National crossed blocks of 19,400 and 10,000, both at 28.35.
YTW SCENARIO
Maturity Type : Call
Maturity Date : 2014-08-30
Maturity Price : 25.00
Evaluated at bid price : 28.36
Bid-YTW : 3.25 %
NA.PR.N FixedReset 40,300 HSBC sold 10,000 to RBC at 26.55.
YTW SCENARIO
Maturity Type : Call
Maturity Date : 2013-09-14
Maturity Price : 25.00
Evaluated at bid price : 26.51
Bid-YTW : 3.65 %
There were 62 other index-included issues trading in excess of 10,000 shares.

PrefBlog Hacked, Fixed

Sunday, March 21st, 2010

Users of PrefBlog on March 21 will have noticed that they became redirected to various advertising sites in the course of PrefBlog’s loading.

The site was compromised early in the day (thanks to Assiduous Reader GA for letting me know) and now, late in the day, the hack has been fixed and the vulnerability plugged – at least as far as I know.

I regret any inconvenience.

March 19, 2010

Saturday, March 20th, 2010

Spend-Every-Penny gave a speech to the UK Chamber of Commerce deemed to be too boring for the Department of Finance website. Highlights were:

“Issues like the concept of ‘too big to fail’ and ‘systemically important’ — quite frankly our view is that these are not useful discussions, and at the end of the day that these concepts are not workable.”

“We are against capital tax, we are against the tax on financial transactions, we are prepared to consider certain issues on contingent capital.”

“When you look at the causes of the crisis, one of the clear causes was excessive leverage, not only in some of the American institutions, but also some of the European institutions.

“Our primary concern overall is to get the leverage rules right and to try and get an agreement on that among our colleagues.”

Boston Fed boss Eric Rosengren also endorsed the idea when giving a speech on March 3, but only when answering a question; it was not part of his prepared remarks.

There was a good long article on the US TruPS CDO market today, albeit a little short on what I consider the interesting detail:

Hildene is part of a lawsuit seeking to prevent a TPG Credit Management LP affiliate from buying trust preferred securities from CDOs for pennies on the dollar. The firm tried to fire Cohen & Co. from managing deals in which Hildene invests. It’s attempting to block BankAtlantic Bancorp from retiring debt held by CDOs at a fraction of face value.

The moves by TPG Credit and BankAtlantic have in part kept the $50 billion market for CDOs backed by the trust securities, known as TruPS, from rebounding, according to Citigroup Inc., even as credit markets recover from the biggest financial crisis since the Great Depression. Since 2000, 1,813 banks and thrifts sold TruPS and other debt that were packaged inside the deals, according to Fitch Ratings.

Financial institutions relied on TruPS before credit markets began to seize up in 2007 because interest on the securities is paid from pre-tax income and may be suspended without penalty. The securities, which rank between senior bonds and common equity for repayment in a bankruptcy, also count toward regulatory capital requirements. New York-based Citigroup, 27 percent owned by the U.S. government, sold $2 billion of TruPS last week after repaying bailout funds.

Community banks need the CDO market to revive to issue TruPS because they sell debt in increments of as little as $10 million, which insurers or mutual funds won’t buy. CDOs bought the most TruPS issued by smaller banks before credit markets froze, according to Citigroup.

European CDS spreads are increasing:

French President Nicolas Sarkozy is opposing Germany’s push for an International Monetary Fund loan to Greece, favoring a European solution for the nation as it struggles to lower the region’s biggest budget deficit. Greek bonds fell as the EU divisions widened.

Swaps on Greece jumped 22 basis points to 337.5, according to CMA DataVision prices. Contracts on Portugal climbed 14 to 138, Ireland rose 11 to 135.5, Italy increased 7.5 to 105.5 and Spain was up 11 basis points at 112. These countries are collectively known as the PIIGS.

PerpetualDiscounts got hammered today, losing 52bp, while FixedResets gained 7bp to set a new all-time yield low for that index. Volume was good, and there were a lot of entries on the performance highlights. Volatility = Good!

HIMIPref™ Preferred Indices
These values reflect the December 2008 revision of the HIMIPref™ Indices

Values are provisional and are finalized monthly
Index Mean
Current
Yield
(at bid)
Median
YTW
Median
Average
Trading
Value
Median
Mod Dur
(YTW)
Issues Day’s Perf. Index Value
Ratchet 2.69 % 2.77 % 56,850 20.62 1 -2.2791 % 2,055.7
FixedFloater 5.06 % 3.17 % 44,478 19.97 1 0.9390 % 3,125.7
Floater 1.95 % 1.74 % 49,102 23.20 4 -1.1266 % 2,365.3
OpRet 4.90 % 3.22 % 100,045 0.20 13 0.0119 % 2,309.9
SplitShare 6.41 % 6.39 % 126,122 3.68 2 -0.4622 % 2,128.1
Interest-Bearing 0.00 % 0.00 % 0 0.00 0 0.0119 % 2,112.2
Perpetual-Premium 5.91 % 5.96 % 117,322 6.86 7 -0.1932 % 1,884.5
Perpetual-Discount 5.94 % 6.01 % 178,210 13.87 71 -0.5215 % 1,779.3
FixedReset 5.35 % 3.46 % 350,686 3.69 43 0.0679 % 2,205.7
Performance Highlights
Issue Index Change Notes
TRI.PR.B Floater -3.13 % YTW SCENARIO
Maturity Type : Limit Maturity
Maturity Date : 2040-03-19
Maturity Price : 22.98
Evaluated at bid price : 23.25
Bid-YTW : 1.66 %
BAM.PR.E Ratchet -2.28 % YTW SCENARIO
Maturity Type : Limit Maturity
Maturity Date : 2040-03-19
Maturity Price : 21.68
Evaluated at bid price : 21.01
Bid-YTW : 2.77 %
BMO.PR.L Perpetual-Discount -1.50 % YTW SCENARIO
Maturity Type : Limit Maturity
Maturity Date : 2040-03-19
Maturity Price : 24.15
Evaluated at bid price : 24.36
Bid-YTW : 6.01 %
SLF.PR.B Perpetual-Discount -1.45 % YTW SCENARIO
Maturity Type : Limit Maturity
Maturity Date : 2040-03-19
Maturity Price : 19.66
Evaluated at bid price : 19.66
Bid-YTW : 6.13 %
SLF.PR.E Perpetual-Discount -1.34 % YTW SCENARIO
Maturity Type : Limit Maturity
Maturity Date : 2040-03-19
Maturity Price : 18.43
Evaluated at bid price : 18.43
Bid-YTW : 6.14 %
BNS.PR.M Perpetual-Discount -1.31 % YTW SCENARIO
Maturity Type : Limit Maturity
Maturity Date : 2040-03-19
Maturity Price : 19.61
Evaluated at bid price : 19.61
Bid-YTW : 5.84 %
BNS.PR.N Perpetual-Discount -1.27 % YTW SCENARIO
Maturity Type : Limit Maturity
Maturity Date : 2040-03-19
Maturity Price : 22.49
Evaluated at bid price : 22.63
Bid-YTW : 5.89 %
RY.PR.D Perpetual-Discount -1.21 % YTW SCENARIO
Maturity Type : Limit Maturity
Maturity Date : 2040-03-19
Maturity Price : 19.60
Evaluated at bid price : 19.60
Bid-YTW : 5.81 %
BNS.PR.L Perpetual-Discount -1.21 % YTW SCENARIO
Maturity Type : Limit Maturity
Maturity Date : 2040-03-19
Maturity Price : 19.63
Evaluated at bid price : 19.63
Bid-YTW : 5.83 %
GWO.PR.H Perpetual-Discount -1.19 % YTW SCENARIO
Maturity Type : Limit Maturity
Maturity Date : 2040-03-19
Maturity Price : 20.01
Evaluated at bid price : 20.01
Bid-YTW : 6.09 %
PWF.PR.K Perpetual-Discount -1.17 % YTW SCENARIO
Maturity Type : Limit Maturity
Maturity Date : 2040-03-19
Maturity Price : 20.26
Evaluated at bid price : 20.26
Bid-YTW : 6.21 %
RY.PR.G Perpetual-Discount -1.06 % YTW SCENARIO
Maturity Type : Limit Maturity
Maturity Date : 2040-03-19
Maturity Price : 19.55
Evaluated at bid price : 19.55
Bid-YTW : 5.82 %
RY.PR.C Perpetual-Discount -1.05 % YTW SCENARIO
Maturity Type : Limit Maturity
Maturity Date : 2040-03-19
Maturity Price : 19.83
Evaluated at bid price : 19.83
Bid-YTW : 5.87 %
BNA.PR.C SplitShare -1.03 % YTW SCENARIO
Maturity Type : Hard Maturity
Maturity Date : 2019-01-10
Maturity Price : 25.00
Evaluated at bid price : 19.31
Bid-YTW : 8.07 %
CM.PR.J Perpetual-Discount -1.02 % YTW SCENARIO
Maturity Type : Limit Maturity
Maturity Date : 2040-03-19
Maturity Price : 19.32
Evaluated at bid price : 19.32
Bid-YTW : 5.92 %
SLF.PR.C Perpetual-Discount -1.02 % YTW SCENARIO
Maturity Type : Limit Maturity
Maturity Date : 2040-03-19
Maturity Price : 18.43
Evaluated at bid price : 18.43
Bid-YTW : 6.07 %
BAM.PR.H OpRet 1.63 % YTW SCENARIO
Maturity Type : Call
Maturity Date : 2010-04-18
Maturity Price : 25.50
Evaluated at bid price : 25.50
Bid-YTW : 3.22 %
Volume Highlights
Issue Index Shares
Traded
Notes
TRP.PR.B FixedReset 123,584 Recent new issue.
YTW SCENARIO
Maturity Type : Limit Maturity
Maturity Date : 2040-03-19
Maturity Price : 24.91
Evaluated at bid price : 24.96
Bid-YTW : 3.94 %
CM.PR.K FixedReset 82,370 RBC crossed 81,000 at 26.95.
YTW SCENARIO
Maturity Type : Call
Maturity Date : 2014-08-30
Maturity Price : 25.00
Evaluated at bid price : 26.95
Bid-YTW : 3.64 %
TD.PR.G FixedReset 66,983 Desjardins crossed 50,000 at 28.20.
YTW SCENARIO
Maturity Type : Call
Maturity Date : 2014-05-30
Maturity Price : 25.00
Evaluated at bid price : 28.29
Bid-YTW : 3.16 %
TD.PR.K FixedReset 66,865 Desjardins crossed 49,300 at 28.35.
YTW SCENARIO
Maturity Type : Call
Maturity Date : 2014-08-30
Maturity Price : 25.00
Evaluated at bid price : 28.36
Bid-YTW : 3.24 %
RY.PR.X FixedReset 63,491 Nesbitt crossed 50,000 at 28.07.
YTW SCENARIO
Maturity Type : Call
Maturity Date : 2014-09-23
Maturity Price : 25.00
Evaluated at bid price : 28.10
Bid-YTW : 3.43 %
TD.PR.M OpRet 52,700 Desjardins crossed 50,000 at 26.00.
YTW SCENARIO
Maturity Type : Call
Maturity Date : 2010-05-30
Maturity Price : 25.75
Evaluated at bid price : 26.01
Bid-YTW : 2.50 %
There were 47 other index-included issues trading in excess of 10,000 shares.

FixedReset Index Sets New Yield Low

Saturday, March 20th, 2010

A new low in yield was set by the FixedReset sub-index today.

Some charts will illustrate:


Click for Big

In the past year, FixedReset yields have declined from 5.72% to 3.46%, while PerpetualDiscounts have declined from 7.29% to 6.01%. Thus, the spread has widened from 157bp to 255bp – although it is dangerous and misleading to talk of the spread between these two classes, since FixedResets may now, by and large, be confidently expected to be called at the first opportunity. Thus, the basis risk that existing at the beginning of the period (more inclined to inflation protection) is not the same as the basis risk that exists now (more inclined to term spread).


Click for Big

Duration and positive carry have enabled PerpetualDiscounts to outperform in the face of widening. At the current spread of 255bp and Modified Duration of 16.7, and assuming a constant future yield on FixedResets, the breakeven change in spread is a widening of about 15bp p.a.


Click for Big

The past year’s outperformance by FixedResets in yield terms is consistent with the increase in the Breakeven Inflation Rate on Long Nominals vs. Long RRBs.


Click for Big

… and longer term data is consistent with the idea that this is finished.

No chart for this one, but LongCorporate investors do not share any inflation fears that PerpetualDiscount investors might have; the spread between interest-equivalent PerpetualDiscounts and Long Corporates (the Seniority Spread) has increased dramatically of late.

Update, 2010-3-20: OK, here are some more charts:


Click for Big


Click for Big


Click for big


Click for big

March 18, 2010

Thursday, March 18th, 2010

Brinksmanship regarding the Greek bail-out is getting … er … brinkier:

Greek Prime Minister George Papandreou set a one-week deadline for the European Union to craft a financial aid mechanism for Greece, challenging Germany to give up its doubts about a rescue package.

Papandreou said he may turn to the International Monetary Fund to overcome Greece’s debt crisis unless leaders agree to set up a lending facility at a summit March 25-26. The IMF option has already been dismissed by European Central Bank President Jean-Claude Trichet and French President Nicolas Sarkozy, who say it would show the EU can’t solve its own crises.

Papandreou toyed with the idea of going to the Washington- based fund, saying today that Greece is already living in an IMF-style fiscal corset without the financing that goes along with it.

“We are under a basically IMF program,” he told a European Parliament committee earlier. “We don’t want to be in a situation where we have the worst of the IMF, if you like, and none of the advantages of the euro.”

The IMF stands ready to respond to a Greek aid appeal, which hasn’t come yet, spokeswoman Caroline Atkinson told reporters in Washington today. Papandreou said he still prefers a European solution and that the EU announcing more explicit support for Greece would be enough to bring down borrowing costs without the need to actually tap emergency funds.

That poor little boy who said the Emperor had no clothes! Now he’s a terrorist!

Germany’s Finance Minister Wolfgang Schaeuble told the Bundestag on March 16 that the country may have to consider ordering “intelligence agencies to set up surveillance of who is getting together with whom for which kinds of speculative processes, and where” to protect the euro.

“I find it sinister and silly, it is a complete overreaction,” said Philip Whyte of the Centre for European Reform, a pro-European Union research institute in London. “There is a certain school of thought in continental Europe that everything is always the fault of hedge funds.” Schaeuble’s comments reflected “a longstanding paranoia about the Anglo-Saxon model of capitalism.”

European politicians blamed speculators after the euro tumbled against the dollar and the cost of insuring Greek government debt rose by a third this year, causing budget cuts that triggered street protests in Athens. Greek Prime Minister George Papandreou and French President Nicolas Sarkozy said that trading in credit default swaps exacerbated the crisis.

I’ve previously noted international problems in bank regulatory reform … but there are also national problems:

If the Senate can produce sweeping bank-reform legislation, expect House and Senate lawmakers to continue squabbling at least a year more or longer, said House Republican Leader John Boehner on Wednesday.

“If the Senate is able to produce a bill, I think it’s just as likely that we’ll be talking about the same issue a year from now as we are right now,” Boehner, R-Ohio, told an enthusiastic crowd of bankers at the American Bankers Association government relations summit.

Senate Banking Committee Chairman Christopher Dodd, D-Conn., on Monday introduced a revised bank-reform bill without Republican support. He plans to have the panel vote on the bill next week and hopes to have the bill considered by the Senate in April.

“I don’t know how they ever come to an agreement on some kind of a bill they can bring back to both houses and pass,” Boehner said.

Summers has defended his staff.

Good volume in the Canadian preferred share market today, led by the two TD OperatingRetractibles, with the selling dominated by National Bank. There was also a decent bit more price volatility, with six entries on the Performance Highlights, while PerpetualDiscounts lost 3bp at the same time as FixedResets gained 8bp. That took the FixedReset median weighted average yield down to 3.46%, equal (to five significant figures) to its all-time low on January 11.

HIMIPref™ Preferred Indices
These values reflect the December 2008 revision of the HIMIPref™ Indices

Values are provisional and are finalized monthly
Index Mean
Current
Yield
(at bid)
Median
YTW
Median
Average
Trading
Value
Median
Mod Dur
(YTW)
Issues Day’s Perf. Index Value
Ratchet 2.63 % 2.78 % 56,870 20.84 1 0.0000 % 2,103.6
FixedFloater 5.11 % 3.22 % 44,990 19.91 1 0.6616 % 3,096.6
Floater 1.93 % 1.73 % 48,141 23.22 4 -0.0734 % 2,392.2
OpRet 4.90 % 3.15 % 104,193 0.77 13 0.0149 % 2,309.6
SplitShare 6.38 % 6.37 % 125,850 3.69 2 0.7988 % 2,138.0
Interest-Bearing 0.00 % 0.00 % 0 0.00 0 0.0149 % 2,111.9
Perpetual-Premium 5.89 % 5.93 % 118,170 6.86 7 -0.1758 % 1,888.1
Perpetual-Discount 5.91 % 5.97 % 174,516 13.93 71 -0.0308 % 1,788.6
FixedReset 5.35 % 3.46 % 347,591 3.69 43 0.0824 % 2,204.2
Performance Highlights
Issue Index Change Notes
BAM.PR.H OpRet -2.11 % YTW SCENARIO
Maturity Type : Soft Maturity
Maturity Date : 2012-03-30
Maturity Price : 25.00
Evaluated at bid price : 25.09
Bid-YTW : 5.48 %
NA.PR.M Perpetual-Premium -1.17 % YTW SCENARIO
Maturity Type : Call
Maturity Date : 2017-06-14
Maturity Price : 25.00
Evaluated at bid price : 25.30
Bid-YTW : 5.93 %
BNA.PR.C SplitShare 1.09 % YTW SCENARIO
Maturity Type : Hard Maturity
Maturity Date : 2019-01-10
Maturity Price : 25.00
Evaluated at bid price : 19.51
Bid-YTW : 7.92 %
HSB.PR.D Perpetual-Discount 1.11 % YTW SCENARIO
Maturity Type : Limit Maturity
Maturity Date : 2040-03-18
Maturity Price : 20.95
Evaluated at bid price : 20.95
Bid-YTW : 5.99 %
PWF.PR.K Perpetual-Discount 1.13 % YTW SCENARIO
Maturity Type : Limit Maturity
Maturity Date : 2040-03-18
Maturity Price : 20.50
Evaluated at bid price : 20.50
Bid-YTW : 6.14 %
BAM.PR.J OpRet 1.37 % YTW SCENARIO
Maturity Type : Soft Maturity
Maturity Date : 2018-03-30
Maturity Price : 25.00
Evaluated at bid price : 25.95
Bid-YTW : 4.82 %
Volume Highlights
Issue Index Shares
Traded
Notes
TD.PR.M OpRet 638,600 National sold 24,000 to Scotia, then 50,000 to RBC, 21,000 ato Desjardins and 25,000 to TD, 25,000 to RBC, all at 26.00. Then National crossed 200,000 at 25.98. It then sold 25,000 to Scotia, 25,000 to Desjardins and 25,000 to RBC and 20,000 to TD, all at 26.00. RBC crossed 75,000 at 26.00 and TD crossed 40,000 at the same price. National crossed 50,000 at 26.02 and RBC crossed 25,300 at 26.00. National sold blocks of 20,000 and 24,000 to Scotia at 26.00. National crossed 123,000 at 25.96 and sold 25,000 to Scotia at 26.00. Anonymous crossed 25,000 at the same price. Quite the nice day for National! The yield to the SoftMaturity 2013-10-30 is 3.68%.
YTW SCENARIO
Maturity Type : Call
Maturity Date : 2010-05-30
Maturity Price : 25.75
Evaluated at bid price : 26.02
Bid-YTW : 2.27 %
TD.PR.N OpRet 224,800 National sold blocks of 20,000 and 24,000 to Scotia at 26.00. It then crossed 123,000 at 25.96. National sold 25,000 to Scotia, and anonymous crossed 25,000, both at 26.00. The yield to the SoftMaturity 2014-1-30 is 3.66%.
YTW SCENARIO
Maturity Type : Call
Maturity Date : 2010-05-30
Maturity Price : 25.75
Evaluated at bid price : 26.00
Bid-YTW : 2.50 %
TRP.PR.B FixedReset 151,850 Recent new issue.
YTW SCENARIO
Maturity Type : Limit Maturity
Maturity Date : 2040-03-18
Maturity Price : 24.94
Evaluated at bid price : 24.99
Bid-YTW : 3.93 %
BNS.PR.X FixedReset 109,544 Desjardins crossed 14,800 at 28.16. Desjardins then sold 24,400 to CIBC, crossed 25,000 and sold another 25,000 to CIBC, all at 28.24.
YTW SCENARIO
Maturity Type : Call
Maturity Date : 2014-05-25
Maturity Price : 25.00
Evaluated at bid price : 28.22
Bid-YTW : 3.23 %
CM.PR.K FixedReset 106,765 RBC crossed blocks of 49,800 and 15,000 and 35,000, all at 26.95.
YTW SCENARIO
Maturity Type : Call
Maturity Date : 2014-08-30
Maturity Price : 25.00
Evaluated at bid price : 26.95
Bid-YTW : 3.64 %
BAM.PR.H OpRet 52,271 RBC crossed 21,400 and 17.300, both at 25.40.
YTW SCENARIO
Maturity Type : Soft Maturity
Maturity Date : 2012-03-30
Maturity Price : 25.00
Evaluated at bid price : 25.09
Bid-YTW : 5.48 %
There were 42 other index-included issues trading in excess of 10,000 shares.

Greenspan Endorses Contingent Capital

Thursday, March 18th, 2010

Alan Greenspan has lost a little of his mystique since McCain said he continue as Fed Chairman after death, but he’s still one of the most knowledgable people out there.

He has delivered a speech at the Brookings Institute that is of great interest.

I can’t find a copyable paper (update: Dealbreaker has one), so you’ll just have to read the speech yourselves or rely on my paraphrases!

He notes that not a single hedge fund has defaulted on debt throughout the crisis, though many have suffered large losses and been forced to liquidate.

The crash of 1987 and the dotcom bubble bursting led the Fed to believe that financial bubbles had disengaged from the real economy.

He strongly doubts that stability can be achieved in the context of a competitive economy.

Capital and liquidity address all the regulatory shortcomings that were exposed by the crisis. Capital has the advantage that it is not necessary to identify which part of the financial structure is most at risk.

The behaviour of CDS spreads in the wake of the Lehman default and TARP imply that the “well capitalized” requirement for total bank capital should be 14%, not 10%, subject to some Herculean assumptions. This will allow bank equity to earn a competitive return while not constricting credit.

The solution, in my judgment, that has at least a reasonable chance of reversing the extraordinarily large “moral hazard” that has arisen over the past year is to require banks and possibly all financial intermediaries to hold contingent capital bonds, that is, debt which is automatically converted to equity when equity capital falls below a certain threshold. Such debt will, of course, be more costly on issuance than simple debentures, but its existence could materially reduce moral hazard.

The global housing bubble was driven by lower long-term rates, not policy rates. Home mortgage 30-year rates led the Case-Shiller index by 11 months with R-squared of 0.511, compared with Fed Funds, R-squared = 0.216 and and eight-month lead. This makes sense because housing is a long-term asset.

Some people (silly people) get this muddled because the correlation between Fed Funds and 30-year mortgages is 0.83 (until 2002). But the relationship delinked, which was the Greenspan Conundrum, so up yours.

Taylor’s wrong. He equates housing starts (supply) with demand. But starts don’t drive prices, it’s the other way ’round. Builders look at housing prices, not the Fed Funds rate. What’s more the correlation between house prices and consumer prices is small to negative.

Some people (silly people) believe that low Fed Fund rates lowered ARM teaser rates and led to increased demand. But the balance of probabilities is that the decision to buy preceded the decision on financing. Anyway, the correlation of Taylor rule deviations with house prices is statistically insignificant (Dokko, Jane, et al., “Monetary Policy and the Housing Bubble”, Finance & Economics Discussion Series, Federal Reserve Board, Dec. 22, 2009)

Any attempt to instigate a “Systemic Regulator” is ill-advised and doomed to fail. Their models and forecasting ain’t gonna be any better than anybody else’s.

The Story of the CDO Market Meltdown

Wednesday, March 17th, 2010

Anna Katherine Barnett-Hart’s senior thesis has attracted some media interest, so I’ll highlight it here – since a kind soul on Financial Webring Forum went to the trouble of finding the link.

The title is The Story of the CDO Market Meltdown: An Empirical Analysis:

Collateralized debt obligations (CDOs) have been responsible for $542 billion in write-downs at financial institutions since the beginning of the credit crisis. In this paper, I conduct an empirical investigation into the causes of this adverse performance, looking specifically at asset-backed CDO’s (ABS CDO’s). Using novel, hand-collected data from 735 ABS CDO’s, I document several main findings. First, poor CDO performance was primarily a result of the inclusion of low quality collateral originated in 2006 and 2007 with exposure to the U.S. residential housing market. Second, CDO underwriters played an important role in determining CDO performance. Lastly, the failure of the credit ratings agencies to accurately assess the risk of CDO securities stemmed from an overreliance on computer models with imprecise inputs. Overall, my findings suggest that the problems in the CDO market were caused by a combination of poorly constructed CDOs, irresponsible underwriting practices, and flawed credit rating procedures.

I must admit that the phrase “irresponsible underwriting practices” caught my attention. Since when does or should the underwriter care? It’s up to the buyer to figure out just what he’s buying.

As far as the CRAs are concerned, John Hull’s work on the ratings has been previously reported on PrefBlog – he concluded:

It should be noted that a CDO created from the triple BBB tranches of ABSs is quite different from a CDO created from BBB bonds. This is true even when the BBB tranches have been chosen so that their probabilities of default and expected losses are consistent with their BBB rating. The reason is that the probability distribution of the loss from a BBB tranche is quite different from the probability distribution of the loss from a BBB bond.

The AAA ratings for Mezz ABS CDOs are much less defensible. Scenarios where all the underlying BBB tranches lose virtually all their principal are sufficiently probable that it is not reasonable to assign a AAA rating to even a quite thin senior tranche. The risks in Mezz ABS CDOs depend critically on a) the width of the underlying BBB tranches, b) the correlation between pools, c) the tail default correlation, and d) the relationship between the recovery rate and the default rate. An important point is that the BBB tranche of an ABS cannot be assumed to be similar to a BBB bond for the purposes of determining the risks in ABS CDO tranches.

In practice Mezz ABS CDOs accounted for about 3% of all mortgage securitizations. Our conclusion is therefore that the vast majority of the AAA ratings assigned to tranches created from mortgages were reasonable, but in a small minority of the cases they cannot be justified.

The distinction between Mezz ABSs and Mezz ABS CDOs must be borne firmly in mind when trying to understand this thing. The Mezz ABSs is the BBB (about) tranche of a pool of mortgages. A Mezz ABS CDO is another security that does not hold mortgages directly; it holds Mezz ABSs.

So anyway, back to the Barnett-Hart paper:

In response to the explosion in CDO issuance, the increased demand for subprime mezzanine bonds began to outpace their supply.12 Figure 2 shows the percentage of subprime bonds that were repackaged into CDOs, illustrating the drastic increase in subprime demand by CDOs. This surge in demand for subprime mezzanine bonds helped to push spreads down – so much so that the bond insurers and real estate investors that had traditionally held this risk were priced out of the market. The CDO managers that now purchased these mortgage bonds were often less stringent in their risk analysis than the previous investors, and willingly purchased bonds backed by ever-more exotic mortgage loans.13 Figure 3 looks specifically at the performance of the subprime collateral, comparing the rating downgrades of the subprime bonds that were in CDOs versus those that were not put in CDOs. Clearly, the bonds in the CDOs have performed worse, indicating that there might have been a degree of adverse selection in choosing the subprime bonds for CDOs14

Footnotes:
12: Deng et. al. (2008) find that the demand for subprime mezzanine bonds for CDOs was so great that it was a significant factor in causing a tightening in the subprime ABS-treasury spread prior to 2007.

13: A recent note by Adelson and Jacob (2008) argues that CDOs’ increasing demand for subprime bonds was the key event that fundamentally changed the market.

14: However, this result needs further investigation as it may be a result of the fact that the mezzanine tranches, most common in CDOs, have all performed the worst, or that the rating agencies had an incentive to monitor subprime bonds in CDOs more carefully, leading to a higher level of downgrades.


Click for Big


Click for Big

Investors came to rely almost exclusively on ratings to assess CDO investments: in essence substituting a letter grade for their own due diligence.

Footnote: In a report to shareholders, UBS cites over-reliance on ratings as a cause of their massive write-downs, saying that their risk committee “relied on the AAA rating of certain subprime positions, although the CDOs were built from lower-rated tranches of RMBS. This appears to have been common across the industry. A comprehensive analysis of the portfolios may have indicated that the positions would not necessarily perform consistent with their ratings”(UBS 39).

With respect to the above footnote, remember that UBS is also the poster-child for insane leverage ratios.

In addition to the problems with the accuracy of the ratings, there was also the fact that the ratings themselves were not meaningful indicators for assessing portfolio risk. As Coval et. al. (2009) notes, credit ratings, “by design only provide an assessment of the risks of the security’s expected payoff, with no information regarding whether the security is particularly likely to default at the same time as there is a large scale decline in the stock market or that the economy is in recession.” 28 Furthermore, ratings are a static measure, designed to give a representation of expected losses at a certain point in time with given assumptions. It is not possible for a single rating to encompass all the information about the probability distribution that investors need to assess its risk. Dr. Clarida, an executive vice president at PIMCO, points out that, “distributions are complicated beasts – they have means, variances, skews, and tails that can be skinny or, more often, fat. Also – they have kurtosis, fourth moments, and transition probabilities.”29 Investors often overcame these limitations by looking at ratings history, filling in their missing information with data about the track record of defaults for a given rating. Since there was little historical data for CDOs, investors instead looked at corporate bond performance. However, as noted above, asset-backed ratings have proven to have very different default distributions than corporate bonds, leading to false assessments.

So the question becomes: who were these bozo investors?

While the investment banks earned what they thought to be “riskless” profits from CDOs, they were actually loading up on more CDO risk than they realized thanks to so-called “super senior” tranches, created in part to generate even higher-yielding AAA tranches for CDO investors. To manufacture a super senior tranche, the AAA portion of a CDO was chopped up into smaller AAA tiers, enabling the “subordinate” AAA tranche to yield more and the “super senior” AAA tranche to carry an extremely low level of credit risk. Many banks found it convenient to simply retain the super senior tranches, as the Basel Accords imposed only a small capital charge for AAA securities. In addition, a significant amount of super senior exposure was retained not by choice, but rather because underwriters had difficulty selling these bonds.

Footnote: Krahen and Wilde (2005) gave a warning to regulators in 2005 about the increasing number of banks retaining senior tranches, saying that: “To the extent that senior tranches absorb extreme systematic losses, banks should be encouraged to sell these tranches to outside investors. In the interest of financial system stability, these outside buyers of bank risk should not be financial intermediaries themselves. Only if this requirement is fulfilled will the bank and the financial system be hedged against systematic shocks. Since this is supposedly one of the macroeconomic objectives of regulators, one would expect that regulatory requirements stipulate the sale of senior tranches, rather than encouraging their retention.

Which simply goes to show: don’t ever take investment advice from the sell-side.

It also makes a strong argument against tranche retention: I suggest that instead, retention of underwritten securities be penalized by capital regulation; this will ensure that the investment banks only create what they can actually sell, rather than relying on in-house analysts who, to put it bluntly, aren’t worth very much.

I will also suggest – again! – that a clear delineation be made in the new capital rules between investment banks (who should be encouraged to trade stuff and penalized for holding it) and vanilla banks (who should be encouraged to hold stuff and penalized for trading it).

March 17, 2010

Wednesday, March 17th, 2010

Former Lehman executives (and note that an “executive” can be anybody with a title) who, it would seem, prefer to remain anonymous, are trying to play down Repo 105, discussed on PrefBlog on March 12. But it’s a tangled web we weave…:

The only people who would worry about using an old trick to reduce leverage from 13.9 to 12.1, the second executive said, are “yappers who don’t know anything.”

Again, the examiner’s report takes pains to show otherwise. It quotes a senior vice president calling Lehman’s leverage targets “a very hot topic.” The firm’s own definition of a material leverage shift was one-tenth of a point.

In my experience, 95% of the sell-side are yappers who don’t know anything, and the other 5% are simply disingenuous.

And, of course, blind faith in the regulators is misplaced:

Securities and Exchange Commission Chairman Mary Schapiro said her agency’s oversight of Lehman Brothers Holdings Inc. was “terribly flawed,” days after a bankruptcy examiner found the SEC didn’t try to stop the firm’s exaggeration of liquid assets.

“It was so terribly flawed in design and execution,” Schapiro testified to a Congressional committee today, referring to SEC examinations aimed at monitoring the soundness of Wall Street’s biggest investment banks. “We were ill-suited because of our enforcement and disclosure mentality.”

Valukas’s March 11 report describes a gap between how Lehman and the SEC viewed the firm’s so-called liquidity pool, used to pay bills in a pinch, in the firm’s final months. Behind the scenes, the SEC questioned how quickly some assets could really be tapped. Still, Lehman didn’t tell investors that a growing share of the pool was being pledged as collateral to clearing firms, the report found.

The SEC deemed assets to be liquid only if they were convertible to cash within 24 hours. Lehman afforded itself five days. The SEC told Lehman it preferred the shorter limit and never enforced it, according to the report.

In another instance, the SEC didn’t take action after determining in June 2008 that Lehman had counted a $2 billion deposit at Citigroup Inc. among cash-like assets available in an emergency, according to the report. SEC analysts deemed the deposit’s designation as “problematic,” because withdrawing the money could have impaired Lehman’s trading.

The silence of examiners, who focused more on stability than honesty with investors, was invoked as a defense as Valukas quizzed more than 100 executives and other witnesses about the financial health and reporting at Lehman, based in New York.

The Bloomberg story doesn’t explore the regulators’ obsession with “stability” in detail, or even define what it is. Stability of the Financial System? Stability of Lehman? Stability of their jobs? What? One way or another … so much for the third pillar!

Greece is still trying to extract better terms for its EU bail-out:

As long as “Greece is still borrowing at an unreasonably high interest rate, over 6 percent,” the country will keep “all options open” while preferring an EU solution, Papandreou said at a press conference in Brussels today with European Commission President Jose Barroso.

Bad news at the trough on St. Patrick’s day! The little green piggies haven’t spent enough on lobbying:

“Until government policies favor renewable energy over dirty coal, solar may seem too risky now for some investors,” said Landis, whose $260 million fund include SunPower Corp. and Suntech Power Holdings Co. “Coal may make sense short term.”

Solar companies’ profitability is falling because of competition from China and cuts to state support in Germany and Spain, where about 72 percent power-producing photovoltaic panels were installed in 2008.

Germany may install 3,000 megawatts, or about a third of the world’s total, Simonek said. In the Czech Republic, a country of 10 million people, about 900 megawatts of solar power will be deployed, almost matching existing U.S. installations.

The rising global demand will help some companies weather the slump in panel prices caused by Chinese manufacturers stepping up production and cuts in solar subsidies in Germany and Spain known as feed-in tariffs, said Richard Caldwell, chairman of Australia’s Dyesol Ltd., which makes a conductive dye that produces electricity on glass and sheet metal.

“Companies in the industry like First Solar have had a shocker,” he said. “The Chinese have been flooding the market with cheap product. And we’re still getting over the change to the German feed-in tariff. It hasn’t been a good market.”

Who woulda thunk it? Competition in solar panels! And there we all were, thinking it was all about peace, love, granola and subsidized green jobs to replace all those subsidized auto jobs that have evaporated! Just think, if they can cut costs by another 90%, maybe it will even be worth thinking about!

Volume was good in the Canadian preferred share market today, but PerpetualDiscounts fell by 7bp. FixedResets gained 2bp to take yields to within a hairsbreadth of their all-time lows … another tenth of a beep in yield and we’ve got a new record.

PerpetualDiscounts now yield 5.97%, equivalent to 8.36% interest at the standard equivalency factor of 1.4x. Long Corporates now yield about 5.7% (maybe a little bit more) so the pre-tax interest equivalent spread (also called the seniority spread) now sits at about 265bp, a significant widening from the 245bp reported on March 10. I consider it highly peculiar that the spread should be so wide in the absence of any serious credit-based panics; I can only conclude that retail has decided that massive inflation is imminent – which is consistent with low yields on FixedResets – contrary to the beliefs of institutional bond investors. I note that Long Canadas now yield 4.02% while long RRBs yield 1.57% real, for a breakeven of 245bp.


Click for Big

…. and you can call the recent rocketing in the breakeven spread either a return to normalcy or a harbinger of hyperinflation, depending on what answer you want to get … or what your client wants to hear.

HIMIPref™ Preferred Indices
These values reflect the December 2008 revision of the HIMIPref™ Indices

Values are provisional and are finalized monthly
Index Mean
Current
Yield
(at bid)
Median
YTW
Median
Average
Trading
Value
Median
Mod Dur
(YTW)
Issues Day’s Perf. Index Value
Ratchet 2.63 % 2.78 % 56,234 20.84 1 -0.5090 % 2,103.6
FixedFloater 5.14 % 3.25 % 44,807 19.87 1 -1.1677 % 3,076.3
Floater 1.93 % 1.73 % 45,279 23.23 4 -0.2320 % 2,394.0
OpRet 4.90 % 2.62 % 100,267 0.20 13 -0.0149 % 2,309.3
SplitShare 6.43 % 6.53 % 127,694 3.68 2 -0.4198 % 2,121.1
Interest-Bearing 0.00 % 0.00 % 0 0.00 0 -0.0149 % 2,111.6
Perpetual-Premium 5.88 % 5.92 % 119,405 6.86 7 0.0908 % 1,891.5
Perpetual-Discount 5.90 % 5.97 % 179,272 13.94 71 -0.0675 % 1,789.2
FixedReset 5.36 % 3.47 % 341,924 3.69 43 0.0161 % 2,202.4
Performance Highlights
Issue Index Change Notes
GWO.PR.H Perpetual-Discount -1.41 % YTW SCENARIO
Maturity Type : Limit Maturity
Maturity Date : 2040-03-17
Maturity Price : 20.21
Evaluated at bid price : 20.21
Bid-YTW : 6.03 %
HSB.PR.D Perpetual-Discount -1.33 % YTW SCENARIO
Maturity Type : Limit Maturity
Maturity Date : 2040-03-17
Maturity Price : 20.72
Evaluated at bid price : 20.72
Bid-YTW : 6.06 %
BAM.PR.G FixedFloater -1.17 % YTW SCENARIO
Maturity Type : Limit Maturity
Maturity Date : 2040-03-17
Maturity Price : 25.00
Evaluated at bid price : 21.16
Bid-YTW : 3.25 %
BNA.PR.C SplitShare -1.08 % YTW SCENARIO
Maturity Type : Hard Maturity
Maturity Date : 2019-01-10
Maturity Price : 25.00
Evaluated at bid price : 19.30
Bid-YTW : 8.08 %
Volume Highlights
Issue Index Shares
Traded
Notes
BAM.PR.O OpRet 127,900 Nesbitt crossed 124,400 at 25.85. Nice ticket!
YTW SCENARIO
Maturity Type : Option Certainty
Maturity Date : 2013-06-30
Maturity Price : 25.00
Evaluated at bid price : 25.85
Bid-YTW : 3.85 %
TRP.PR.B FixedReset 112,157 Recent new issue.
YTW SCENARIO
Maturity Type : Limit Maturity
Maturity Date : 2040-03-17
Maturity Price : 24.92
Evaluated at bid price : 24.97
Bid-YTW : 3.94 %
TD.PR.N OpRet 82,165 National sold 10,000 to Desjardins at 26.00 and 25,000 to RBC at the same price. RBC crossed 25,000 at the same price again.
YTW SCENARIO
Maturity Type : Call
Maturity Date : 2010-05-30
Maturity Price : 25.75
Evaluated at bid price : 26.00
Bid-YTW : 2.46 %
TD.PR.E FixedReset 66,812 Nesbitt crossed 35,000 at 28.20, then bought 10,000 from TD at the same price.
YTW SCENARIO
Maturity Type : Call
Maturity Date : 2014-05-30
Maturity Price : 25.00
Evaluated at bid price : 28.11
Bid-YTW : 3.32 %
NA.PR.L Perpetual-Discount 66,616 National crossed 61,300 at 20.77.
YTW SCENARIO
Maturity Type : Limit Maturity
Maturity Date : 2040-03-17
Maturity Price : 20.72
Evaluated at bid price : 20.72
Bid-YTW : 5.93 %
W.PR.H Perpetual-Discount 47,100 Scotia crossed 20,000 at 22.50; RBC crossed 25,000 at the same price.
YTW SCENARIO
Maturity Type : Limit Maturity
Maturity Date : 2040-03-17
Maturity Price : 22.12
Evaluated at bid price : 22.50
Bid-YTW : 6.22 %
There were 41 other index-included issues trading in excess of 10,000 shares.

S&P Releases 2009 Transition Study

Wednesday, March 17th, 2010

Standard & Poor’s has released its 2009 Annual Global Corporate Default Study And Rating Transitions:

Last year set many new records in terms of global corporate default and transition performance. There were 264 defaults globally, the highest annual total since our database began in 1981 (see Table 1). The rated debt amount affected by these defaults reached $627.7 billion, also a series high. Distressed exchanges featured prominently as a trigger, accounting for 39% of defaults globally and 55% of total debt affected by defaults.

Credit degradation among nondefaulting issuers was widespread and pronounced, especially in the first half of 2009, with the percentage of issuers downgraded during the course of the year reaching 18.34%, the highest rate in 29 years (see Table 6). There were 3.85 downgrades for every upgrade, the worst ratio on record. In addition, the average number of notches recorded among downgrades rose in 2009 to 1.76, a pace unmatched since 2002 (see Chart 12).

Financials featured disproportionately among issuers that experienced downgrades of seven or more notches. Meanwhile, global speculative-grade default rates—expressed as a percentage of the issuer count—rose to levels that, though not unprecedented, had not been seen since 1991, driven by trends in the U.S. (see Chart 1).

Preferred Shares & Annuities

Tuesday, March 16th, 2010

An Assiduous Reader writes in and says:

My background is in insurance and mathematics {now retired at 56}. I am intrigued by the perpetual preferred shares offered by quality institutions rated Pfd 1 or 2 {about 12 to 15 issuers}. With the higher yield and the Canadian dividend tax credit, I am comparing this investment strategy to purchasing a joint life-time annuity with a guaranteed period of 25 years. On the surface, the rate of return is about 6% annually. I recognize the annuity has a return of capital component.

So here’s my riddle…why wouldn’t I buy the quality perpetual preferreds for the ongoing income whereby I can transfer the shares to my spouse [or vice versa] and, likewise, to our children in perpetuity – unlike the annuity that would cease upon on our last-to-die joint death and/or 25 years. The fluctuation in the capital value of my preferreds would not concern me – anymore than the annuity where the entire capital is ‘lost’ upon the initial purchase.

Lastly, if I wanted to ‘boost’ my yield on my preferred portfolio, I would re-invest the dividends for a few years to a level of income that I would like [eg 10%/year} and then that would be the rate of return in perpetuity. If this 10%/year is approximately the long-term equity stock market return, why would I even bother taking on the extra risk with equities and the aggravation of trying to select the appropriate securities for my portfolio.

If this makes sense, then my entire investment strategy should be with perpetual preferreds. {I have other significant assets}

Maybe I am missing something so, thus, my email to you. This ‘riddle’ is starting to keep me up at night!

I am not particularly comfortable in this field of investment decision-making, so take everything below with a grain of salt and do your own research. But I’ll give it a stab! Any corrections or elaborations will be gratefully received.

But first, let me say that the Inquiring Reader is on the right track. Preservation of Income – as opposed to Preservation of Capital – is what preferred shares are all about.

Morningstar publishes life annuity rates; a sixty-year-old male is looking at an annual payment of about 7.2% of principal; at 70 it’s about 9%; and at 75 it’s about 10.8%.

According to Standard Life, the income is taxed as regular income:

Registered

The annuity payment is fully taxable

Non-registered

Only the interest portion is taxable

The taxable portion can be reported on a “prescribed” or “non-prescribed” basis

  • Prescribed: level taxable portion each year
  • Non-prescribed: taxable portion changes each year (interest reported each year reduces)

The prescribed taxation basis is attractive to taxpayers as it allows for the deferral of taxes. It is regulated and can only be used with specific types of annuities. All other annuities must be on a non-prescribed taxation basis.

To estimate how much of the annuity payment is return of capital, I used the Canadian Business Life Expectancy Calculator with the following data:

Life Expectance Calculations
Data Required Age 60 Age 70 Age 75
Age 60 70 75
Sex Male
Height 6’0″
Weight 190 lbs
Frame Small
Physically Active? Somewhat
Level of Stwess Low
Smoking Less than 2 packs a day
Drinking Habits Never more than three drinks
Eat Saturated Fats How the hell should I know? I’m a GUY, ferchrissake. Call it once or twice a week
Elevated cholesterol No
Normal blood pressure Um … when talking about regulators and politicians? Or other times? Call it yes
Two subquestions skipped
Parents lived long? Yes
Siblings with bum tickers? No
Accidents or speeding tickets? No
Post-Secondary Yes
Not poor? yes
Safety belt? Even in bed!
Estimated Lifespan 80 83 85

So at age 60, we’ll say 20-years to go; 13 years to go at age 70; and 10 years left at age 75.

Some quick work with MS-Excel, with the assumption that the capital is all gone at the end of the annuity results in required yields of 3.6%, 2.3% and 1.4%. We’ll summarize this in another table:

Annuity Rates and Required Return
Age Years Left Annuity Rate IRR
60 20 7.2% 3.6%
70 13 9.0% 2.3%
75 10 10.8% 1.4%

Holy smokes! I’ve definitely made a mistake somewhere … could be the assumptions, the math, or the fact that I didn’t go into the insurance business.

However, before we leap wholeheartedly into PerpetualDiscounts as life-annuity substitutes, let’s take a look at the risks:

Credit Risk: Annuities are a far more senior claim on the insurers than preferred shares, especialy since – as far as the insurers are concerned – an annuity is a claim on the operating companies assets, while a preferred share is a claim on the parent. It is entirely possible that in times of trouble, a preferred shareholder could get nothing while an annuity holder could get paid in full … even in the absence of a government bail-out.

Return Order Risk: An annuity withdraws principal on a steadily increasing basis – even if that basis has to be calculated on a post hoc basis. Thus, if we are performing a direct comparison, we also have to withdraw principal from our preferred share portfolio on a steady basis. This means we are exposed to Order of Returns Risk. And that’s even before we consider:

Principal Evaporation Risk: With an annuity, the insurance company takes the risk that you will last longer than expected, and covers it with their chances that other clients will make up for it. With a preferred share portfolio – or any investment portfolio – you’re the one stuck with that risk.

Call Risk: Say preferred share yields fall dramatically and your shares get called. This will definitely foul up your long-term returns because your returns after the call date will reflect the coupon of your PerpetualDiscount, and not the initial yield – and that’s even before you account for frictional costs of the process.

As noted in the comments, this is overstated. Your yield will go down but, to at least some extent, your capital will have increased on a call. However:

  • There will be capital gains tax to pay
  • There is no guarantee that suitable replacements will be available
  • A call will normally take place when the issuer can refinance cheaper, so there will be a yield hit to reflect “cheaper”.

Tax Risk: The tax regime for dividends could change, eliminating at least some of the dividend advantage

Inflation Risk: This will be about the same for both strategies, but you do have the option to buy an indexed annuity, whereas there are no indexed preferred shares at present. At some point, a deeply discounted FixedReset with a microscopic spread against five-year Canadas might be functionally equivalent, but we don’t have any of those yet. Other floating rate perpetuals (Ratchet, FixedFloater, Floater) might be considered equivalent, but then you have basis risk (either prime or five-year Canadas vs. inflation) and extant non-FixedReset Floating Rate issues don’t have sterling credit quality.

All in all, the risks are significant, but the returns are certainly juicy. I would advise that annuities are good for the bare-bones-beans-on-a-hotplate portion of retirement income, while preferred shares – and other investments – provide the income that you spend in Florida.

There are probabily mistakes in the above – this is not a topic I spend a lot of time on. My job is to take the investor’s allocation to preferreds and do a better job with it than he could himself – not to decide on the allocation. Any commentary will be be appreciated.

Update: See also Lifetime Financial Advice: Human Capital, Asset Allocation, and Insurance, Ibbotson, Milevsky, Chen & Zhu, ISBN 978-0-943205-94-6

Update, 2010-3-17: See also the So you are going to buy an annuity. With what? discussion on Financial Webring Forum.

Update, 2010-3-17: Another good article is Annuity Analytics: How Much to Allocate to Annuities? by Moshe A. Milevsky.

Update, 2010-3-19: There’s a good table in Milevsky’s Annuitization: If Not Now, When?:

Value of Unisex Mortality Credits:
Assuming 40m/60f (static) Annuity 2000 Table at 6% net interest.
Age of
Annuitant
Spread Above
Pricing Interest
Rate
(in Basis Points = 1/100 %)
55 35
60 52
65 83
70 138
75 237
80 414
85 725
90 1256
95 2004
100 2978
Source: The IFID Centre calculations

Update, 2010-3-25: Interesting conclusions and charts in Kaplan’s Asset Allocation with Annuities for Retirement Income Management