Archive for May, 2010

DBRS Upgrades Four SplitShare Preferreds

Tuesday, May 4th, 2010

DBRS has announced that it has:

upgraded the ratings of preferred shares issued by four split share companies and trusts (the Issuers): Energy Split Corporation, Energy Split Corp. II, SNP Split Corp. and Utility Split Trust.

Each of the Issuers has invested in a portfolio of securities (the Portfolio) funded by issuing two classes of shares – dividend-yielding preferred shares or securities (the Preferred Shares) and capital shares or units (the Capital Shares). The main form of credit enhancement available to these Preferred Shares is a buffer of downside protection. Downside protection corresponds to the percentage decline in market value of the Portfolio that must be experienced before the Preferred Shares would be in a loss position. The amount of downside protection available to Preferred Shares will fluctuate over time based on changes in the market value of the Portfolio.

Today’s rating actions reflect upward trends in the net asset value (NAV) of the respective Portfolios over the past eight months. In its surveillance of split share funds, DBRS reviews the historical trends in downside protection and assigns greater weighting to more recent Issuer NAVs.

DBRS will continue to closely monitor changes in the credit quality of these Preferred Shares. The timing of rating actions will generally follow the surveillance guidelines listed in DBRS’s split share methodology, “Rating Canadian Split Share Companies and Trusts.”

DBRS Review Announced 2010-5-3
Ticker Old
Rating
Asset
Coverage
Last
PrefBlog
Post
HIMIPref™
Index
New
Rating
UST.PR.A Pfd-3(high) 2.1+:1
5/3
Downgraded None Pfd-2(low)
ES.PR.B Pfd-4(high) 1.5+:1
4/29
Upgraded None Pfd-3(low)
EN.PR.A Pfd-3(high) 2.2+:1
4/29
Upgraded Scraps Pfd-2(low)
SNP.PR.V Pfd-3 1.7-:1
12/18
Upgraded None Pfd-3(high)

I am sorely tempted to add UST.PR.A to the HIMIPref™ database, but it is scheduled to wind-up 2011-12-31. Maybe if they extend term …

May 3, 2010

Monday, May 3rd, 2010

This one will cause some angst for the bubble-gum crowd:

Warren Buffett, the Wall Street critic who invested $5 billion in Goldman Sachs Group Inc., said he supports the bank’s Chief Executive Officer Lloyd Blankfein “100 percent” after the firm was sued by regulators for fraud.

Buffett said he will discuss the trade at the center of the regulator’s suit later today at the meeting and “I will bet that of the 40,000 people in there, 39,900 of them have a misconception.”

God endorses Satan! Of course, Buffett achieved his status by a very rare process known technically as “thinking about what he was doing”.

He went further later on:

“I can’t see what difference it makes if it were Paulson on the other side of the deal or Goldman Sachs or Berkshire Hathaway,” Buffett said today at his company’s annual meeting in Omaha, Nebraska. Buffett said it “wasn’t so obvious” when the investments were sold in 2007 that the housing market would collapse.

Gracious heavens, the bubble-gum crowd is going to have a collective nervous breakdown!

Buffett said today that Berkshire has four decades of experience with Goldman Sachs and no expectation that the bank would offer investment advice or disclose its own stance on trades.

“We are in the business of making our own decisions,” Buffett said. “They do not owe us a divulgence of their position.”

A grown-up! An actual grown-up! Quick, call the nannies! It occurs to me that one reason Buffett has done so well is that he’s an adult in a world of kiddies.

Suprisingly, I don’t see his comments highlighted in one of the sacred places where the acolytes proselytize and interpret the Holy Word. I guess Buffett can only be considered wise when he recites platitudes that people want to hear … but that’s the marketting biz!

Blankfein has learned that lesson and is attempting to distance himself and the firm from some headlined eMails:

Lloyd Blankfein, chief executive officer of Goldman Sachs Group Inc., said a “callousness” toward clients demonstrated in some e-mails released to the public this week is unacceptable and doesn’t represent the firm.

“There were some e-mails where some people were projecting I would say, at best indifference, and at worst a callousness,” Blankfein, 55, said in an interview on the “Charlie Rose” television show last night, according to a transcript. While he said those e-mails aren’t representative of the firm, “it’s inexcusable if 10 people think that way or thought that way.”

But, of course, you don’t get to be head of a big (public) firm by telling people what they don’t want to hear. I’ve had a look, but unfortunately have been unable to find a link to the actual transcript.

Never let it be said that PrefBlog doesn’t report both sides of the story: Suna Reyent writes a post on Seeking Alpha titled Why SEC has a Strong Case Against Goldman, Part 1. She states, for instance:

SEC alleges that Goldman not only hid Paulson’s role from all long parties via making it appear like a third long party (ACA) picked the portfolio, which is a material misrepresentation on its own, but it also made one investor (ACA) believe that Paulson was interested in the long side of the deal.

That’s where I stopped reading. ACA was the Selection Agent; they were paid to be the Selection Agent; they had fiduciary responsibility as the Selection Agent. The idea that Goldman made one investor (ACA) believe that Paulson was interested in the long side of the deal. is:

  • contested by Goldman & Tourre
  • completely non-material and irrelevent even if true.

Some light reading with a moral… Never Kick Your Chief Regulator in the Nuts. Or, to put it another way, never disclose that the emperor has no clothes. The light reading is best accompanied by SEC Fraud Allegations against MBIA. Of course, since this was settled without admission of guilt, we’ll never know whether they were really guilty, or whether not paying up would have constituted kicking the Chief Regulator in the Nuts.

Ackman, by the way, agrees with PrefBlog and Buffet about Goldman Sachs:

Ackman also staunchly defends Goldman Sachs. He says that the media misrepresents the charges against Goldman Sachs. He states that it would have been unethical had Goldman disclosed who the counter party(John Paulson) was on the trade. Ackman states that SEC laws require client confidentiality. Paulson himself did not know who was the long on the trade nor did he care.

I’ll go further, actually. Any fiduciary who cared about the identity of the seller, or who would have allowed the identity of the seller to influence his decision on the investment in any way whatsoever should be in jeopardy of losing his license. Investing is not a kiddie game of follow the leader … or shouldn’t be.

Trichet gave a speech decrying the propensity of investment managers to act in (what they believe to be) their clients’ best interest:

Gradually, the focus of finance shifted in the recent past. From its traditional role of helping the real economy to cope with economic risk, finance became a self-referential activity. The notion of “financial engineering” is a striking illustration of the shift of attitudes that spearheaded the changing focus of finance.

The ABACUS transaction is a good illustration of the point. ACA & IKB beleived that sub-prime borrowers were getting a deal favourable to the lenders. Paulson thought they were getting way too rich a deal. Goldman got between them, as brokers do, and created a security referencing the deals. Had this deal not gone forward, Paulson would not have been able to take a view on the market (it’s hard to short houses with mortgages!); the ACA/IKB money would have eventually have flowed into the sub-prime market, thus distorting the real economy even further. By creating a vehicle to interupt the inefficient allocation of capital to an overheated sector of the market, Goldman did the world financial system a great service, and deserves our thanks … but I suppose that profits on the books and expectations of future profits from similar deals will satisfy them.

James Hamilton of Econbrowser writes a post on the evolution of investment strategy at Reserve Primary Fund, which has attracted (so far) some very good comments. That post bulds on a very good post he wrote previously in which he traced the flow of funds into the US housing market.

The Greek bail-out conditions have been released. The effect on the total economy is fearsome:

*Economic contraction of 4 percent this year and 2.6 percent in 2011. Growth will return in 2012 at 1.1 percent and 2.1 percent in 2013 and 2014.

*Debt will rise from 133.3 percent of GDP this year to 145.1 percent in 2011, 148.6 in 2012 and peak at 149.1 percent in 2013. It is projected to fall to 144.3 percent in 2014.

*Budget deficit will shrink to 8.1 percent this year, 7.6 percent next year, 6.5 percent in 2012, 4.9 percent in 2013 and below the 3 percent demanded by the European Union in 2014.

There is some speculation that regulatory uncertainty is affecting the real economy:

Bank are increasing purchases of U.S. government securities to pump up profits while lending to businesses languishes near the lowest levels since credit markets started to freeze almost three years ago.

Holdings of Treasuries rose each of the past five weeks, an increase of $63.2 billion to $1.5 trillion, according to Federal Reserve data. At the same time, commercial and industrial loans climbed less than 1 percent to $1.27 trillion and are down 23 percent from the record high level in October 2008.

“The risk of owning Treasures is lower than creating loans,” said Anthony Crescenzi, a market strategist and money manager at Newport Beach, California-based Pacific Investment Management Co., the world’s largest bond-fund manager. “There is no clarity on what the capital climates will be domestically or on a global scale with regulation coming down the pipes, which means banks will be banking their money in safer assets.”

Jerome Kerviel, the SocGen trader last discussed on PrefBlog on July 28, 2009, has written a book:

The five-billion-Euro rogue trader Jerome Kerviel will claim in a book this week that he was merely a “prostitute” in the “great banking orgy” and should be treated leniently in his trial next month.

Kerviel, 33, has broken a long silence with an autobiography and two newspaper interviews in which he says that his €4.9bn losses in rogue trades in 2006-07 should be blamed on a world banking industry “disconnected from reality”.

One reason not to ban shorting is that it’s a risky business:

Hedge funds that profit from falling shares have seen 34 percent of their value evaporate since February 2009, according to Chicago-based Hedge Fund Research Inc. Zions Bancorp., Sears Holdings Corp. and Wynn Resorts Ltd., among the favorites of so- called short-sellers, caused the biggest losses as their shares more than tripled.

The combination of record-low interest rates, first-quarter economic growth of 3.2 percent and analyst estimates for the fastest profit gains in 14 years erased 94 percent of the HFRI EH Short Bias Index’s advance from June 2007 to February 2009. The better news for bulls is that the percentage of New York Stock Exchange shares that remain shorted is higher than any time before 2008, providing more grist for gains should speculators be forced to retreat.

Some recovery in the Canadian preferred share market today on continued heavy volume, with PerpetualDiscounts squeaking out a win of 5bp, while FixedResets were up 36bp.

HIMIPref™ Preferred Indices
These values reflect the December 2008 revision of the HIMIPref™ Indices

Values are provisional and are finalized monthly
Index Mean
Current
Yield
(at bid)
Median
YTW
Median
Average
Trading
Value
Median
Mod Dur
(YTW)
Issues Day’s Perf. Index Value
Ratchet 2.54 % 2.58 % 50,829 21.02 1 1.7415 % 2,181.4
FixedFloater 4.94 % 3.00 % 45,733 20.35 1 0.0000 % 3,237.9
Floater 2.03 % 2.26 % 105,337 21.72 3 -0.7000 % 2,391.4
OpRet 4.90 % 3.87 % 99,302 1.19 11 0.0000 % 2,303.4
SplitShare 6.40 % 6.57 % 134,863 3.56 2 -0.0662 % 2,131.9
Interest-Bearing 0.00 % 0.00 % 0 0.00 0 0.0000 % 2,106.3
Perpetual-Premium 5.53 % 4.77 % 25,032 15.84 1 0.0000 % 1,822.8
Perpetual-Discount 6.28 % 6.36 % 218,625 13.39 77 0.0462 % 1,700.9
FixedReset 5.54 % 4.41 % 502,788 3.59 44 0.3642 % 2,135.8
Performance Highlights
Issue Index Change Notes
CU.PR.B Perpetual-Discount -8.72 % This one is courtesy of a lazy market-maker. Three transactions late in the day comprised the entire day’s volume of 1,300 shares; all were executed at 24.65. That took out the bid, though, and the closing quote was 22.50-24.99 (!!), 5×20.
YTW SCENARIO
Maturity Type : Limit Maturity
Maturity Date : 2040-05-03
Maturity Price : 22.21
Evaluated at bid price : 22.50
Bid-YTW : 6.80 %
BAM.PR.K Floater -1.13 % YTW SCENARIO
Maturity Type : Limit Maturity
Maturity Date : 2040-05-03
Maturity Price : 17.50
Evaluated at bid price : 17.50
Bid-YTW : 2.26 %
POW.PR.C Perpetual-Discount 1.08 % YTW SCENARIO
Maturity Type : Limit Maturity
Maturity Date : 2040-05-03
Maturity Price : 21.95
Evaluated at bid price : 22.45
Bid-YTW : 6.51 %
BNS.PR.Y FixedReset 1.18 % YTW SCENARIO
Maturity Type : Limit Maturity
Maturity Date : 2040-05-03
Maturity Price : 23.96
Evaluated at bid price : 24.00
Bid-YTW : 4.01 %
PWF.PR.G Perpetual-Discount 1.69 % YTW SCENARIO
Maturity Type : Limit Maturity
Maturity Date : 2040-05-03
Maturity Price : 22.60
Evaluated at bid price : 22.86
Bid-YTW : 6.50 %
BAM.PR.E Ratchet 1.74 % YTW SCENARIO
Maturity Type : Limit Maturity
Maturity Date : 2040-05-03
Maturity Price : 22.51
Evaluated at bid price : 22.20
Bid-YTW : 2.58 %
BMO.PR.P FixedReset 1.75 % YTW SCENARIO
Maturity Type : Call
Maturity Date : 2015-03-27
Maturity Price : 25.00
Evaluated at bid price : 26.15
Bid-YTW : 4.29 %
BNS.PR.T FixedReset 2.06 % YTW SCENARIO
Maturity Type : Call
Maturity Date : 2014-05-25
Maturity Price : 25.00
Evaluated at bid price : 26.80
Bid-YTW : 4.39 %
ELF.PR.F Perpetual-Discount 4.49 % YTW SCENARIO
Maturity Type : Limit Maturity
Maturity Date : 2040-05-03
Maturity Price : 19.10
Evaluated at bid price : 19.10
Bid-YTW : 7.02 %
Volume Highlights
Issue Index Shares
Traded
Notes
BNS.PR.X FixedReset 93,927 Desjardins crossed two blocks of 20,000 each at 26.60. RBC crossed 40,000 at 26.80.
YTW SCENARIO
Maturity Type : Call
Maturity Date : 2014-05-25
Maturity Price : 25.00
Evaluated at bid price : 26.62
Bid-YTW : 4.60 %
CM.PR.L FixedReset 89,410 RBC crossed 20,000 at 26.62; Desjardins crossed 12,300 at 26.68. RBC crossed 35,000 at 26.67.
YTW SCENARIO
Maturity Type : Call
Maturity Date : 2014-05-30
Maturity Price : 25.00
Evaluated at bid price : 26.70
Bid-YTW : 4.74 %
TD.PR.K FixedReset 71,127 Nesbitt crossed 65,000 at 26.70.
YTW SCENARIO
Maturity Type : Call
Maturity Date : 2014-08-30
Maturity Price : 25.00
Evaluated at bid price : 26.70
Bid-YTW : 4.55 %
CM.PR.M FixedReset 62,570 RBC crossed 29,200 at 26.69 and 30,000 at 26.70.
YTW SCENARIO
Maturity Type : Call
Maturity Date : 2014-08-30
Maturity Price : 25.00
Evaluated at bid price : 26.83
Bid-YTW : 4.66 %
TD.PR.C FixedReset 53,776 RBC crossed 50,000 at 26.10.
YTW SCENARIO
Maturity Type : Call
Maturity Date : 2014-03-02
Maturity Price : 25.00
Evaluated at bid price : 26.17
Bid-YTW : 4.30 %
TD.PR.I FixedReset 45,411 RBC crossed 25,000 at 26.70.
YTW SCENARIO
Maturity Type : Call
Maturity Date : 2014-08-30
Maturity Price : 25.00
Evaluated at bid price : 26.70
Bid-YTW : 4.55 %
There were 50 other index-included issues trading in excess of 10,000 shares.

MAPF Performance: April 2010

Sunday, May 2nd, 2010

The fund experienced a negative return in April – as did nearly all sectors of the preferred share market – but outperformed both DPS.UN and CPD due to its heavy weighting in PerpetualDiscounts.

I am somewhat at a loss to account for the weakness YTD in PerpetualDiscounts. It doesn’t make much sense given that long corporate bond yields are declining and have reached 5.7% – as I recently discussed with John Heinzl of the Globe & Mail.

I believe that the phenomenon is due to retail’s understanding of the facts (relentlessly driven home by the media) that the BoC rate has nowhere to go but up; that increases in this rate will probably happen sooner rather than later; and that a portion of these increases will be reflected in the 5-Year Canada yield and hence to mortgages. However, the reasoning becomes suspect when, as I believe, this reasoning is extended to apply to long corporate bond yields and PerpetualDiscount yields.

Is it a “good time to buy”? Well, the Seniority Spread (the difference between the interest-equivalent pre-tax PerpetualDiscount yield and the long corporate yield) is exceptionally high at the moment at 320bp. This spread has been exceeded in the past 16+ years only at the depths of the Credit Crunch in November/December 2008 (when it briefly spiked to about 450bp). The range I have dubbed “Credit Crunch Normal” is 200-225bp; the long-term, pre-Credit-Crunch range was 100-150bp.

So I am prepared to go so far as to say that the attractiveness of PerpetualDiscounts vs. Long Corporates is currently enhanced relative to other times and that investors with a disciplined asset allocation framework will therefor finding their models leading to a greater weight in PDs than might otherwise be the case.

However, I dislike the entire concept of “good time to buy”. Investment allocation decisions should be based on portfolio needs long term expectations, not developed on the fly in an attempt to time the markets.

The fund’s Net Asset Value per Unit as of the close April 30 was $10.0518.

Returns to April 30, 2010
Period MAPF Index CPD
according to
Claymore
One Month -1.93% -1.94% -2.15%
Three Months -5.35% -2.22% -2.90%
One Year +28.29% 16.52% +10.99%
Two Years (annualized) +23.60% +3.28% +0.87%*
Three Years (annualized) +15.33% +0.22% -1.97
Four Years (annualized) +13.10% +1.20%  
Five Years (annualized) +11.72% +1.64%  
Six Years (annualized) +11.39% +2.32%  
Seven Years (annualized) +13.28% +2.88%  
Eight Years (annualized) +11.79% +3.26%  
Nine Years (annualized) +12.27% +3.00%  
The Index is the BMO-CM “50”
MAPF returns assume reinvestment of dividends, and are shown after expenses but before fees.
CPD Returns are for the NAV and are after all fees and expenses.
* CPD does not directly report its two-year returns. The figure shown is the square root of product of the current one-year return and the similar figure reported for April 2009.
Figures for Omega Preferred Equity (which are after all fees and expenses) for 1-, 3- and 12-months are -2.0%, -2.6% and +14.2%, respectively, according to Morningstar after all fees & expenses
Figures for Jov Leon Frazer Preferred Equity Fund Class I Units (which are after all fees and expenses) for 1-, 3- and 12-months are -2.6%, -2.6% & +8.4% respectively, according to Morningstar
Figures for AIC Preferred Income Fund (which are after all fees and expenses) for 1-, 3- and 12-months are -3.2%, -2.8% & +5.1%, respectively

MAPF returns assume reinvestment of dividends, and are shown after expenses but before fees. Past performance is not a guarantee of future performance. You can lose money investing in Malachite Aggressive Preferred Fund or any other fund. For more information, see the fund’s main page.

I am very pleased with the returns over the past year, but implore Assiduous Readers not to project this level of outperformance for the indefinite future. The year in the preferred share market was filled with episodes of panic and euphoria, together with many new entrants who do not appear to know what they are doing; perfect conditions for a disciplined quantitative approach.

Sometimes everything works … sometimes the trading works, but sectoral shifts overwhelm the increment … sometimes nothing works. The fund seeks to earn incremental return by selling liquidity (that is, taking the other side of trades that other market participants are strongly motivated to execute), which can also be referred to as ‘trading noise’. There have been a lot of strongly motivated market participants in the past year, generating a lot of noise! The conditions of the past year may never be repeated in my lifetime … but the fund will simply attempt to make trades when swaps seem profitable, whether that implies monthly turnover of 10% or 100%.

There’s plenty of room for new money left in the fund. Just don’t expect the current level of outperformance every year, OK? While I will continue to exert utmost efforts to outperform, it should be borne in mind that beating the index by 500bp represents a good year, and there will almost inevitably be periods of underperformance in the future.

The yields available on high quality preferred shares remain elevated, which is reflected in the current estimate of sustainable income.

Calculation of MAPF Sustainable Income Per Unit
Month NAVPU Portfolio
Average
YTW
Leverage
Divisor
Securities
Average
YTW
Capital
Gains
Multiplier
Sustainable
Income
per
current
Unit
June, 2007 9.3114 5.16% 1.03 5.01% 1.1883 0.3926
September 9.1489 5.35% 0.98 5.46% 1.1883 0.4203
December, 2007 9.0070 5.53% 0.942 5.87% 1.1883 0.4448
March, 2008 8.8512 6.17% 1.047 5.89% 1.1883 0.4389
June 8.3419 6.034% 0.952 6.338% 1.1883 $0.4449
September 8.1886 7.108% 0.969 7.335% 1.1883 $0.5054
December, 2008 8.0464 9.24% 1.008 9.166% 1.1883 $0.6206
March 2009 $8.8317 8.60% 0.995 8.802% 1.1883 $0.6423
June 10.9846 7.05% 0.999 7.057% 1.1883 $0.6524
September 12.3462 6.03% 0.998 6.042% 1.1883 $0.6278
December 2009 10.5662 5.74% 0.981 5.851% 1.0000 $0.6182
March 2010 10.2497 6.03% 0.992 6.079% 1.0000 $0.6231
April 2010 10.0518 6.33% 0.995 6.362% 1.0000 $0.6395
NAVPU is shown after quarterly distributions of dividend income and annual distribution of capital gains.
Portfolio YTW includes cash (or margin borrowing), with an assumed interest rate of 0.00%
The Leverage Divisor indicates the level of cash in the account: if the portfolio is 1% in cash, the Leverage Divisor will be 0.99
Securities YTW divides “Portfolio YTW” by the “Leverage Divisor” to show the average YTW on the securities held; this assumes that the cash is invested in (or raised from) all securities held, in proportion to their holdings.
The Capital Gains Multiplier adjusts for the effects of Capital Gains Dividends. On 2009-12-31, there was a capital gains distribution of $1.989262 which is assumed for this purpose to have been reinvested at the final price of $10.5662. Thus, a holder of one unit pre-distribution would have held 1.1883 units post-distribution; the CG Multiplier reflects this to make the time-series comparable. Note that Dividend Distributions are not assumed to be reinvested.
Sustainable Income is the resultant estimate of the fund’s dividend income per current unit, before fees and expenses. Note that a “current unit” includes reinvestment of prior capital gains; a unitholder would have had the calculated sustainable income with only, say, 0.9 units in the past which, with reinvestment of capital gains, would become 1.0 current units.

Significant positions were held in Fixed-Reset issues on April 30; all of which (with the exception of YPG.PR.C) currently have their yields calculated with the presumption that they will be called by the issuers at par at the first possible opportunity. A split-share issue (BNA.PR.C) is also held. This presents another complication in the calculation of sustainable yield.

However, if the entire portfolio except for the PerpetualDiscounts were to be sold and reinvested in these issues, the yield of the portfolio would be the 6.47% shown in the MAPF Portfolio Composition: April 2010 analysis (which is in excess of the 6.35% index yield on April 30). Given such reinvestment, the sustainable yield would be $10.0518 * 0.0647 = 0.6503, whereas similar calculations for March and February result in $0.6457 and $0.6418, respectively.

Different assumptions lead to different results from the calculation, but the overall positive trend is apparent. I’m very pleased with the results! It will be noted that if there was no trading in the portfolio, one would expect the sustainable yield to be constant (before fees and expenses). The success of the fund’s trading is showing up in

  • the very good performance against the index
  • the long term increases in sustainable income per unit

As has been noted, the fund has maintained a credit quality equal to or better than the index; outperformance is due to constant exploitation of trading anomalies.

Again, there are no predictions for the future! The fund will continue to trade between issues in an attempt to exploit market gaps in liquidity, in an effort to outperform the index and keep the sustainable income per unit – however calculated! – growing.

MAPF Portfolio Composition: April 2010

Sunday, May 2nd, 2010

Turnover was very low in April at about 10%. The current decline in the number trading opportunities is annoying, but one of the great constants in financial markets is a demand for liquidity and the fund is ready to meet that demand at a moment’s notice.

Trades were, as ever, triggered by a desire to exploit transient mispricing in the preferred share market (which may the thought of as “selling liquidity”), rather than any particular view being taken on market direction, sectoral performance or credit anticipation.

MAPF Sectoral Analysis 2010-4-30
HIMI Indices Sector Weighting YTW ModDur
Ratchet 0% N/A N/A
FixFloat 0% N/A N/A
Floater 0% N/A N/A
OpRet 0% N/A N/A
SplitShare 4.2% (+0.2) 8.17% 6.84
Interest Rearing 0% N/A N/A
PerpetualPremium 0.0% (0) N/A N/A
PerpetualDiscount 78.2% (+0.3) 6.47% 13.24
Fixed-Reset 12.2% (-0.1) 4.62% 3.66
Scraps (FixedReset) 5.0% (+0.1) 7.23% 12.33
Cash 0.5% (-0.3) 0.00% 0.00
Total 100% 6.33% 11.70
Totals and changes will not add precisely due to rounding. Bracketted figures represent change from March month-end. Cash is included in totals with duration and yield both equal to zero.

The “total” reflects the un-leveraged total portfolio (i.e., cash is included in the portfolio calculations and is deemed to have a duration and yield of 0.00.). MAPF will often have relatively large cash balances, both credit and debit, to facilitate trading. Figures presented in the table have been rounded to the indicated precision.

Credit distribution is:

MAPF Credit Analysis 2010-4-30
DBRS Rating Weighting
Pfd-1 0 (0)
Pfd-1(low) 66.9% (-1.8)
Pfd-2(high) 17.2% (+1.7)
Pfd-2 0 (0)
Pfd-2(low) 10.3% (+0.2)
Pfd-3(high) 5.0% (+0.1)
Cash 0.5% (-0.3)
Totals will not add precisely due to rounding. Bracketted figures represent change from March month-end.

Liquidity Distribution is:

MAPF Liquidity Analysis 2010-4-30
Average Daily Trading Weighting
<$50,000 0.0% (0)
$50,000 – $100,000 0.0% (0)
$100,000 – $200,000 24.1% (-0.6)
$200,000 – $300,000 45.1% (+11.6)
>$300,000 30.3% (-10.7)
Cash 0.5% (-0.3)
Totals will not add precisely due to rounding. Bracketted figures represent change from March month-end.

MAPF is, of course, Malachite Aggressive Preferred Fund, a “unit trust” managed by Hymas Investment Management Inc. Further information and links to performance, audited financials and subscription information are available the fund’s web page. A “unit trust” is like a regular mutual fund, but is sold by offering memorandum rather than prospectus. This is cheaper, but means subscription is restricted to “accredited investors” (as defined by the Ontario Securities Commission) and those who subscribe for $150,000+. Fund past performances are not a guarantee of future performance. You can lose money investing in MAPF or any other fund.

A similar portfolio composition analysis has been performed on the Claymore Preferred Share ETF (symbol CPD) as of August 17 and published in the September PrefLetter. When comparing CPD and MAPF:

  • MAPF credit quality is better
  • MAPF liquidity is a little better
  • MAPF Yield is higher
  • Weightings in
    • MAPF is much more exposed to PerpetualDiscounts
    • MAPF is much less exposed to Operating Retractibles
    • MAPF is more exposed to SplitShares
    • MAPF is less exposed to FixFloat / Floater / Ratchet
    • MAPF weighting in FixedResets is much lower

Index Performance: April 2010

Sunday, May 2nd, 2010

Performance of the HIMIPref™ Indices for April, 2010, was:

Total Return
Index Performance
April 2010
Three Months
to
April 30, 2010
Ratchet -0.83% +23.67%
FixFloat +0.96% +15.28%
Floater -1.16% +11.19%
OpRet -0.32% -0.68%
SplitShare -0.22% +0.63%
Interest -0.32%**** -0.68%****
PerpetualPremium -1.95% -3.45%
PerpetualDiscount -2.39% -6.92%
FixedReset -3.13% -2.27%
**** The last member of the InterestBearing index was transferred to Scraps at the June, 2009, rebalancing; subsequent performance figures are set equal to the OperatingRetractible index
Passive Funds (see below for calculations)
CPD -2.13% -2.90%
DPS.UN -2.47% -2.63%
Index
BMO-CM 50 % %
TXPR Total Return -2.17% -2.82%

The pre-tax interest equivalent spread of PerpetualDiscounts over Long Corporates (which I also refer to as the Seniority Spread) ended the month at +320bp, a sharp increase from +285bp at March month-end and +235bp recorded at February month-end. The decline in the PerpetualDiscount index was entirely due to an increase in the spread over corporates, since yields on long corporates actually declined from 5.8% to 5.7% in April.

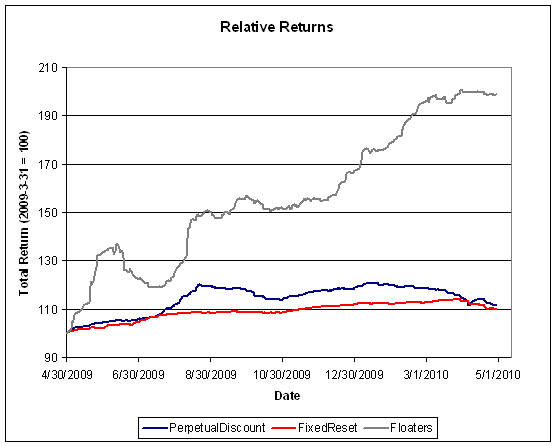
The relative returns on Floaters over the past year continues to impress, although returns moderated in April. Given the prices and yields, I suspect that we have now entered an era of normalcy for Floaters:


Click for big

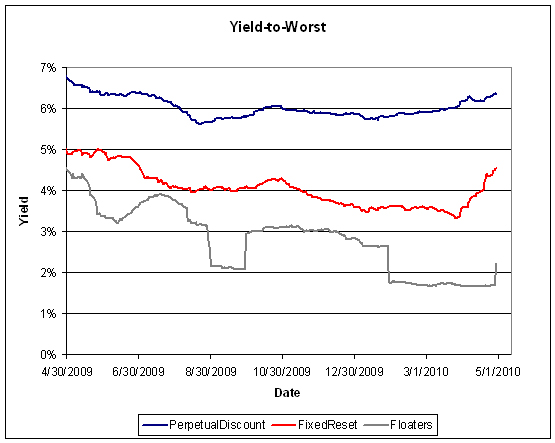
The relatively low duration of FixedResets means that the relatively restrained total return loss during the month masked a violent increase in yield:


Click for big

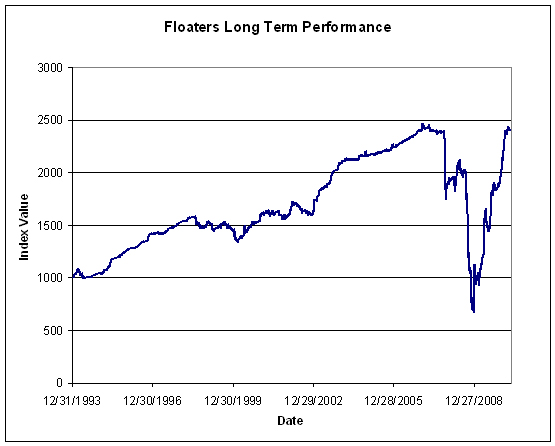
Floaters have had a wild ride:


Click for big

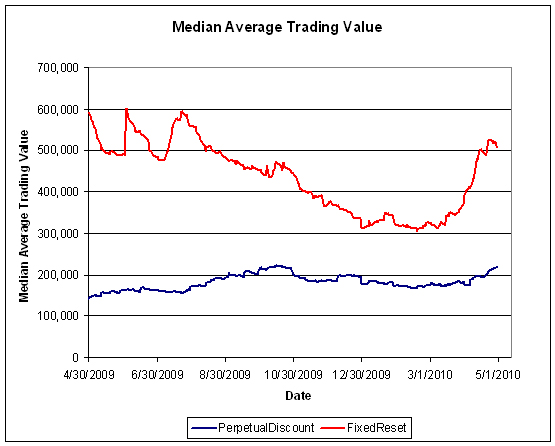
FixedReset volume picked up during the month. Volume may be under-reported due to the influence of Alternative Trading Systems (as discussed in the November PrefLetter), but I am biding my time before incorporating ATS volumes into the calculations, to see if the effect is transient or not.


Click for big

Who knows? Maybed we’ll get even more FixedReset volume in May, once investors receive their brokerage statements and learn that prices can also go down!

Compositions of the passive funds were discussed in the September edition of PrefLetter.

Claymore has published NAV and distribution data (problems with the page in IE8 can be kludged by using compatibility view) for its exchange traded fund (CPD) and I have derived the following table:

CPD Return, 1- & 3-month, to April 30, 2010
Date NAV Distribution Return for Sub-Period Monthly Return
January 29 16.80      
February 26, 2010 16.83     +0.18%
March 26 16.64 0.21 +0.12% -0.96%
March 31, 2010 16.46 0.00 -1.08%
April 30, 2010 16.11     -2.13%
Quarterly Return -2.90%

Claymore currently holds $428,556,482 (advisor & common combined) in CPD assets, down about $7-million from the $435,437,774 reported last month and up about $62-million from the $373,729,364 reported at year-end. The monthly decline in AUM of about 1.58% is smaller than the total return loss of 2.13%, implying that the ETF continues to attract assets.

The DPS.UN NAV for April 28 has been published so we may calculate the approximate March returns. On March 29, it went ex-Dividend for $0.30 according to the TMX.

DPS.UN NAV Return, April-ish 2010
Date NAV Distribution Return for sub-period Return for period
March 31, 2010 19.93      
April 28, 2010 19.45     -2.41%
Estimated April Ending Stub -0.06% *
Estimated April Return -2.47% ***
*CPD had a NAVPU of 16.12 on April 28 and 16.11 on April 30, hence the total return for the period for CPD was -0.06%. The return for DPS.UN in this period is presumed to be equal.
*** The estimated April return for DPS.UN’s NAV is therefore the product of two period returns, -2.41% and -0.06% to arrive at an estimate for the calendar month of -2.47%

Now, to see the DPS.UN quarterly NAV approximate return, we refer to the calculations for February and March:

DPS.UN NAV Returns, three-month-ish to end-April-ish, 2010
February-ish -1.61%
March-ish +1.47%
April-ish -2.47%
Three-months-ish -2.63%

HIMIPref™ Index Rebalancing: April 2010

Saturday, May 1st, 2010
HIMI Index Changes, April 30, 2010
Issue From To Because
CM.PR.R Scraps OpRet Volume
NA.PR.M PerpetualPremium PerpetualDiscount Price
PWF.PR.A Floater Scraps Volume

As a result of the migration from PerpetualPremium to PerpetualDiscount due to price declines, the PerpetualPremium index has only one remaining member: GWL.PR.O, a chimerical issue which can sometimes be a straight, sometimes a FixedFloater, depending on where Prime is.

There were the following intra-month changes:

HIMI Index Changes during April 2010
Issue Action Index Because
GWO.PR.E Delete OpRet Redeemed
BNS.PR.Y Add FixedReset New Issue

Best & Worst Performers: April 2010

Saturday, May 1st, 2010

These are total returns, with dividends presumed to have been reinvested at the bid price on the ex-date. The list has been restricted to issues in the HIMIPref™ indices.

April 2010
Issue Index DBRS Rating Monthly Performance Notes (“Now” means “April 30”)
ELF.PR.F Perpetual-Discount Pfd-2(low) -6.35% Now with a pre-tax bid-YTW of 7.34% based on a bid of 18.28 and a limitMaturity.
PWF.PR.G Perpetual-Discount Pfd-1(low) -5.61% Now with a pre-tax bid-YTW of 6.59% based on a bid of 22.48 and a limitMaturity.
GWO.PR.L Perpetual-Discount Pfd-1(low) -5.35% Now with a pre-tax bid-YTW of 6.48% based on a bid of 22.10 and a limitMaturity.
GWO.PR.M Perpetual-Discount Pfd-1(low) -5.32% Now with a pre-tax bid-YTW of 6.38% based on a bid of 18.36 and a limitMaturity.
BNS.PR.T Fixed-Reset Pfd-1(low) -5.29% I don’t think we’ve ever seen a FixedReset in this part of the table before! Now with a pre-tax bid-YTW of 4.96% based on a bid of 26.26 and a call 2014-5-25 at 25.00.
CM.PR.A OpRet Pfd-1(low) +0.59% Now with a pre-tax bid-TTW of -8.94% based on a bid of 25.55 and a call 2010-5-30 at 25.25. If it somehow survives to its SoftMaturity 2011-7-30 it will have yielded 3.51% … but you won’t see me betting on that!
PWF.PR.A Floater Pfd-1(low) +0.85% Will be dropped from the Floater index due to low volume.
BAM.PR.G FixFloat Pfd-2(low) +0.96% The second best performer in March and the fifth-best performer in February. Strong pair with BAM.PR.E
PWF.PR.D OpRet Pfd-1(low) +1.58% Now with a pre-tax bid-YTW of -8.46% based on a bid of 25.89 and a call 2010-5-30 at 25.60. If it makes it to its SoftMaturity 2012-10-30 at 25.00, it will have yielded 3.72% … another bet I won’t take!
BMO.PR.L Perpetual-Discount Pfd-1(low) +1.74% Now with a pre-tax bid-YTW of 6.07% based on a bid of 23.90 and a limitMaturity.

Nice to see an end to the Floating Rate hegemony over the Best Performers!

FTU.PR.A Reinstates Dividend, Pays Partial Arrears

Saturday, May 1st, 2010

US Financial 15 Split Corp. has announced:

the reinstatement of the regular monthly distribution of $0.04375 for each Preferred share ($0.525 annually) effective for the month of April as well as a dividend of $0.05 representing a portion of the accrued dividends in arrears. Both dividends will be payable on May 10, 2010 to Preferred shareholders on record as at April 30, 2010.

Management believes that the strong recovery in the US financial services companies held in the portfolio from the March 2009 lows combined with the current level of dividend income and option premiums from the covered call writing program presents the necessary conditions to reinstate the monthly dividend and to begin the process of making payments on the accrued dividends.

The 14 months of cumulative accrued dividends from February 2009 to March 2010 totaling $0.6125 per Preferred share are currently recorded as a liability of the Company and are accrued to the benefit of the Preferred shareholders. The accrued liability will decrease to $0.5625 per Preferred share after the payment of the $0.05 dividend. The timing and amount of any future payments of the cumulative dividends will be reviewed by the Board on an ongoing basis and will be based on market conditions, the level of the net asset value and income realized in the portfolio.

Regular monthly dividends of $0.04375 will continue each month and will be payable to Preferred shareholders on record on the last business day of each month.

The net asset value per unit as at April 15, 2010 was $7.17.

FTU.PR.A was last mentioned on PrefBlog when they published the 2009 Semi-Annual Financials. FTU.PR.A is tracked by HIMIPref™ but is relegated to the Scraps index on credit concerns.

April 30, 2010

Saturday, May 1st, 2010

I can’t resist picking on Basis Yield Alpha Fund (discussed yesterday; it’s crying about having bought Timberwolf notes from Goldman) a little bit more. It was among the earliest crunch casualties:

[2007-08-28] Basis Yield Alpha Fund, a hedge fund specializing in corporate and structured credit, on Wednesday filed for bankruptcy protection in the United States amid mounting losses from U.S. subprime mortgage assets, court papers show.

Earlier in the month, the hedge fund firm told investors that losses at one of its portfolios had lost more than 80 percent in assets.

Award winning!

Basis earned the “Fund of the Year” title at the 2005 AsiaHedge awards and Macquarie Bank Ltd.’s “Skilled Manager of the Year” in 2004.

The lenders got paid:

Banks that lent to failed hedge fund Basis Yield Alpha, run by Australia’s Basis Capital, are likely to get all their money back and there could be a payment to investors, the fund said. Yield Alpha, which started the year with about $700m, has returned to solvency and can afford to repay banks which seized the fund’s assets when it missed margin calls earlier this year. The development is a result of continued payouts by structured credits in which Basis invested, apparently resolving one of the few situations in which lenders to a hedge fund lost money. Basis became the second hedge fund group this year to see one of its funds collapse amid the US subprime crisis, after the failure of two funds run by Bear Stearns.

Budget cuts in Greece may put Canada’s 1990’s experience to shame:

Greek Prime Minister George Papandreou said the country’s survival was at stake in talks to win a potential $159 billion European Union-led bailout in exchange for budget cuts denounced by unions as “savage.”

Papandreou’s budget cuts may include a three-year wage freeze for public workers and eliminating two of their 14 annual salary payments, the ADEDY union said. Greece’s NET Radio reported that cuts could amount to 10 percentage points of gross domestic product. The deficit was 13.6 percent of GDP in 2009.

Other deficit-cutting steps include increasing sales tax and raising the cap on the number of workers who can be fired to 4 percent from 2 percent, Kathimerini newspaper said, without saying where it got the information.

There is a sort-of encouraging trend for US banks:

Gerald J. Ford, who became a billionaire by purchasing distressed lenders during the last banking crisis, isn’t waiting around during this one for Sheila Bair’s Federal Deposit Insurance Corp. to offer him a deal.

After bidding unsuccessfully on several lenders seized by the FDIC, Ford said he’s pushing ahead with a $500 million injection for Pacific Capital Bancorp, a California lender that has said it may collapse. He’s among the private-equity investors who are now willing to buy banks without an FDIC guarantee on loan losses.

“We’re trying to do this one sooner rather than later,” Ford, 65, said in an interview yesterday. “We’ve been out there looking for a long time.”

Private-equity firms are going after live banks after complaining the FDIC put up too many obstacles and changed the rules for buying failed lenders, which are piling up at the fastest rate in two decades. Three days before Ford’s deal, private-equity firm Thomas H. Lee Partners LP agreed to pay $134.7 million for a stake in Sterling Financial Corp., a Spokane, Washington-based lender that’s still open after posting two annual losses.

Both deals depend on the U.S. Treasury Department agreeing to take a loss on the stake held by its bank bailout fund. The Treasury signed on to the Sterling deal yesterday, according to the bank.

The Sterling accord calls for the bank to raise a total of $720 million and would give Boston-based Lee a 19.9 percent stake. The U.S. agreed to swap its $303 million stake for new securities valued at $75.8 million, Sterling said in a statement on April 29. Treasury spokesman Andrew Williams declined to comment and Richard Walsh Jr. at Thomas H. Lee didn’t immediately respond to a request for comment.

At Pacific Capital, the agency would be required to exchange $180.6 million for common shares at about 20 cents on the dollar, according to a statement. Pacific Capital has told investors it may not survive without new capital.

If Treasury is involved, then it’s a political issue – which it should be. However, the details of the deals would have to be examined very closely to see whether, all in, Treasury taking a loss now is better for taxpayers than the FDIC (maybe) taking a loss later.

The forces of do-goodism have received a mild rebuff:

Spain is lancing an 18 billion-euro ($24 billion) investment bubble in solar energy that has boosted public liabilities, choking off new projects as it works to cut power prices and insulate itself from Greece’s debt crisis.

Industry Minister Miguel Sebastian is negotiating reductions in subsidies for solar plants that would curb energy costs, a ministry spokesman said this week. Grupo T-Solar Global SA, the world’s biggest photovoltaic plant owner, shelved its Spanish stock offering three days ago. Solar Opportunities SL postponed a 130 million-euro deal due to be signed today.

Spain is battling on several fronts to revive its economy and convince government bondholders it can avoid getting dragged into a Greek-style debt spiral after Standard & Poor’s cut its credit rating April 28. Solar-plant owners including General Electric Co. earn about 12 times what’s paid for power from fossil fuels. Most of that is a subsidy charged to customers.

You can only waste money if you’ve got money to waste! Unfortunately, the Smitherman subsidy aimed at making Ontario a hot-bed of world-class lobbying is still considered sane.

OSFI’s Mark White has delivered a speech titled P&C Reinsurance to Fit the Times – A Question of Balance; the limits and collateralization rules on Property and Casualty reinsurance are being revamped. This follows the Response Paper: Reforming OSFI’s Regulatory and Supervisory Regime for Reinsurance, published in late March.

Transcripts from 2004 show that the Fed was perplexed by the early housing boom; at the June meeting a researcher stated:

With regard to the question of owning versus renting, it depends to some extent on what is happening to interest rates because that changes that calculation at the margin. So it’s really important to plot any kind of valuation measure relative to an opportunity cost. Just showing the rent-to-price ratio I think would have been somewhat misleading; it’s really that gap that we think is the meaningful measure of valuation. And it looks somewhat rich, taking account of the fact that interest rates are relatively low and income growth has been relatively strong. I don’t want to leave the impression that we think there’s a huge housing bubble. We believe a lot of the rise in house prices is rooted in fundamentals. But even after you account for the fundamentals, there’s a part of the increase that is hard to explain.

SEC Commissioner Luis A. Aguilar has delivered a speech to the Investment Adviser Association Annual Conference

The Senate Bill, however, has abandoned its strong position in the face of determined lobbying by the insurance and brokerage industries. The revised version that was voted out of the Senate Banking Committee on March 22nd has eliminated the provision applying the fiduciary standard to brokers who provide investment advice. It would, instead, require a one-year study by the SEC concerning the effectiveness of existing standards for “providing personalized investment advice and recommendations about securities to retail customers.”

I continue to have concerns about this retreat from requiring a fiduciary standard for all who provide investment advice. First, I see no need to study the effectiveness of existing obligations for investment advisers. We already have a strong, workable standard that has been in use successfully for decades, and I would not support any attempt to weaken it. Second, as with the House Bill, I question why the protection of the fiduciary standard should be limited to “retail” customers. It is readily apparent from recent Commission enforcement cases — such as the cases involving auction rate securities — that all investors, including institutional investors, need the protection of the fiduciary standard. Third, I question why the study, as well as the reach of the House Bill, should be limited to “personalized services.” This qualification would narrow the range of clients that would be protected by the fiduciary standard, and I fear that it may become a loophole that would make it easy to avoid putting clients first.

This is completely insane. Institutional investors are acting as fiduciaries for the institutions they represent. How many layers of fiduciary responsibility are necessary? How many have to be paid for? Why do F-Class and discount brokerages exist in the first place? As discussed yesterday, an institutional investor will discuss trades with the sell side with the clear understanding that his counterparty wants to clean him out and send him home naked and hungry. Any buy-side investor who does not understand this – and does not understand that there is exactly one layer of fiduciary between the lions and lambs an that he’s it; or who does not devote independent analysis to each investment idea with precisely this fact in mind – should lose his license. I am sick to bloody death of politicians and regulators telling me that I’m too stupid to negotiate deals for my clients — and that only the sell side can be trusted with such important decisions.

Commissioner Aguilar’s background should be noted:

Prior to his appointment as an SEC Commissioner, Mr. Aguilar was a partner with the international law firm of McKenna Long & Aldridge, LLP, specializing in securities law. During his career, his practice included matters pertaining to general corporate and business law, international transactions, investment companies and investment advisers, securities law, and corporate finance. He also focused on issues related to corporate governance, public and private offerings (IPOs and secondary offerings), mergers and acquisitions, mutual funds, investment advisers, broker-dealers, and other aspects of federal and state securities laws and regulations.

A lawyer. Almost certainly has never been on the ‘phone and said “done” in his life.

A long, long month for Canadian preferred share investors shuddered to an end today with, wonder of wonders, gains for both PerpetualDiscounts (up 5bp) and FixedResets (up 3bp). Volume continued heavy.

PerpetualDiscounts now yield 6.35%, equivalent to 8.89% interest at the standard equivalency factor of 1.4x. Long corporates have returned +1.21% on the month (+6.29% on the year-to-date) and now yield about 5.7%, making the pre-tax interest-equivalent spread (also called the Seniority Spread) about 320bp, about the same as was reported April 28 and a massive jump higher than the +285 bp reported March 31.

HIMIPref™ Preferred Indices
These values reflect the December 2008 revision of the HIMIPref™ Indices

Values are provisional and are finalized monthly
Index Mean
Current
Yield
(at bid)
Median
YTW
Median
Average
Trading
Value
Median
Mod Dur
(YTW)
Issues Day’s Perf. Index Value
Ratchet 2.58 % 2.66 % 51,230 20.94 1 -2.1525 % 2,144.0
FixedFloater 4.94 % 3.01 % 45,896 20.36 1 0.0000 % 3,237.9
Floater 1.92 % 1.66 % 45,744 23.47 4 -0.0609 % 2,408.2
OpRet 4.90 % 3.96 % 102,875 1.05 10 0.0703 % 2,303.4
SplitShare 6.40 % 6.53 % 135,075 3.57 2 -0.1982 % 2,133.3
Interest-Bearing 0.00 % 0.00 % 0 0.00 0 0.0703 % 2,106.3
Perpetual-Premium 5.91 % 4.77 % 25,341 15.86 2 -0.0205 % 1,822.8
Perpetual-Discount 6.28 % 6.35 % 215,916 13.41 76 0.0523 % 1,700.1
FixedReset 5.56 % 4.55 % 506,444 3.60 44 0.0296 % 2,128.1
Performance Highlights
Issue Index Change Notes
ELF.PR.F Perpetual-Discount -3.79 % YTW SCENARIO
Maturity Type : Limit Maturity
Maturity Date : 2040-04-30
Maturity Price : 18.28
Evaluated at bid price : 18.28
Bid-YTW : 7.34 %
BAM.PR.E Ratchet -2.15 % YTW SCENARIO
Maturity Type : Limit Maturity
Maturity Date : 2040-04-30
Maturity Price : 22.52
Evaluated at bid price : 21.82
Bid-YTW : 2.66 %
BNS.PR.T FixedReset -1.46 % YTW SCENARIO
Maturity Type : Call
Maturity Date : 2014-05-25
Maturity Price : 25.00
Evaluated at bid price : 26.26
Bid-YTW : 4.96 %
BNS.PR.Y FixedReset -1.37 % YTW SCENARIO
Maturity Type : Limit Maturity
Maturity Date : 2040-04-30
Maturity Price : 23.68
Evaluated at bid price : 23.72
Bid-YTW : 4.13 %
BAM.PR.B Floater -1.30 % YTW SCENARIO
Maturity Type : Limit Maturity
Maturity Date : 2040-04-30
Maturity Price : 17.47
Evaluated at bid price : 17.47
Bid-YTW : 2.26 %
TRP.PR.B FixedReset -1.23 % YTW SCENARIO
Maturity Type : Limit Maturity
Maturity Date : 2040-04-30
Maturity Price : 23.97
Evaluated at bid price : 24.01
Bid-YTW : 4.36 %
NA.PR.K Perpetual-Discount -1.07 % YTW SCENARIO
Maturity Type : Limit Maturity
Maturity Date : 2040-04-30
Maturity Price : 22.91
Evaluated at bid price : 23.20
Bid-YTW : 6.32 %
GWO.PR.L Perpetual-Discount 1.01 % YTW SCENARIO
Maturity Type : Limit Maturity
Maturity Date : 2040-04-30
Maturity Price : 22.01
Evaluated at bid price : 22.10
Bid-YTW : 6.48 %
BNS.PR.P FixedReset 1.15 % YTW SCENARIO
Maturity Type : Call
Maturity Date : 2013-05-25
Maturity Price : 25.00
Evaluated at bid price : 25.50
Bid-YTW : 4.33 %
GWO.PR.G Perpetual-Discount 1.39 % YTW SCENARIO
Maturity Type : Limit Maturity
Maturity Date : 2040-04-30
Maturity Price : 20.43
Evaluated at bid price : 20.43
Bid-YTW : 6.45 %
GWO.PR.H Perpetual-Discount 1.64 % YTW SCENARIO
Maturity Type : Limit Maturity
Maturity Date : 2040-04-30
Maturity Price : 19.16
Evaluated at bid price : 19.16
Bid-YTW : 6.42 %
IAG.PR.C FixedReset 1.72 % YTW SCENARIO
Maturity Type : Call
Maturity Date : 2014-01-30
Maturity Price : 25.00
Evaluated at bid price : 26.05
Bid-YTW : 5.14 %
Volume Highlights
Issue Index Shares
Traded
Notes
BMO.PR.P FixedReset 105,057 RBC crossed 100,000 at 25.73.
YTW SCENARIO
Maturity Type : Call
Maturity Date : 2015-03-27
Maturity Price : 25.00
Evaluated at bid price : 25.70
Bid-YTW : 4.69 %
SLF.PR.A Perpetual-Discount 86,546 TD crossed 50,000 at 18.60.
YTW SCENARIO
Maturity Type : Limit Maturity
Maturity Date : 2040-04-30
Maturity Price : 18.57
Evaluated at bid price : 18.57
Bid-YTW : 6.48 %
RY.PR.T FixedReset 74,915 RBC crossed 64,000 at 24.70.
YTW SCENARIO
Maturity Type : Call
Maturity Date : 2014-09-23
Maturity Price : 25.00
Evaluated at bid price : 26.70
Bid-YTW : 4.50 %
RY.PR.A Perpetual-Discount 67,551 Nesbitt crossed 50,000 at 18.65.
YTW SCENARIO
Maturity Type : Limit Maturity
Maturity Date : 2040-04-30
Maturity Price : 18.64
Evaluated at bid price : 18.64
Bid-YTW : 5.98 %
BNS.PR.R FixedReset 65,984 RBC crossed two blocks of 30,000 each at 25.45.
YTW SCENARIO
Maturity Type : Call
Maturity Date : 2014-02-25
Maturity Price : 25.00
Evaluated at bid price : 25.50
Bid-YTW : 4.44 %
RY.PR.X FixedReset 63,946 RBC crossed two blocks of 25,000 each at 26.65.
YTW SCENARIO
Maturity Type : Call
Maturity Date : 2014-09-23
Maturity Price : 25.00
Evaluated at bid price : 26.61
Bid-YTW : 4.60 %
There were 55 other index-included issues trading in excess of 10,000 shares.