Archive for September, 2010

BCE Buys CTV

Friday, September 10th, 2010

BCE Inc. has announced:

it has agreed to acquire 100% of CTV, the Canadian leader in specialtytelevision, digital media, conventional TV and radio broadcasting.

Bell currently owns a 15% equity position in CTV and will acquire the remaining 85% for $1.3 billion inequity value from The Woodbridge Company Limited, the Toronto-based holding company of the Thomsonfamily; Ontario Teachers Pension Plan; and Torstar Corporation. Including the value of Bell’s present stake,the transaction has an equity value of $1.5 billion. Together with $1.7 billion in proportionate debt, the totaltransaction value is $3.2 billion. The purchase price represents a multiple of 10x proportionate EBITDA,comparable with similar recent media-industry transactions. In a separate transaction, Woodbridge willacquire ownership of the Globe and Mail, in which Bell will continue to retain a 15% equity position.

Video is growing rapidly in popularity among Canadians, who are increasingly moving to mobile, online anddigital TV platforms for video content. Bell already offers Canada’s leading High Definition TV and onlineservices and the most advanced mobile TV products, and is in the process of launching its leading-edgeBell Fibe IPTV (internet protocol television) service in major urban centres. Bell TV now representsapproximately 40% of total residential service revenues, surpassing traditional home phone revenues.Bell is accelerating its wireline and wireless video capabilities with significant new investments in broadbandnetworks, including capital expenditures of almost $3 billion in 2010 alone. Bell is rolling out high-speedfibre to more houses, apartments, condominiums and businesses in Québec and Ontario to support newInternet and TV services and is enhancing its new world-leading HSPA+ wireless network, which alreadyserves 93% of the Canadian population.

“The transaction purchase price represents an attractive standalone valuation for Canada’s leading mediaprovider even before upside opportunities from monetizing CTV’s programming across all of Bell’sbroadband wireless and wireline platforms. This acquisition is entirely consistent with Bell’s shareholdervalue objectives and dividend growth model,” said Siim Vanaselja, Chief Financial Officer for Bell Canadaand BCE. “It is immediately accretive to earnings and to free cash flow before potential synergies, with100% access to CTV cash flows. Bell’s acquisition of CTV will be funded with a new, fully committed bankfacility of $2 billion, $750 million in new BCE common shares that will be issued to Woodbridge, andsurplus cash on hand. The resulting pro forma net leverage of 2x EBITDA is consistent with Bell’s capitalstructure and financial policies. Based on our discussions with the rating agencies, we expect our creditratings to be confirmed.”

Bell will hold a conference call for financial analysts to discuss its acquisition of CTV today at 9:30amEastern. Media are welcome to participate on a listen-only basis. To participate, please dial (416) 340-8018or toll-free 1-866-223-7781 shortly before the start of the call. A replay will be available for one week bydialing (416) 695-5800 or 1-800-408-3053 and entering pass code 6461260 followed by the number sign.There will also be a live audio webcast of the call available at www.bce.ca/en/news/eventscalendar/webcasts/2010/20100910. The MP3 file will be available for download on this page later in the day.

DBRS has announced that it:

has today confirmed the long- and short-term ratings of BCE Inc. (BCE) and its wholly-owned operating subsidiary, Bell Canada, at A (low) and R-1 (low), following Bell Canada’s announcement today that it will acquire 85% of CTVglobemedia Inc. (CTV) and its television, digital media and radio operations (excluding The Globe and Mail) for $1.3 billion in equity value. The trend on all ratings is Stable.

From a financial perspective, while the acquisition of CTV will slightly weaken Bell Canada’s credit metrics, DBRS believes that the impact will be manageable. DBRS anticipates that while Bell Canada’s gross debt-to-EBITDA is expected to increase from roughly 1.52x (at June 30, 2010), this ratio is not expected to exceed 2.0x with the acquisition of CTV. DBRS does note that the financing of the acquisition of CTV, along with the refinancing of the majority of its existing debt, is expected to be carried out at the Bell Canada level. As such, CTV will support the credit profile of Bell Canada once the transaction closes.

BCE has a plethora of FixedFloaters and Ratchets outstanding. Tracked by HIMIPref™ are: BCE.PR.A, BCE.PR.B, BCE.PR.C, BCE.PR.D, BCE.PR.F, BCE.PR.G, BCE.PR.H, BCE.PR.I, BCE.PR.R, BCE.PR.S, BCE.PR.T, BCE.PR.Y and BCE.PR.Z. Not tracked by HIMIPref™, for no particularly good reason, is BCE.PR.E.

All the tracked issues are relegated to the Scraps index on credit concerns.

IIROC Issues Flash Crash Review

Friday, September 10th, 2010

The Investment Industry Regulatory Organization of Canada has announced its release of the Review of the Market Events of May 6, 2010:

The factors that contributed to the trading patterns are:

  • The existence of large sell imbalances: A number of the securities showed more sell interest beginning at the opening of trading on May 6 and in some cases the ratio of sell volume to buy volume was upwards of 3:1.
  • Electronic trading activity in the securities: High Frequency Traders (“HFT”) and Electronic Liquidity Providers (“ELP”) were trading in a number of the securities reviewed. Although the definitions of the above terms are open to discussion, we are using these terms to identify fast and relatively dominant electronic traders. The review shows that after the sudden sharp decline in the US indices, a number of HFTs and ELPs quickly withdrew from the Canadian market causing a dramatic and rapid decline in available liquidity. This withdrawal was particularly apparent on the buy side putting further pressure on prices. Some HFT entities remained in the market but predominately on the sell side and we noted markedly reduced liquidity. The withdrawal of HFTs and ELPs was particularly apparent in the heavily traded ETFs that were reviewed. IIROC is aware that some of the ELP and HFTs withdrew from the US market due to their concern about significant latencies in their data feeds from the US markets.
  • “Traditional” market makers were not active in the review securities with the exception of the four highly liquid ETFs. IIROC found that market makers were present and fulfilling their obligations on the other securities reviewed including their oddlot and spread goals.
  • The triggering of Stop Loss Orders: In many cases the triggering of Stop Loss Orders was a major contributor to the deeper price declines experienced by a number of the securities reviewed. The analysis suggests that many of the egregious price declines were due to Stop Loss Order activity from Stop Loss “market” Orders as opposed to Stop Loss “limit” Orders.

No data is presented in the report that support any of the conclusions. Trust your regulators! They’re very smart, and beholden to nobody.

Recommendations are:

  • The CSA and IIROC should review the current market wide circuit breaker to determine if the current trigger levels are appropriate and whether an independent Canadian-based circuit breaker level is required.
  • IIROC along with the CSA should investigate whether single stock circuit breakers in the form of temporary trading halts should be implemented in Canada.
  • All marketplaces should adopt volatility controls and the form and the level of these controls should be reviewed to assess to what degree they ought to be harmonized.
  • All IIROC dealers should consider how to effectively manage Stop Loss Orders in the current high-speed, multi-market environment. IIROC firms should also provide their RRs and clients, including those who enter their orders directly on to the marketplace without personalized advice, with guidance on the use of Stop Loss Orders effectively in a high speed, multimarket environment.
  • IIROC should review the current erroneous and unreasonable price policies and procedures, taking into account the experience of May 6.

Circuit breakers? While my natural inclination is that nothing should get in the way of two parties agreeing to a trade, I can’t really get excited over circuit breakers one way or another anyway. When the market gets as wild as it did during the flash crash, the only sensible thing to do is to go out and get a cup of coffee.

It appears that there will be more regulatory paperwork surrounding Stop Loss orders, but we’ll see how that works out. Anybody stupid enough to use a stop-loss order in the first place isn’t going to be impressed by another piece of paper.

Update: The SEC has approved new circuit breaker and trade-busting rules:

The Securities and Exchange Commission today approved new rules submitted by the national securities exchanges and FINRA to expand a recently-adopted circuit breaker program to include all stocks in the Russell 1000 Index and certain exchange-traded funds. The SEC also approved new exchange and FINRA rules that clarify the process for breaking erroneous trades.

A list of the securities included in the Russell 1000 Index, which was rebalanced on June 25, is available on the Russell website. The list of exchange-traded products included in the pilot is available on the SEC’s website. The SEC anticipates that the exchanges and FINRA will begin implementing the expanded circuit breaker program early next week.

For stocks that are subject to the circuit breaker program, trades will be broken at specified levels depending on the stock price:

  • For stocks priced $25 or less, trades will be broken if the trades are at least 10 percent away from the circuit breaker trigger price.
  • For stocks priced more than $25 to $50, trades will be broken if they are 5 percent away from the circuit breaker trigger price.
  • For stocks priced more than $50, the trades will be broken if they are 3 percent away from the circuit breaker trigger price.

Where circuit breakers are not applicable, the exchanges and FINRA will break trades at specified levels for events involving multiple stocks depending on how many stocks are involved:

  • For events involving between five and 20 stocks, trades will be broken that are at least 10 percent away from the “reference price,” typically the last sale before pricing was disrupted.
  • For events involving more than 20 stocks, trades will be broken that are at least 30 percent away from the reference price.
  • September 9, 2010

    Friday, September 10th, 2010

    Deutsche Bank is rumoured to be considering a big equity issue:

    Deutsche Bank AG has approached investment banks to assess their interest in managing a stock sale to raise as much as 9 billion euros ($11.4 billion), said three people with knowledge of the discussions.

    Proposed rules under consideration by the Basel Committee on Banking Supervision may also lead banks to raise reserves. Germany’s 10 biggest lenders, including Deutsche Bank and Commerzbank AG, may need about 105 billion euros in fresh capital because of new regulation, the Association of German Banks estimated on Sept. 6.

    The lenders would need to raise that sum to reach an estimated 10 percent Tier 1 capital ratio, a key measure of financial strength, according to Dirk Jaeger, who is responsible for regulatory topics at the group.

    The Swiss are hoping to grab some of the UK hedge fund business:

    Swiss managers rank third in Europe, with 4 percent of the market, behind London’s 75 percent share and Sweden with 5 percent. Brevan Howard Asset Management LLP, Europe’s biggest hedge fund, and third-ranked BlueCrest Capital Management Ltd. have both opened offices in Geneva this year.

    “Heavy competition between cantons has helped to keep tax rates low,” making Switzerland more appealing, Regina Anhorn, one of the study’s authors, said in a presentation in Zurich. “We have seen famous names move part of their institution to Switzerland. We may see many more to come.”

    There are signs that fees charged by Swiss hedge funds fell over the past two years, from a typical 2 percent management fee and a 20 percent share of performance, according to the study. A 1 percent management fee is “increasing in popularity” together with a performance fee of 10 percent, it said.

    A laudatory article about CalPERS new boss highlights the gravity of the US pension committments:

    In 2000, more than half of the 50 states had the funds to cover what they owed. By 2008, that number had shrunk to four — Florida, New York, Washington and Wisconsin — as total unfunded liabilities reached a record $1 trillion, according to a February 2010 report by the Pew Center on the States that uses the latest available data.

    [CalPERS] has earned an annualized 2.88 percent return on its assets through the 10 years ended on June 30, far below the 7.75 percent it must collect every year to meet its obligations to 1.6 million beneficiaries.

    Calpers’s unfunded liabilities amounted to $240 billion as of 2008, leaving it with only half of the assets it needs to make its required payouts, according to a Stanford University study released in April.

    As a group, state retirement systems earned a median 3.4 percent annualized return for the 10 years ended on June 30, according to Wilshire Associates Inc., a Santa Monica, California-based investment consulting firm. That about matches the performance of U.S. Treasury bonds.

    Even if pensions do exploit the latest financial engineering and hit their 8 percent annualized return target, many will run out of money in the next 20 years, beginning with Illinois in 2018, says Joshua Rauh, an associate professor of finance at Northwestern University near Chicago. California would run dry in 2030, he says.

    So who’s going to solve the problem?

    Dear is an unlikely candidate to refashion Calpers’s investment approach. In contrast to past CIOs, he doesn’t have a Ph.D. in economics or experience in managing money on the Street. He’s a one-time labor official who came up through the hurly-burly of state politics in Washington.

    Great move! Perhaps the Maple Leafs should start hiring non-hockey players, too!

    Blair W. Keefe of Tory’s wrote a very good article titled Canada: Financial Institutions Experience Slower Activity In Capital Markets:

    In April, Canadian banks provided a quantitative impact study to OSFI on the implications of the proposed changes for individual institutions. And OSFI submitted data from the study to the Basel Committee in mid-May. Although the submission is confidential, we understand that the Basel III capital rules would have a significant negative impact on the existing capital ratios of the Canadian banks; the data will be analyzed, together with the results from other jurisdictions, and the preliminary findings will be presented to the Basel Committee in July.

    However, no new offerings of innovative Tier 1 capital will be made because such instruments will not be permitted under the Basel III capital rules.9 It is uncertain how long the existing innovative Tier 1 instruments will be grandfathered when the new rules come into force. This is significant, since Canadian financial institutions currently have over C$20 billion in innovative Tier 1 instruments outstanding and they were products favoured by institutional investors.

    Finally, with the uncertainty over the ultimate definition of capital and the quantity of capital that will be required, OSFI has been advising institutions that any material redemption of capital instruments should be funded with new capital issuances. In that regard, the aggregate amount of innovative Tier 1 capital that is scheduled to be redeemed on June 30 or December 31 of this year is C$2.1 billion.

    It was a very good day with high volume on the Canadian preferred share market, with PerpetualDiscounts gaining 56bp and FixedResets winning 13bp. MFC issues were again prominent in the volume highlights.

    HIMIPref™ Preferred Indices
    These values reflect the December 2008 revision of the HIMIPref™ Indices

    Values are provisional and are finalized monthly
    Index Mean
    Current
    Yield
    (at bid)
    Median
    YTW
    Median
    Average
    Trading
    Value
    Median
    Mod Dur
    (YTW)
    Issues Day’s Perf. Index Value
    Ratchet 0.00 % 0.00 % 0 0.00 0 0.6786 % 2,054.6
    FixedFloater 0.00 % 0.00 % 0 0.00 0 0.6786 % 3,112.4
    Floater 2.95 % 3.49 % 63,995 18.46 3 0.6786 % 2,218.4
    OpRet 4.87 % 1.31 % 93,226 0.22 9 0.1884 % 2,365.8
    SplitShare 5.96 % -36.90 % 69,384 0.09 2 0.1646 % 2,363.2
    Interest-Bearing 0.00 % 0.00 % 0 0.00 0 0.1884 % 2,163.3
    Perpetual-Premium 5.72 % 5.48 % 131,993 5.38 14 0.3239 % 1,980.1
    Perpetual-Discount 5.63 % 5.72 % 188,892 14.27 63 0.5633 % 1,931.2
    FixedReset 5.25 % 3.08 % 269,674 3.33 47 0.1319 % 2,264.3
    Performance Highlights
    Issue Index Change Notes
    NA.PR.N FixedReset -1.12 % YTW SCENARIO
    Maturity Type : Call
    Maturity Date : 2013-09-14
    Maturity Price : 25.00
    Evaluated at bid price : 26.50
    Bid-YTW : 3.32 %
    CM.PR.H Perpetual-Discount 1.01 % YTW SCENARIO
    Maturity Type : Limit Maturity
    Maturity Date : 2040-09-09
    Maturity Price : 21.75
    Evaluated at bid price : 22.06
    Bid-YTW : 5.50 %
    IAG.PR.C FixedReset 1.04 % YTW SCENARIO
    Maturity Type : Call
    Maturity Date : 2014-01-30
    Maturity Price : 25.00
    Evaluated at bid price : 27.29
    Bid-YTW : 3.24 %
    BNS.PR.L Perpetual-Discount 1.04 % YTW SCENARIO
    Maturity Type : Limit Maturity
    Maturity Date : 2040-09-09
    Maturity Price : 21.40
    Evaluated at bid price : 21.40
    Bid-YTW : 5.33 %
    PWF.PR.F Perpetual-Discount 1.07 % YTW SCENARIO
    Maturity Type : Limit Maturity
    Maturity Date : 2040-09-09
    Maturity Price : 22.50
    Evaluated at bid price : 22.76
    Bid-YTW : 5.84 %
    BAM.PR.R FixedReset 1.13 % YTW SCENARIO
    Maturity Type : Call
    Maturity Date : 2016-07-30
    Maturity Price : 25.00
    Evaluated at bid price : 26.94
    Bid-YTW : 4.09 %
    BAM.PR.B Floater 1.13 % YTW SCENARIO
    Maturity Type : Limit Maturity
    Maturity Date : 2040-09-09
    Maturity Price : 15.21
    Evaluated at bid price : 15.21
    Bid-YTW : 3.49 %
    RY.PR.H Perpetual-Premium 1.18 % YTW SCENARIO
    Maturity Type : Call
    Maturity Date : 2017-06-23
    Maturity Price : 25.00
    Evaluated at bid price : 25.80
    Bid-YTW : 5.17 %
    BAM.PR.K Floater 1.27 % YTW SCENARIO
    Maturity Type : Limit Maturity
    Maturity Date : 2040-09-09
    Maturity Price : 15.20
    Evaluated at bid price : 15.20
    Bid-YTW : 3.49 %
    CM.PR.I Perpetual-Discount 1.35 % YTW SCENARIO
    Maturity Type : Limit Maturity
    Maturity Date : 2040-09-09
    Maturity Price : 21.41
    Evaluated at bid price : 21.70
    Bid-YTW : 5.47 %
    BNS.PR.M Perpetual-Discount 1.42 % YTW SCENARIO
    Maturity Type : Limit Maturity
    Maturity Date : 2040-09-09
    Maturity Price : 21.39
    Evaluated at bid price : 21.39
    Bid-YTW : 5.34 %
    ELF.PR.F Perpetual-Discount 1.67 % YTW SCENARIO
    Maturity Type : Limit Maturity
    Maturity Date : 2040-09-09
    Maturity Price : 21.92
    Evaluated at bid price : 21.92
    Bid-YTW : 6.16 %
    HSB.PR.C Perpetual-Discount 2.39 % YTW SCENARIO
    Maturity Type : Limit Maturity
    Maturity Date : 2040-09-09
    Maturity Price : 23.31
    Evaluated at bid price : 23.55
    Bid-YTW : 5.51 %
    TD.PR.S FixedReset 2.97 % YTW SCENARIO
    Maturity Type : Call
    Maturity Date : 2013-08-30
    Maturity Price : 25.00
    Evaluated at bid price : 27.39
    Bid-YTW : 1.77 %
    ELF.PR.G Perpetual-Discount 3.08 % YTW SCENARIO
    Maturity Type : Limit Maturity
    Maturity Date : 2040-09-09
    Maturity Price : 20.05
    Evaluated at bid price : 20.05
    Bid-YTW : 6.03 %
    HSB.PR.D Perpetual-Discount 3.23 % YTW SCENARIO
    Maturity Type : Limit Maturity
    Maturity Date : 2040-09-09
    Maturity Price : 23.11
    Evaluated at bid price : 23.33
    Bid-YTW : 5.45 %
    Volume Highlights
    Issue Index Shares
    Traded
    Notes
    MFC.PR.C Perpetual-Discount 72,059 YTW SCENARIO
    Maturity Type : Limit Maturity
    Maturity Date : 2040-09-09
    Maturity Price : 18.38
    Evaluated at bid price : 18.38
    Bid-YTW : 6.16 %
    TD.PR.G FixedReset 69,250 TD crossed two blocks of 25,000 each, both at 28.00.
    YTW SCENARIO
    Maturity Type : Call
    Maturity Date : 2014-05-30
    Maturity Price : 25.00
    Evaluated at bid price : 27.97
    Bid-YTW : 3.08 %
    BNS.PR.Y FixedReset 67,365 RBC crossed 38,800 at 25.15.
    YTW SCENARIO
    Maturity Type : Limit Maturity
    Maturity Date : 2040-09-09
    Maturity Price : 25.13
    Evaluated at bid price : 25.18
    Bid-YTW : 3.26 %
    MFC.PR.A OpRet 65,854 YTW SCENARIO
    Maturity Type : Soft Maturity
    Maturity Date : 2015-12-18
    Maturity Price : 25.00
    Evaluated at bid price : 24.99
    Bid-YTW : 4.11 %
    RY.PR.X FixedReset 61,250 rBC crossed 50,000 at 28.07.
    YTW SCENARIO
    Maturity Type : Call
    Maturity Date : 2014-09-23
    Maturity Price : 25.00
    Evaluated at bid price : 28.00
    Bid-YTW : 3.17 %
    TRP.PR.A FixedReset 60,517 rbC crossed blocks of 15,200 and 25,000, both at 26.10.
    YTW SCENARIO
    Maturity Type : Call
    Maturity Date : 2015-01-30
    Maturity Price : 25.00
    Evaluated at bid price : 26.05
    Bid-YTW : 3.52 %
    There were 61 other index-included issues trading in excess of 10,000 shares.

    September 8, 2010

    Wednesday, September 8th, 2010

    Nothing happened today.

    It was a strong day on the Canadian preferred share market AGAIN, on good volume AGAIN, with MFC issues featured on the volume table AGAIN. This is getting a little dull. PerpetualDiscounts were up 28bp, while FixedResets gained 8bp, taking the median weighted average yield on the latter class down to 3.06% … creeping slowly towards the magic 3% mark.

    PerpetualDiscounts now yield 5.75%, equivalent to 8.05% interest at the standard equivalency factor of 1.4x. Long Corporates now yield about 5.35%, so the pre-tax interest-equivalent spread (also called the Seniority Spread) now stands at 270bp, a significant tightening from the 280bp reported on September 1, as PerpetualDiscount yields and long corporate yields made small moves in opposite directions.

    HIMIPref™ Preferred Indices
    These values reflect the December 2008 revision of the HIMIPref™ Indices

    Values are provisional and are finalized monthly
    Index Mean
    Current
    Yield
    (at bid)
    Median
    YTW
    Median
    Average
    Trading
    Value
    Median
    Mod Dur
    (YTW)
    Issues Day’s Perf. Index Value
    Ratchet 0.00 % 0.00 % 0 0.00 0 0.2078 % 2,040.7
    FixedFloater 0.00 % 0.00 % 0 0.00 0 0.2078 % 3,091.4
    Floater 2.72 % 3.23 % 61,436 19.07 3 0.2078 % 2,203.4
    OpRet 4.88 % 0.87 % 94,676 0.22 9 0.0943 % 2,361.4
    SplitShare 5.97 % -35.61 % 65,905 0.09 2 0.0824 % 2,359.3
    Interest-Bearing 0.00 % 0.00 % 0 0.00 0 0.0943 % 2,159.3
    Perpetual-Premium 5.74 % 5.54 % 131,411 5.38 14 0.1156 % 1,973.7
    Perpetual-Discount 5.66 % 5.75 % 189,663 14.22 63 0.2831 % 1,920.4
    FixedReset 5.25 % 3.06 % 268,246 3.33 47 0.0750 % 2,261.3
    Performance Highlights
    Issue Index Change Notes
    IAG.PR.C FixedReset -1.03 % YTW SCENARIO
    Maturity Type : Call
    Maturity Date : 2014-01-30
    Maturity Price : 25.00
    Evaluated at bid price : 27.01
    Bid-YTW : 3.58 %
    GWO.PR.M Perpetual-Discount 1.02 % YTW SCENARIO
    Maturity Type : Limit Maturity
    Maturity Date : 2040-09-08
    Maturity Price : 24.54
    Evaluated at bid price : 24.75
    Bid-YTW : 5.87 %
    POW.PR.C Perpetual-Discount 1.22 % YTW SCENARIO
    Maturity Type : Limit Maturity
    Maturity Date : 2040-09-08
    Maturity Price : 24.57
    Evaluated at bid price : 24.93
    Bid-YTW : 5.90 %
    BAM.PR.M Perpetual-Discount 1.47 % YTW SCENARIO
    Maturity Type : Limit Maturity
    Maturity Date : 2040-09-08
    Maturity Price : 20.05
    Evaluated at bid price : 20.05
    Bid-YTW : 6.05 %
    RY.PR.H Perpetual-Premium 1.76 % YTW SCENARIO
    Maturity Type : Call
    Maturity Date : 2017-06-23
    Maturity Price : 25.00
    Evaluated at bid price : 25.50
    Bid-YTW : 5.37 %
    Volume Highlights
    Issue Index Shares
    Traded
    Notes
    MFC.PR.A OpRet 193,380 RBC crossed blocks of 50,000 and 46,600, both at 25.00.
    YTW SCENARIO
    Maturity Type : Soft Maturity
    Maturity Date : 2015-12-18
    Maturity Price : 25.00
    Evaluated at bid price : 24.97
    Bid-YTW : 4.12 %
    MFC.PR.C Perpetual-Discount 112,745 RBC crossed 75,000 at 18.35.
    YTW SCENARIO
    Maturity Type : Limit Maturity
    Maturity Date : 2040-09-08
    Maturity Price : 18.33
    Evaluated at bid price : 18.33
    Bid-YTW : 6.17 %
    GWL.PR.O Perpetual-Premium 82,950 Called for redemption. TD crossed 79,000 at 25.21.
    YTW SCENARIO
    Maturity Type : Call
    Maturity Date : 2010-11-30
    Maturity Price : 25.00
    Evaluated at bid price : 25.23
    Bid-YTW : 3.18 %
    BNS.PR.Y FixedReset 80,175 RBC bought 11,000 from anonymous at 25.25 and the same number from National at the same price. It then bought another 10,000 from National at the same price again.
    YTW SCENARIO
    Maturity Type : Limit Maturity
    Maturity Date : 2040-09-08
    Maturity Price : 25.10
    Evaluated at bid price : 25.15
    Bid-YTW : 3.27 %
    MFC.PR.D FixedReset 69,611 RBC crossed 48,900 at 26.75.
    YTW SCENARIO
    Maturity Type : Call
    Maturity Date : 2014-07-19
    Maturity Price : 25.00
    Evaluated at bid price : 26.73
    Bid-YTW : 4.61 %
    BAM.PR.K Floater 64,000 Nesbitt crossed 60,400 at 15.00.
    YTW SCENARIO
    Maturity Type : Limit Maturity
    Maturity Date : 2040-09-08
    Maturity Price : 15.01
    Evaluated at bid price : 15.01
    Bid-YTW : 3.24 %
    There were 30 other index-included issues trading in excess of 10,000 shares.

    CIU Becomes Pure Regulated Utility

    Wednesday, September 8th, 2010

    Canadian Utilities (CU) and Canadian Utilities Inc. (CIU) have announced:

    that their Boards of Directors have approved the transfer of Alberta Power (2000) Ltd. from CU Inc. to ATCO Power Ltd., a wholly-owned subsidiary of Canadian Utilities Limited.

    Alberta Power (2000) Ltd. owns the 670 MW Battle River Generating Station and has a 50 per cent stake in the 760 MW Sheerness Generating Station. The transfer allows Canadian Utilities Limited to align its ownership of its power generation assets under ATCO Power Ltd. and its rate regulated utility assets under CU Inc. ATCO Electric, ATCO Gas and ATCO Pipelines will continue to be owned and financed by CU Inc.

    CU Inc., a wholly owned subsidiary of Canadian Utilities Limited, is an Alberta-based corporation with assets of approximately $6.7 billion and more than 4,100 employees. As a result of this transfer, CU Inc. will be comprised of rate regulated utility operations in pipelines, natural gas and electricity transmission and distribution.

    DBRS has announced that it:

    today confirmed the ratings of CU Inc. (CUI) as follows: Unsecured Debentures & Medium-Term Notes at A (high), Commercial Paper at R-1 (low) and Cumulative Preferred Shares at Pfd-2 (high), all with Stable trends.

    DBRS expects the transfer to result in a modest reduction in CUI’s level of business risk as a result of exiting the power generation business.

    DBRS also views the transfer as resulting in a modest increase in CUI’s level of financial risk. With the loss of APL2000’s EBITDA contribution, DBRS would expect the transfer to result in a modest weakening of CUI’s adjusted credit coverage metrics (i.e., on a pro forma basis for 2009, EBITDA-to-interest would be approximately 0.3 times lower).

    Overall, the increase in financial risk is offset by the reduction in business risk, and as such, there is no impact on CUI’s ratings.

    CIU has two issues of preferreds outstanding: CIU.PR.A (a PerpetualDiscount) and CIU.PR.B (a FixedReset). Both are tracked by HIMIPref™.

    BoC Increases O/N Rate 25bp to 1.00%; Prime Follows

    Wednesday, September 8th, 2010

    The Bank of Canada has announced:

    that it is raising its target for the overnight rate by one-quarter of one percentage point to 1 per cent. The Bank Rate is correspondingly 1 1/4 per cent and the deposit rate is 3/4 per cent.

    The Bank now expects the economic recovery in Canada to be slightly more gradual than it had projected in its July Monetary Policy Report (MPR), largely reflecting a weaker profile for U.S. activity. Inflation in Canada has been broadly in line with the Bank’s expectations and its dynamics are essentially unchanged.

    Against this backdrop, the Bank decided to increase its target for the overnight rate to 1 per cent. As a result of monetary policy measures taken since April, financial conditions in Canada have tightened modestly but remain exceptionally stimulative. This is consistent with achieving the 2 per cent inflation target in an environment of significant excess supply in Canada.

    Any further reduction in monetary policy stimulus would need to be carefully considered in light of the unusual uncertainty surrounding the outlook.

    Bloomberg comments:

    The increase was the bank’s third since June, and most economists, including Durocher, now forecast Governor Mark Carney will keep the rate at 1 percent until April.

    Prime followed:

    September 7, 2010

    Tuesday, September 7th, 2010

    The US government is creaking slowly towards GSE reform:

    A Dodd-Frank mandated Treasury study on Fannie Mae and Freddie Mac is almost certain to be the first step in federal legislation to reform government-sponsored enterprises and the secondary mortgage market. The study, which must be submitted to Congress by the end of January 2011, was mandated by an amendment offered by Senator Chris Dodd, Chair of the Banking Committee, codified as section 1074, as the Senate was beating back an amendment offered by Senator John McCain that would have either ended the conservatorship of Fannie and Freddie or disbanded them with no reasonable alternative offered.

    All that being said, there is a growing consensus that the 112th Congress must pass legislation reforming the GSEs.

    Mary Schapiro spoke about market structure today:

    May 6 was clearly a market failure, and it brought to the fore concerns about our equity market structure. The staffs of the SEC and CFTC are finalizing a joint report on our inquiry into the day’s events that will be published in the coming weeks.

    But we have not waited for the report to begin taking steps to address weaknesses identified on May 6.

    There will doubtless be some who consider this admirable.

    To understand where individual investors are coming from, we must truly recognize the impact of severe price volatility on their interests: one example is the use and impact of stop loss orders on May 6. Stop loss orders are designed to help limit losses by selling a stock when it drops below a specified price, and are a safety tool used by many individual investors to limit losses.

    The fundamental premise of these orders is to rely on the integrity of market prices to signal when the investor should sell a holding. On May 6, this reliance proved misplaced and the use of this tool backfired.

    A staggering total of more than $2 billion in individual investor stop loss orders is estimated to have been triggered during the half hour between 2:30 and 3 p.m. on May 6. As a hypothetical illustration, if each of those orders were executed at a very conservative estimate of 10 percent less than the closing price, then those individual investors suffered losses of more than $200 million compared to the closing price on that day.

    This is the first time I’ve seen a number. OK, so users of stop loss orders lost a lot of money, which is now in the hands of less stupid people better able to allocate capital. So what? Isn’t this what markets are supposed to do?

    We should consider the relevance today of a basic premise of the old specialist obligations — that the professional trading firms with the best access to the markets (and therefore the greatest capacity to affect trading for good or for ill) should be subject to obligations to trade in ways that support the stability and fairness of the markets.

    For example, the stocks with broken trades on May 6 highlight the fact that the order book liquidity in those stocks completely disappeared, if only briefly, and caused trades to occur at absurd prices. Where were the high frequency trading firms that typically dominate liquidity provision in those stocks?

    I anticipate that the May 6 report will discuss the reasons that caused these firms to pull back, which they believed to be in their interest. The issue, however, is whether the firms that effectively act as market makers during normal times should have any obligation to support the market in reasonable ways in tough times.

    This is craziness. In the first place, specialists and market-makers have a lot more advantages than mere “access”. In the second place, it will be remembered that these paragons of virtue stepped back during the crash of 1987, as well.

    It looks like the established order of do-nothing incompetents has renewed its hegemony over the SEC!

    Reverberations over Greek debt continue:

    Four months after the 110 billion- euro ($140 billion) bailout for Greece, the nation still hasn’t disclosed the full details of secret financial transactions it used to conceal debt.

    “We have not seen the real documents,” Walter Radermacher, head of the European Union’s statistics agency Eurostat, said in a Sept. 2 interview in his Luxembourg office. Eurostat first requested the contracts in February.

    Radermacher vows new toughness when officials from his staff head to Greece this month to come up with a “solid estimate” of the total value of debt hidden by the opaque contracts. “This is a new era,” he said.

    Greece is the only euro country that lied about using these complex swap contracts after Eurostat told countries to report them in 2008, Radermacher, 58, said.

    “You might say this is triumph of hope over experience,” [Yannis Stournaras, director general of the Foundation for Economic and Industrial Research in Athens] said, adding that the blame should be shared with the European Commission, which didn’t intervene despite years of warnings by Eurostat of problems with Greek data.

    “We addressed the issue several times in meetings of finance ministers and we asked for enhanced powers for Eurostat in 2005, which we didn’t receive at the time,” said Amadeu Altafaj, a spokesman for the Commission.

    In April 2009, the European Central Bank identified a Greek swap operation of unusual terms, according to a confidential ECB document dated March 3, 2010, obtained by Bloomberg News. The ECB said its executive board prepared internal reports on the swaps. ECB spokesman Niels Buenemann declined to comment on it.

    Greece began using this type of contract for the 2001 budget year to avoid recording a spike in debt the first year after it adopted the euro, Stournaras said. It continued to use them after 2001 and increased their use after 2004, he said.

    Under guidance set out in 2008 by Eurostat, any upfront payments linked to a swap must be counted as a loan.

    Germany, Italy, Poland and Belgium, like Greece, received upfront payments from derivatives, Radermacher said at a hearing at the European Parliament in April. The difference, he said in the September interview, was that when Eurostat asked the other countries about the contracts in 2008, they provided the data and adjusted their debt figures.

    See? As I said at the time, this was a case of willful blindness by European bureaucrats and politicians, for which they frantically tried to blame Goldman Sachs when the shit finally hit the fan.

    On September 2 I indulged myself with a rant on the Lori Douglas case and found it remarkable that tenure-track law professors couldn’t mount an actual argument. An ink-stained wretch, Judith Timson, managed it in the Globe on Friday, arguing (arguing!) in a column titled The net killed sexual privacy that Douglas showed poor judgment in allowing the photos to be taken and that this poor judgment disqualifies her from the judiciary.

    Well, it’s a murky area and it’s very easy to add increments to the situation until most people will agree that the conduct is inappropriate, with nobody agreeing on which increment tipped the scale. But to stick with the situation as it is, I have to disagree and I’m going to disagree on the grounds that “judgment” is too broad a term – even if I allow for the sake of an argument that her judgment was poor in that instance and I’m not convinced it was.

    Judgment is not fungible. There are lots of people whose judgment I would trust absolutely on some matters, but not on others. I see fixed income portfolios from lots of people that simply don’t make any sense at all – and it doesn’t affect my respect for their knowledge within their field of specialization. If Ms. Douglas showed “poor judgment” in the matter of her sexual relationship with her spouse (and I’m not saying she did), I don’t believe you can draw any conclusions about her judgment on the bench.

    BUt OK. For the sake of an argument, let’s concede not just the first point – that allowing risque pictures to be take shows poor judgment – but the second one as well – that this poor judgment will be reflected in the judge’s judicial skills. I’m still not convinced that the Ms. Douglas deserves to lose her job, because I’m not sure whether there’s a net benefit to this.

    If we insist on asking about the bare existence of naughty pictures as part of a prospective judge’s background check, we’re going to get lied to. A lot. Some people will honestly forget, some will figure it’s so long ago it doesn’t matter, some will figure it’s none of our business and some honestly won’t know. In such a case, what we are doing is increasing the chance for blackmail: if the pictures come to light, the judge will lose his job. I am by no means convinced that the change in standards is a net benefit.

    Additionally, by loading down the process with many specific rules, we’re in danger of establishing “Gotcha Regulation”, the same that exists in the securities business. Do the bosses want to get rid of somebody? Put enough people on the case and it’s easy enough to find some rule that was broken.

    Still: well done Ms. Timson for providing an actual argument! I wonder if she’s considered applying to law school? Not as a student; I mean, for a tenured position, job for life. status, pay, benefits … she could do a lot worse, and can obviously apply logic better than many of the incumbents.

    Why am I spending time on this issue? Why is it is important? Because bureaucrats have contempt for the judicial process:

    Wendy Vanstralen, 47, has been charged under the province’s stunt driving legislation.

    Her truck has been impounded for a week, and she has also lost her licence for seven days.

    Ms. Vanstralen is due in court Nov. 2.

    … and that’s a scary thing. Especially when bank regulation is heading the same way.

    It was quite a good day on the Canadian preferred share market; volume was good, with PerpetualDiscounts gaining 16bp and FixedResets gaining 13bp … taking the YTW on the latter index down to 3.08%. Next stop: three percent! MFC continued to be highlighted on the volume table.

    HIMIPref™ Preferred Indices
    These values reflect the December 2008 revision of the HIMIPref™ Indices

    Values are provisional and are finalized monthly
    Index Mean
    Current
    Yield
    (at bid)
    Median
    YTW
    Median
    Average
    Trading
    Value
    Median
    Mod Dur
    (YTW)
    Issues Day’s Perf. Index Value
    Ratchet 0.00 % 0.00 % 0 0.00 0 0.0756 % 2,036.5
    FixedFloater 0.00 % 0.00 % 0 0.00 0 0.0756 % 3,085.0
    Floater 2.73 % 3.24 % 56,932 19.05 3 0.0756 % 2,198.9
    OpRet 4.88 % 2.93 % 95,608 0.23 9 0.0601 % 2,359.2
    SplitShare 5.97 % -37.64 % 65,698 0.09 2 0.3099 % 2,357.3
    Interest-Bearing 0.00 % 0.00 % 0 0.00 0 0.0601 % 2,157.2
    Perpetual-Premium 5.74 % 5.55 % 123,348 5.38 14 0.1044 % 1,971.4
    Perpetual-Discount 5.68 % 5.75 % 189,036 14.21 63 0.1625 % 1,914.9
    FixedReset 5.26 % 3.08 % 271,205 3.33 47 0.1299 % 2,259.6
    Performance Highlights
    Issue Index Change Notes
    SLF.PR.E Perpetual-Discount 1.27 % YTW SCENARIO
    Maturity Type : Limit Maturity
    Maturity Date : 2040-09-07
    Maturity Price : 19.16
    Evaluated at bid price : 19.16
    Bid-YTW : 5.89 %
    GWO.PR.J FixedReset 1.48 % YTW SCENARIO
    Maturity Type : Call
    Maturity Date : 2014-01-30
    Maturity Price : 25.00
    Evaluated at bid price : 27.40
    Bid-YTW : 2.92 %
    Volume Highlights
    Issue Index Shares
    Traded
    Notes
    MFC.PR.A OpRet 248,948 Nesbitt crossed two blocks of 100,000 each, both at 25.00. Nesbitt bought 14,200 from anonymous at 25.00; Desjardins crossed 17,800 at the same price.
    YTW SCENARIO
    Maturity Type : Soft Maturity
    Maturity Date : 2015-12-18
    Maturity Price : 25.00
    Evaluated at bid price : 24.98
    Bid-YTW : 4.11 %
    MFC.PR.C Perpetual-Discount 70,512 TD crossed 30,900 at 18.34.
    YTW SCENARIO
    Maturity Type : Limit Maturity
    Maturity Date : 2040-09-07
    Maturity Price : 18.33
    Evaluated at bid price : 18.33
    Bid-YTW : 6.17 %
    BNS.PR.Q FixedReset 58,400 Desjardins crossed 15,900 at 26.60; TD crossed 15,200 at the same price.
    YTW SCENARIO
    Maturity Type : Call
    Maturity Date : 2013-11-24
    Maturity Price : 25.00
    Evaluated at bid price : 26.62
    Bid-YTW : 2.98 %
    RY.PR.X FixedReset 57,500 RBC crossed 55,000 at 28.05.
    YTW SCENARIO
    Maturity Type : Call
    Maturity Date : 2014-09-23
    Maturity Price : 25.00
    Evaluated at bid price : 28.00
    Bid-YTW : 3.17 %
    GWO.PR.J FixedReset 57,210 RBC crossed 53,900 at 27.35.
    YTW SCENARIO
    Maturity Type : Call
    Maturity Date : 2014-01-30
    Maturity Price : 25.00
    Evaluated at bid price : 27.40
    Bid-YTW : 2.92 %
    CIU.PR.B FixedReset 56,675 RBC crossed blocks of 35,300 and 20,700, both at 28.25.
    YTW SCENARIO
    Maturity Type : Call
    Maturity Date : 2014-07-01
    Maturity Price : 25.00
    Evaluated at bid price : 28.16
    Bid-YTW : 3.22 %
    There were 36 other index-included issues trading in excess of 10,000 shares.

    MAPF Performance: August 2010

    Sunday, September 5th, 2010

    The fund had a good month in August, outperforming its benchmark and the passive funds despite being hurt by holdings in MFC.

    The fund’s Net Asset Value per Unit as of the close August 31 was $11.0637.

    Returns to August 31, 2010
    Period MAPF Index CPD
    according to
    Claymore
    One Month +1.66% +1.31% +1.12%
    Three Months +10.34% +6.17% +5.35%
    One Year +9.49% +6.26% +5.08%
    Two Years (annualized) +31.76% +7.35% +5.48% *
    Three Years (annualized) +19.66% +2.90% +1.20%
    Four Years (annualized) +15.36% +2.26%  
    Five Years (annualized) +13.41% +2.54%  
    Six Years (annualized) +12.23% +2.94%  
    Seven Years (annualized) +13.04% +3.36%  
    Eight Years (annualized) +13.70% +3.74%  
    Nine Years (annualized) +12.95% +3.68%  
    The Index is the BMO-CM “50”
    MAPF returns assume reinvestment of dividends, and are shown after expenses but before fees.
    CPD Returns are for the NAV and are after all fees and expenses.
    * CPD does not directly report its two-year returns. The figure shown is the square root of product of the current one-year return and the similar figure reported for August 2009.
    Figures for Omega Preferred Equity (which are after all fees and expenses) for 1-, 3- and 12-months are +1.39%, +6.23% and +6.42%, respectively, according to Morningstar after all fees & expenses
    Figures for Jov Leon Frazer Preferred Equity Fund Class I Units (which are after all fees and expenses) for 1-, 3- and 12-months are +1.14%, +5.56% & +3.61% respectively, according to Morningstar
    Figures for AIC Preferred Income Fund (which are after all fees and expenses) for 1-, 3- and 12-months are +0.74%, +5.21% & +3.65%, respectively

    MAPF returns assume reinvestment of dividends, and are shown after expenses but before fees. Past performance is not a guarantee of future performance. You can lose money investing in Malachite Aggressive Preferred Fund or any other fund. For more information, see the fund’s main page. The fund is available either directly from Hymas Investment Management or through a brokerage account at Odlum Brown Limited.

    My personal benchmark for a “good year” is index+500bp before fees; a glance at the annualized performance to June, 2010 shows that I’ve been able to meet that goal five times out of nine attempts.

    Sometimes everything works … sometimes the trading works, but sectoral shifts overwhelm the increment … sometimes nothing works. The fund seeks to earn incremental return by selling liquidity (that is, taking the other side of trades that other market participants are strongly motivated to execute), which can also be referred to as ‘trading noise’. There have been a lot of strongly motivated market participants in the past year, generating a lot of noise! The conditions of the past two years may never be repeated in my lifetime … but the fund will simply attempt to make trades when swaps seem profitable, whether that implies monthly turnover of 10% or 100%.

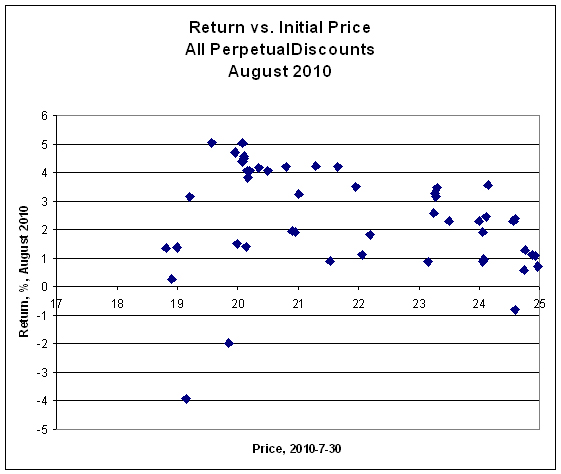
    As mentioned, the fund was hurt by a significant position in MFC shares, but this was more than offset by an overweight position in PerpetualDiscounts and, more particularly, more deeply discounted PerpetualDiscounts. If we look at returns for the month in the sector, plotted against their 2010-7-30 bid price, we get, essentially, a mess:


    Click for Big

    The slope of the regression line is -0.23%/dollar, but the adjusted R-Square is only 6.2%.

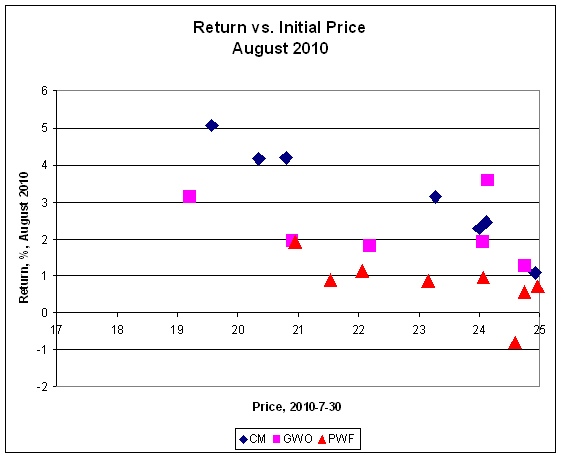
    … but when we disaggregate the date, we see things of greater interest:


    Click for big

    The regression on CM has adjusted R-Square = 92%, slope = -0.62%/$; GWO -14.4% and -0.12%/$; PWF 46% and -0.32%/$.

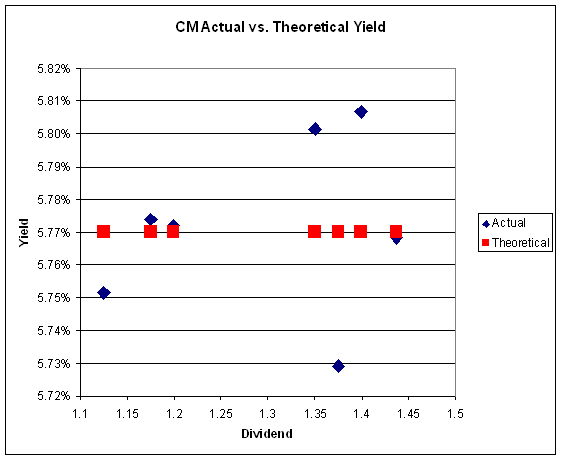
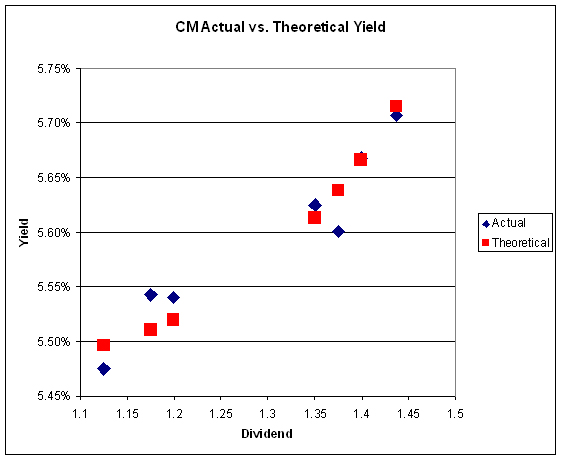
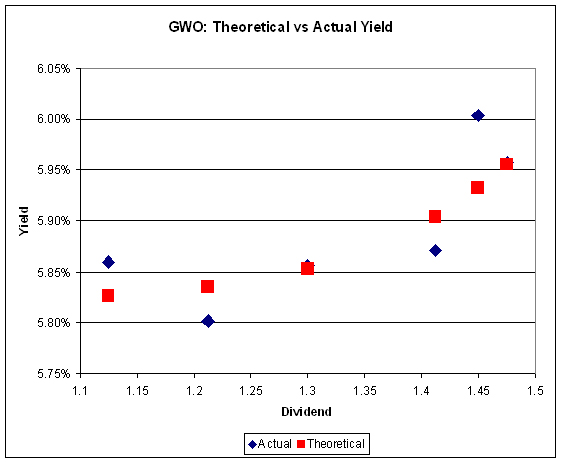
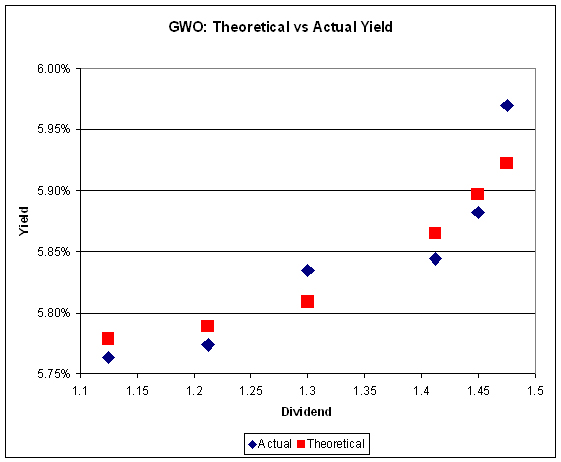
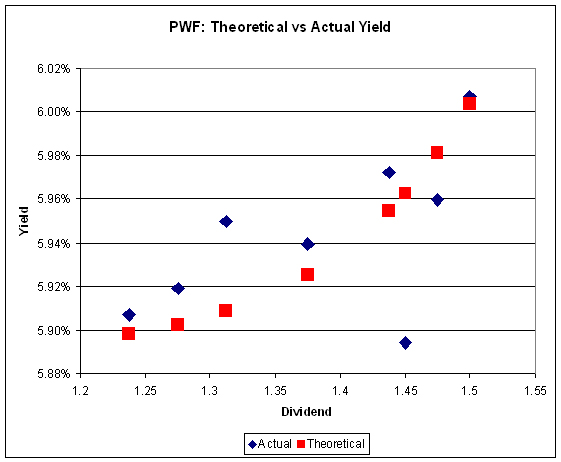
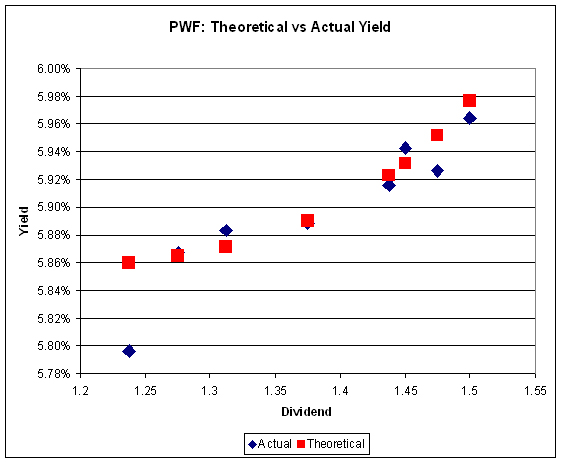
    Further analysis of the data using the Straight Perpetual Implied Volatility Calculator produces the following table:

    Fits to Implied Volatility
    Issuer 2010-08-31 2010-07-30
    Yield Volatility Yield Volatility
    PWF 5.85% 9% 5.89% 9%
    CM 5.46% 11% 5.77% 0.01%
    GWO 5.77% 10% 5.82% 10%
    CM 2010-07-30

    Click for Big

    CM 2010-08-31

    Click for Big

    GWO 2010-07-30

    Click for Big

    GWO 2010-08-31

    Click for Big

    PWF 2010-07-30

    Click for Big

    PWF 2010-08-31

    Click for Big

    There’s plenty of room for new money left in the fund. I have shown in recent issues of PrefLetter that market pricing for FixedResets is demonstrably stupid and I have lots of confidence – backed up by my bond portfolio management experience in the markets for Canadas and Treasuries, and equity trading on the TSX – that there is enough demand for liquidity in any market to make the effort of providing it worthwhile (although the definition of “worthwhile” in terms of basis points of outperformance changes considerably from market to market!) I will continue to exert utmost efforts to outperform but it should be borne in mind that there will almost inevitably be periods of underperformance in the future.

    The yields available on high quality preferred shares remain elevated, which is reflected in the current estimate of sustainable income.

    Calculation of MAPF Sustainable Income Per Unit
    Month NAVPU Portfolio
    Average
    YTW
    Leverage
    Divisor
    Securities
    Average
    YTW
    Capital
    Gains
    Multiplier
    Sustainable
    Income
    per
    current
    Unit
    June, 2007 9.3114 5.16% 1.03 5.01% 1.1883 0.3926
    September 9.1489 5.35% 0.98 5.46% 1.1883 0.4203
    December, 2007 9.0070 5.53% 0.942 5.87% 1.1883 0.4448
    March, 2008 8.8512 6.17% 1.047 5.89% 1.1883 0.4389
    June 8.3419 6.034% 0.952 6.338% 1.1883 $0.4449
    September 8.1886 7.108% 0.969 7.335% 1.1883 $0.5054
    December, 2008 8.0464 9.24% 1.008 9.166% 1.1883 $0.6206
    March 2009 $8.8317 8.60% 0.995 8.802% 1.1883 $0.6423
    June 10.9846 7.05% 0.999 7.057% 1.1883 $0.6524
    September 12.3462 6.03% 0.998 6.042% 1.1883 $0.6278
    December 2009 10.5662 5.74% 0.981 5.851% 1.0000 $0.6182
    March 2010 10.2497 6.03% 0.992 6.079% 1.0000 $0.6231
    June 10.5770 5.96% 0.996 5.984% 1.0000 $0.6329
    August 2010 11.0637 5.81% 1.002 5.798% 1.0000 $0.6415
    NAVPU is shown after quarterly distributions of dividend income and annual distribution of capital gains.
    Portfolio YTW includes cash (or margin borrowing), with an assumed interest rate of 0.00%
    The Leverage Divisor indicates the level of cash in the account: if the portfolio is 1% in cash, the Leverage Divisor will be 0.99
    Securities YTW divides “Portfolio YTW” by the “Leverage Divisor” to show the average YTW on the securities held; this assumes that the cash is invested in (or raised from) all securities held, in proportion to their holdings.
    The Capital Gains Multiplier adjusts for the effects of Capital Gains Dividends. On 2009-12-31, there was a capital gains distribution of $1.989262 which is assumed for this purpose to have been reinvested at the final price of $10.5662. Thus, a holder of one unit pre-distribution would have held 1.1883 units post-distribution; the CG Multiplier reflects this to make the time-series comparable. Note that Dividend Distributions are not assumed to be reinvested.
    Sustainable Income is the resultant estimate of the fund’s dividend income per current unit, before fees and expenses. Note that a “current unit” includes reinvestment of prior capital gains; a unitholder would have had the calculated sustainable income with only, say, 0.9 units in the past which, with reinvestment of capital gains, would become 1.0 current units.

    Significant positions were held in Fixed-Reset issues on June 30; all of which (with the exception of YPG.PR.C) currently have their yields calculated with the presumption that they will be called by the issuers at par at the first possible opportunity. This presents another complication in the calculation of sustainable yield.

    However, if the entire portfolio except for the PerpetualDiscounts were to be sold and reinvested in these issues, the yield of the portfolio would be the 5.88% shown in the MAPF Portfolio Composition: August 2010 analysis (which is in excess of the 5.69% index yield on August 31). Given such reinvestment, the sustainable yield would be $11.0637 * 0.0588 = 0.6505, down from the 0.6545 reported in May 2010 (the best comparator due to the influence of dividends earned but not yet distributed).

    It is no surprise that this estimate is down, since there will be a drag on the calculation in up-markets due to presence of shorter-term issues (or, at least, presumed shorter term issues!); the question is whether the positive effect of these issues in down markets will outweight their negative effect in up-markets – all I can say is … it has in the past!

    Different assumptions lead to different results from the calculation, but the overall positive trend is apparent. I’m very pleased with the results! It will be noted that if there was no trading in the portfolio, one would expect the sustainable yield to be constant (before fees and expenses). The success of the fund’s trading is showing up in

    • the very good performance against the index
    • the long term increases in sustainable income per unit

    As has been noted, the fund has maintained a credit quality equal to or better than the index; outperformance is due to constant exploitation of trading anomalies.

    Again, there are no predictions for the future! The fund will continue to trade between issues in an attempt to exploit market gaps in liquidity, in an effort to outperform the index and keep the sustainable income per unit – however calculated! – growing.

    MAPF Portfolio Composition: August 2010

    Sunday, September 5th, 2010

    Turnover declined in August to an anemic 13%.

    Trades were, as ever, triggered by a desire to exploit transient mispricing in the preferred share market (which may be thought of as “selling liquidity”), rather than any particular view being taken on market direction, sectoral performance or credit anticipation.

    MAPF Sectoral Analysis 2010-8-31
    HIMI Indices Sector Weighting YTW ModDur
    Ratchet 0% N/A N/A
    FixFloat 0% N/A N/A
    Floater 0% N/A N/A
    OpRet 0% N/A N/A
    SplitShare 0.6% (-2.3) 6.99% 6.79
    Interest Rearing 0% N/A N/A
    PerpetualPremium 0.0% (0) N/A N/A
    PerpetualDiscount 86.7% (+4.1) 5.88% 14.10
    Fixed-Reset 8.9% (-1.2) 4.11% 3.43
    Scraps (FixedReset) 4.0% (-0.2) 6.77% 12.59
    Cash -0.2% (-0.4) 0.00% 0.00
    Total 100% 5.77% 13.08
    Totals and changes will not add precisely due to rounding. Bracketted figures represent change from July month-end. Cash is included in totals with duration and yield both equal to zero.

    The “total” reflects the un-leveraged total portfolio (i.e., cash is included in the portfolio calculations and is deemed to have a duration and yield of 0.00.). MAPF will often have relatively large cash balances, both credit and debit, to facilitate trading. Figures presented in the table have been rounded to the indicated precision.

    During the month, almost the entire remaining position of BNA.PR.C, a split share based on BAM.A, was swapped into BAM.PR.N, a PerpetualDiscount.

    Credit distribution is:

    MAPF Credit Analysis 2010-8-31
    DBRS Rating Weighting
    Pfd-1 0 (0)
    Pfd-1(low) 62.0% (-10.6)
    Pfd-2(high) 19.4% (+11.2)
    Pfd-2 0 (0)
    Pfd-2(low) 14.8% (-0.1)
    Pfd-3(high) 4.0% (-0.2)
    Cash -0.2% (-0.4)
    Totals will not add precisely due to rounding. Bracketted figures represent change from June month-end.

    The shift of about 11% (net) of the portfolio from Pfd-1(low) to Pfd-2(high) was set in motion by the downgrade of MFC early in the month. As at 2010-7-30, the fund held 16.2% of its portfolio in MFC issues; this figure was 14.7% at month end. The decline was due to both the poor performance of MFC issues in August, and to the fact that these shares went ex-dividend on August 13. A net reduction of less than 0.2% in portfolio weight resulted from a net disposition of MFC shares that occurred when a swap from MFC.PR.C to MFC.PR.B could not be executed in its entirety.

    Liquidity Distribution is:

    MAPF Liquidity Analysis 2010-8-31
    Average Daily Trading Weighting
    <$50,000 0.0% (0)
    $50,000 – $100,000 11.9% (+9.1)
    $100,000 – $200,000 25.5% (-12.0)
    $200,000 – $300,000 31.1% (+2.7)
    >$300,000 31.7% (+0.6)
    Cash -0.2% (-0.4)
    Totals will not add precisely due to rounding. Bracketted figures represent change from July month-end.

    The increase in holdings of issues with an average daily trading value of less than $100,000 (as defined by HIMIPref™) was due not to trades but to changes in the market: the fund maintains positions in W.PR.J and PWF.PR.L, both of which saw this metric decline from just over the line to just under during August.

    MAPF is, of course, Malachite Aggressive Preferred Fund, a “unit trust” managed by Hymas Investment Management Inc. Further information and links to performance, audited financials and subscription information are available the fund’s web page. The fund may be purchased either directly from Hymas Investment Management or through a brokerage account at Odlum Brown Limited. A “unit trust” is like a regular mutual fund, but is sold by offering memorandum rather than prospectus. This is cheaper, but means subscription is restricted to “accredited investors” (as defined by the Ontario Securities Commission) and those who subscribe for $150,000+. Fund past performances are not a guarantee of future performance. You can lose money investing in MAPF or any other fund.

    A similar portfolio composition analysis has been performed on the Claymore Preferred Share ETF (symbol CPD) as of August 17, 2009, and published in the September, 2009, PrefLetter. When comparing CPD and MAPF:

    • MAPF credit quality is better
    • MAPF liquidity is a higher
    • MAPF Yield is higher
    • Weightings in
      • MAPF is much more exposed to PerpetualDiscounts
      • MAPF is much less exposed to Operating Retractibles
      • MAPF is now about equally exposed to SplitShares
      • MAPF is less exposed to FixFloat / Floater / Ratchet
      • MAPF weighting in FixedResets is much lower

    BIS Releases Quarterly Review, September 2010

    Sunday, September 5th, 2010

    The Bank for International Settlements has released its BIS Quarterly Review, September 2010 with sections on:

    • Overview: growth concerns take centre stage
    • Highlights of international banking and financial market activity
    • Debt reduction after crises
    • The collapse of international bank finance during the crisis: evidence from syndicated loan markets
    • Options for meeting the demand for international liquidity during financial crises
    • Bank structure, funding risk and the transmission of shocks across countries: concepts and measurement

    They note:

    Increasing growth concerns led investors to remain cautious. Nevertheless, prices rose in both equity and corporate bond markets in response to the improved conditions in euro sovereign debt markets, positive US and European corporate earnings announcements and greater clarity on the regulatory agenda (Graph 5, left-hand panel). Equity volatility also declined (Graph 5, centre panel). Given the significant drops earlier in the year, however, North American and European equity markets remained flat or below their levels at the beginning of the year. In contrast, there were gains for some Latin American markets and large losses for Chinese, Japanese and Australian markets.

    Despite unchanged credit spreads (Graph 5, right-hand panel), both investment grade and high-yield corporate bonds generated large returns due to falling risk-free rates (Graph 6, left-hand panel). The superior performance of bond markets relative to equity markets was mirrored in global investment flows. In the United States, large outflows from equity mutual funds from May to July were offset by large inflows to bond mutual funds (Graph 6, centre panel). These inflows picked up again during July.

    And here’s an interesting tid-bit:

    One of the few developed economies (in addition to Greece) that bucked the trend of lower net issuance was Canada. Canadian residents raised $30 billion on the international debt market, about three times as much as in the previous quarter and the highest since the second quarter of 2008. Canadian financial institutions issued approximately $19 billion. Canadian provincial governments, led by Ontario, also borrowed sizeable amounts ($9 billion), whereas non-financial corporations issued $2 billion, slightly less than in the previous quarter.

    The paper on syndicated loans shows some trends that I consider rather alarming:

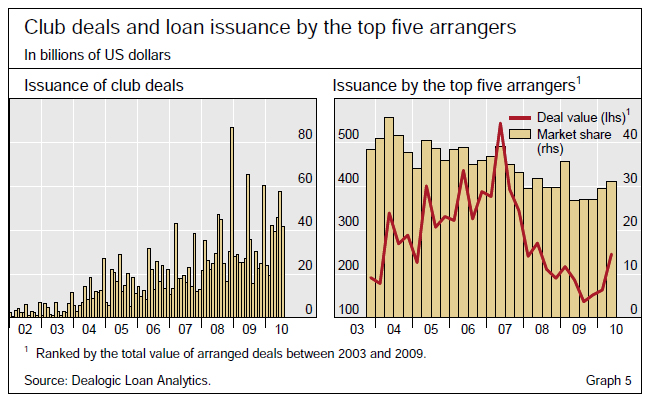
    Changes in syndication arrangements may be indicative of credit supply constraints. For instance, syndicated loan transactions in the form of “club deals” gained importance, increasing from 12% of total issuance in 2008 to 17% in 2009 (Graph 5, left-hand panel). A club deal is a loan syndicated by a small number of participating banks, which are not entitled to transfer their portion of the loan to a third party (White & Case (2003)). Such smaller syndicates result in lower restructuring and monitoring costs, and are thus preferred by lead arrangers when default is more likely. From this perspective, greater use of club deals might be an indication of both growing bank risk aversion and higher credit risk at a time of greatly increased economic uncertainty. This is consistent with Esty and Megginson (2003), who find that syndicate size is positively related to the strength of creditor rights and the reliability of legal enforcement.


    Click for big

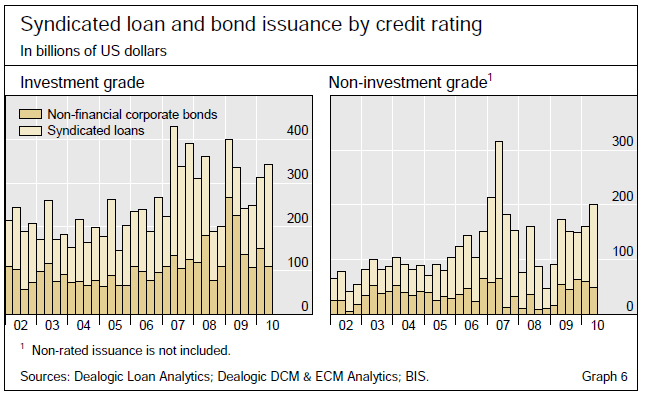
    Click for big

    The concept of private placements, with issues being continually forced from the public into more private structures, increases the opacity of the securities market. Many issues are forced there as a result of prospectus and reporting requirements for the public markets; I don’t think anybody’s ever done a cost/benefit analysis for the addition of further pages to prospectuses or for things like Sarbox and TRACE: it sounds good at the time, so it just happens.

    The authors conclude, in part:

    The results raise at least two issues. The first concerns the extent to which constraints in syndicated loan supply can be expected to ease in the near term. dysfunctional securitisation markets might constrain the ability of banks to place syndicated loans in the secondary market for a while. Moreover, repairing bank balance sheets takes time. But the sensitivity of syndicated loan supply to changes in bank CDS spreads may suggest that measures that alleviate concerns about banks’ soundness and ease bank funding pressures could have significant positive effects on credit supply even in the near term.

    Second, recent developments in syndicated loan markets might be indicative of structural changes in credit markets. The gradual return to more normal functioning of the corporate bond markets could have eased funding constraints for banks and corporations. In particular, those with an investment grade rating might be more reliant on market finance in the future. Moreover, looking forward, emerging market banks may play a much bigger role in syndicated loan markets, and in international banking more generally, than in the past. The syndicated loan market with its role in financing trade and mergers and acquisitions might be one key area of expansion for these banks.

    OK, so my question is: to what extent could making life easier for public issuers reduce the dependence of credit supply to non-financial firms on the (perceived) credit quality of the banks?