Archive for November, 2011

SLF.PR.I Closes at Discount on Moderate Volume

Friday, November 11th, 2011

Sun Life Financial has announced:

the successful completion of a Canadian public offering of $300 million of Class A Non-Cumulative Rate Reset Preferred Shares Series 12R (the “Series 12R Shares”) at a price of $25.00 per share and yielding 4.25 per cent annually. The offering, initially for $250 million of Series 12R Shares, was increased to $300 million following exercise by the underwriting syndicate, co-led by Scotia Capital Inc., CIBC and TD Securities Inc., of an option to purchase an additional $50 million of Series 12R Shares.

The Series 12R Shares were issued under a prospectus supplement dated November 3, 2011, which was issued pursuant to a short form base shelf prospectus dated April 12, 2011. Copies of those documents are available on the SEDAR website for Sun Life Financial Inc. at www.sedar.com. The Series 12R Shares are listed on the Toronto Stock Exchange under the ticker symbol SLF.PR.I.

SLF.PR.I is a FixedReset, 4.25%+273, announced November 3.

The issue traded 398,680 shares today in a range of 24.60-90 before closing at 24.55-60, 10×4. The issue will be tracked by HIMIPref™ and has been assigned to the FixedReset index. In accordance with my views on DeemedRetractibles, a hardMaturity entry has been added to the call schedule, on the assumption that regulatory changes applied to banks with respect to Tier 1 Capital will be extended to apply to insurers and insurance holding companies.

Vital statistics are:

SLF.PR.I FixedReset YTW SCENARIO
Maturity Type : Hard Maturity
Maturity Date : 2022-12-31
Maturity Price : 25.00
Evaluated at bid price : 24.55
Bid-YTW : 4.41 %

Are Preferred Shares A Good Buy?

Friday, November 11th, 2011

David Aston was kind enough to quote me in his Moneysense piece Are preferred shares a good buy?:

Third, before taxes, the yields on preferred shares tend to be pretty similar to those of long-term bonds for the same company, says preferred shares expert James Hymas, president of Hymas Investment Management in Toronto. Even though they’re not as reliable as the company’s bonds, they give you about the same before-tax yield. So if you’re investing inside a TFSA or RRSP where taxes don’t matter, go with the bonds.

Fourth—and this is their key advantage—the dividends on Canadian preferred shares get the same highly advantageous tax treatment as dividends on Canadian common shares. So they generally beat bonds hands-down when held in non-registered accounts, where taxes matter. In fact, as a rule of thumb, a bond has to generate about 1.3 times the before-tax yield in order to end up with the same after-tax income compared to a preferred share, says Hymas.

[This post was written 2012-2-6, but backdated to the Moneysense publication date, 2011-11-25)

RON.PR.A: DBRS Downgrades to Pfd-3(low)

Friday, November 11th, 2011

DBRS has announced that it:

has today downgraded the long-term rating of RONA inc. (Rona or the Company) to BBB (low) from BBB, maintaining the Negative trend. At the same time, DBRS has downgraded the Company’s Preferred Shares rating to Pfd-3 (low) from Pfd-3, also with a Negative trend.

On May 11, 2011, DBRS changed the trends on Rona’s ratings to Negative from Stable.

Subsequent to that statement, Rona released its Q2 2011 results, which delivered same-store sales growth of -9.6%, overall revenue decline of -2.4% and EBITDA of $90 million (versus $133 million year-over-year) as the Company continued to engage in heavy promotional activity to spur growth. Yesterday, Rona released its Q3 2011 results, which delivered same-store sales growth of -5.1%. Overall revenue increased by 2.1% (due to the inclusion of acquisitions and new store openings), resulting in EBITDA of $105.4 million, an increase of 1.7% year-over-year. As such, combined with a moderate increase in debt from the previous year, lease-adjusted debt-to-EBITDAR for the last twelve months ended Q3 2011 increased to 3.1x.

The deteriorating operating performance and weakened credit metrics result in a credit risk profile that is no longer consistent with a BBB rating. In terms of outlook, DBRS has maintained the Negative trend on the ratings as we believe meaningful recovery will remain challenging, since Rona is expected to continue facing intense competition in a highly promotional-based, consumer-challenged environment. The Company expects to generate some cost savings, which may help offset investment in pricing. Nevertheless, DBRS expects that any significant improvement in performance will be difficult to realize without same-store sales and margin stabilization over the near term.

If the Company’s plans and performance lead to signs of stabilization in same-store sales, operating income and key credit metrics (lease-adjusted debt-to-EBITDAR of approximately 3.0x) over the next year, the ratings outlook could stabilize. However, a continued and meaningful decline in same-store sales, operating income and key credit metrics over the course of 2012 could result in a downgrade to BB (high).

RON.PR.A was last discussed on PrefBlog in the post RON.PR.A: Ripe for Credit Downgrade?. RON.PR.A is tracked by HIMIPref™ but is relegated to the Scraps index on credit concerns.

November 9, 2011

Thursday, November 10th, 2011

Oh, those wacky Europeans and their Risk-Weighted Assets!

Banks in Europe are undercutting regulators’ demands that they boost capital by declaring assets they hold less risky today than they were yesterday.

Banco Santander SA (SAN), Spain’s largest lender, and Banco Bilbao Vizcaya Argentaria SA (BBVA), the second-biggest, say they can go halfway to adding 13.6 billion euros ($18.8 billion) of capital by changing how they calculate risk-weightings, the probability of default lenders assign to loans, mortgages and derivatives. The practice, known as “risk-weighted asset optimization,” allows banks to boost capital ratios without cutting lending, selling assets or tapping shareholders.

Spanish banks aren’t alone in using the practice. Unione di Banche Italiane SCPA (UBI), Italy’s fourth-biggest bank, said it will change its risk-weighting model instead of turning to investors for the 1.5 billion euros regulators say it needs. Commerzbank AG (CBK), Germany’s second-biggest lender, said it will do the same. Lloyds Banking Group Plc (LLOY), Britain’s biggest mortgage lender, and HSBC Holdings Plc (HSBA), Europe’s largest bank, both said they cut risk-weighted assets by changing the model.

The proportion of risk-weighted assets to total assets at European banks is half that of American banks, according to an April 6 Barclays Capital report written by analysts Simon Samuels and Mike Harrison.

Sheila Bair, who stepped down as chairman of the Federal Deposit Insurance Corp. in June, has called Europe’s adoption of risk-weighting “naive.”

Some regulators, including Bair, have pushed for a leverage ratio that would require lenders to hold a fixed amount of capital against total assets.

Banco Santander, based in Madrid, and BBVA in Bilbao said they’re justified in adjusting risk-weightings because Spanish regulators have held them to higher standards than elsewhere.

Spanish banks have an average ratio of risk-weighted assets to total assets of 52 percent compared with 32 percent for U.K. banks, 31 percent for French and Benelux banks and 35 percent for German banks, analysts at Keefe, Bruyette & Woods Inc., wrote in an Oct. 26 report.

DARPA’s looking for hackers:

At the conference, officials of the Defense Advanced Research Projects Agency pleaded with hackers to help them out and said that the agency plans to boost spending as it battles unnamed adversaries in cyberspace.

Regina Dugan, DARPA director, addressed an audience that comprised what the agency called “visionary hackers,” academics and others, according to a Reuters story.

Ms. Dugan contended that the military needs “more and better options” to meet cyber threats to a growing range of industrial and other systems controlled by computers vulnerable to penetration, including cars with advanced computer diagnostic boards. Of concern are brakes, accelerators, steering and other modern car systems that “we need to worry about” because they could be remotely hacked via such diagnostic controls, said another DARPA program manager.

DARPA officials said the country is at risk particularly since the playing field is far from level. Layered security defenses have grown increasingly bloated, according to a recent in-house analysis, while attackers operate with lean, mean malware.

The agency’s analysis reports that some security packages are weighing in at an eye-popping 10 million lines of code, while malicious software on average runs on a whip-thin 125 lines.

To combat such threats, DARPA officials called for both an increase in the development of cyber defensive technologies and of offensive weapon systems.

There’ll be some good money for talented kids in that pot! I presume that Canadian federal government programmers need not apply:

The applications that are not “kicked out” of Service Canada’s automated system at the start cannot be fixed on the computer until a 28-day period has passed, even if the errors are reported to agents in the Service Canada processing office.

These applications then need to be processed manually by agents. The agents have an additional 21 days to do the recalculations, but, because their workforce is shrinking, the time frame is often not met and much longer delays of weeks or months are becoming commonplace.

What’s happening in Greece???

Greece’s critical power-sharing talks have hit a significant hurdle, with political leaders leaving a top-level meeting that had been expected to conclude three days of negotiations without naming a new prime minister to take over from George Papandreou.

The president’s office said Wednesday the meeting would reconvene on Thursday morning. It gave no reason. Earlier, Giorgos Karatzaferis, the head of a small right-wing party, had stormed out of the meeting, accusing the heads of the two main parties of using “trickery” but not giving any details.

I’ve already expressed doubts as to whether the population will permit the “paying back” part of the bail-out plan – but will the politicians even get as far as the “taking the money” part? Bloomberg reports:

Negotiations on a government between Papandreou and Samaras dragged on for a third day today as the two sides disagreed on a prime minister and the opposition balked at European Union demands for written commitments to secure a bailout package.

The new government must implement budget measures and decisions related to an Oct. 26 European bailout package that’s worth 130 billion euros ($177 billion), including a debt swap, before holding elections.

Immediately at stake is the fate of an 8 billion-euro loan installment under an earlier aid package, a 110 billion-euro EU- led bailout agreed in May 2010. The tranche must be paid before the middle of December to prevent a collapse of the country’s financial system.

Italy’s not having much fun either:

The euro-region’s defenses are being breached.

Investors today propelled Italy’s 10-year bond yield to close at a euro-era high of 7.25 percent after the promised exit of Prime Minister Silvio Berlusconi failed to convince them that his country can slash Europe’s second-largest debt burden.

This sounds like dealers are setting up for a lousy auction:

Italy may struggle to sell 5 billion euros ($6.8 billion) of Treasury bills tomorrow, after bond yields surged to euro-era records on Prime Minister Silvio Berlusconi’s resignation offer and LCH Clearnet SA demanded more collateral on the country’s bonds.

Italy auctions one-year bills tomorrow at 11:00 a.m. in Rome, followed by a sale of five-year bonds on Nov. 14. The auction comes after the country’s 10-year bond yield jumped 57 basis points to 7.33 percent, crossing the 7 percent threshold that led Greece, Portugal and Ireland to seek bailouts. Italy paid 3.57 percent the last time it sold one-year bills on Oct. 11. Similar maturity debt currently yields about 8.41 percent.

DBRS downgraded Italy a notch:

DBRS Ratings Limited (DBRS) has today downgraded the ratings on the Republic of Italy’s long-term foreign and local currency debt to A (high) from AA (low). The trend on both ratings remains Negative. The downgrade reflects: (1) persistent stress in market funding conditions; (2) fiscal consolidation implementation risks due to economic and political uncertainties; and, (3) structural economic growth challenges.

European difficulties are having effects in the Antipodes:

New Zealand’s central bank deferred plans to tighten bank lending rules as global turmoil increases the risks for the nation’s economy and financial system.

The Reserve Bank will delay an increase in the core funding ratio to 75 percent from 70 percent by about six months to Jan. 1, 2013, according to its Financial Stability Report released in Wellington today. The ratio sets the minimum share of bank loans that must be funded from local deposits or wholesale borrowings of one year or longer.

“Conditions in global funding markets have deteriorated,” the central bank said in the report. “It would have been very difficult to place new longer-term unsecured debt issues over the past three months as the sovereign debt crisis played out.”

The central bank introduced the ratio in July to reduce local banks’ reliance on short-term debt raised overseas, intending to counter the impact of that funding getting frozen.

Jefferson County’s gone bust:

Jefferson County, Alabama, commissioners voted 4-1 to file the largest U.S. municipal bankruptcy after reaching an impasse over concessions with holders of $3.14 billion of bonds.

JPMorgan Chase & Co. (JPM), which arranged most of the debt to fund a sewer renovation, will likely take the biggest loss.

A provisional agreement with creditors that commissioners approved in September included $1.1 billion in concessions and called for sewer-rate increases of as much as 8.2 percent for the first three years. The county was unable to get signed commitments from creditors, Commission PresidentDavid Carrington said today

The vote by officials in Alabama’s most populous county occurred about a month after Pennsylvania’s capital of Harrisburg sought court protection citing millions in overdue bond payments tied to a trash-to-energy incinerator. A Jefferson filing would eclipse that of California’s Orange County in 1994.

The crisis in Alabama arose when investors dumped Jefferson county’s bonds as the subprime mortgage-market meltdown sent ripples through Wall Street. Jefferson’s floating-rate securities were coupled with interest-rate swaps, a money-saving strategy pitched by banks that backfired. As credit markets convulsed in 2008, the county’s interest costs soared. When banks demanded early payoffs of the bonds, the county defaulted.

The debt deals also were rife with political corruption, leading the cost of the sewer project to soar as it was built during the 1990s. Former commission president and Birmingham Mayor Larry Langford, a Democrat, was convicted of accepting bribes in connection with the financing.

Two former JPMorgan bankers are fighting Securities and Exchange Commission charges that they made $8 million in undisclosed payments to friends of commissioners to secure the bank’s role in the deals. In 2009, JPMorgan agreed to a $722 million settlement with the SEC.

Be careful doing business in Ontario! Don’t sell securities that go down; only sell securities that go up, OK? Companies are now required to report on changes in the analytical methodology of third parties, and to guess how liquid the market for their securities is going to be.

There is renewed speculation that the TMX / Maple deal will close:

TMX, owner of the Toronto Stock Exchange, rose to C$44.70 this month, shrinking the gap to Maple Group Acquisition Corp.’s C$50-a-share offer to the narrowest since it became the sole bidder in June, according to data compiled by Bloomberg.

“The deal will get done and the regulators will probably do a little tinkering around the edges,” Thomas Caldwell, Toronto-based chief executive officer of Caldwell Securities Ltd., which oversees about $1 billion including TMX shares, said in a telephone interview. “At the end of the day, Maple Group’s offering C$50 a share. Price is going to decide this.”

The Competition Bureau is reviewing the C$3.73 billion ($3.64 billion) TMX transaction. Quebec’s Autorite des Marches Financiers scheduled hearings on Nov. 24 and Nov. 25 and the Ontario Securities Commission has hearings Dec. 1 and Dec. 2.

“Regulatory approval is more likely with the board and management supporting the transaction,” Edward Ditmire, an analyst at Macquarie in New York, said in a telephone interview. He says there’s a better than 50 percent chance the deal closes.

It will be a black day for Canada if the banks succeed in cementing a bit more of the Old-boy Club hegemony in the financial landscape. A foreign buyer for the TMX is greatly desirable.

Just in time for the Christmas shopping season comes this insurance news:

Should you be burdened with a particular fear of the supernatural, then you are well looked after when it comes to unusual insurance policies. Ghost, werewolf and vampire insurance can also be procured very easily, with each policy redeemable in the event of an attack by these creatures of the night.

Bell Aliant, proud guarantor of BAF.PR.A, was confirmed by DBRS:

DBRS has today confirmed the short- and long-term ratings of Bell Aliant Regional Communications, Limited Partnership (Bell Aliant or the Company) at R-1 (low) and BBB (high), respectively, along with the preferred share rating at Pfd-3 (high). The trends are Stable. The confirmation reflects a business risk profile that, while undergoing a transition from legacy voice services to focusing on growth areas such as data and video, has to-date been manageable. The ratings also incorporate Bell Aliant’s relatively stable financial risk profile, which remains slightly higher than its Canadian peers but within an acceptable range. DBRS believes that for Bell Aliant, the successful transition to providing new services – both in terms of investment and execution – remains more acute than for other telcos that typically have wireless services throughout their territory to provide growth while this fixed-line transition occurs.

It was a mixed day for the Canadian preferred share market, with PerpetualDiscounts winning 11bp, FixedResets down 3bp and DeemedRetractibles gaining 6bp. Volatility was average. Volume was light.

HIMIPref™ Preferred Indices
These values reflect the December 2008 revision of the HIMIPref™ Indices

Values are provisional and are finalized monthly
Index Mean
Current
Yield
(at bid)
Median
YTW
Median
Average
Trading
Value
Median
Mod Dur
(YTW)
Issues Day’s Perf. Index Value
Ratchet 0.00 % 0.00 % 0 0.00 0 0.0967 % 2,127.6
FixedFloater 4.83 % 4.53 % 26,123 17.25 1 -0.1015 % 3,192.4
Floater 3.38 % 3.40 % 161,266 18.72 2 0.0967 % 2,297.3
OpRet 4.95 % 0.96 % 55,181 1.51 7 0.1845 % 2,483.3
SplitShare 5.78 % 6.77 % 60,433 5.12 3 -0.2525 % 2,501.6
Interest-Bearing 0.00 % 0.00 % 0 0.00 0 0.1845 % 2,270.7
Perpetual-Premium 5.57 % 2.54 % 106,033 0.15 13 0.1653 % 2,156.0
Perpetual-Discount 5.32 % 5.43 % 108,968 14.74 17 0.1115 % 2,290.3
FixedReset 5.13 % 3.07 % 208,077 2.52 62 -0.0299 % 2,343.6
Deemed-Retractible 5.04 % 4.33 % 207,277 3.46 46 0.0575 % 2,217.3
Performance Highlights
Issue Index Change Notes
SLF.PR.H FixedReset -2.37 % YTW SCENARIO
Maturity Type : Hard Maturity
Maturity Date : 2022-01-31
Maturity Price : 25.00
Evaluated at bid price : 23.90
Bid-YTW : 4.40 %
ELF.PR.F Perpetual-Discount -1.14 % YTW SCENARIO
Maturity Type : Limit Maturity
Maturity Date : 2041-11-09
Maturity Price : 22.17
Evaluated at bid price : 22.45
Bid-YTW : 5.96 %
CM.PR.P Deemed-Retractible -1.12 % YTW SCENARIO
Maturity Type : Call
Maturity Date : 2012-10-29
Maturity Price : 25.00
Evaluated at bid price : 25.62
Bid-YTW : 3.04 %
POW.PR.D Perpetual-Discount 1.03 % YTW SCENARIO
Maturity Type : Limit Maturity
Maturity Date : 2041-11-09
Maturity Price : 24.25
Evaluated at bid price : 24.55
Bid-YTW : 5.13 %
BNS.PR.L Deemed-Retractible 1.18 % YTW SCENARIO
Maturity Type : Call
Maturity Date : 2015-04-28
Maturity Price : 25.25
Evaluated at bid price : 25.70
Bid-YTW : 3.95 %
Volume Highlights
Issue Index Shares
Traded
Notes
ENB.PR.B FixedReset 69,654 TD crossed 15,000 at 25.60; RBC crossed 25,000 at the same price.
YTW SCENARIO
Maturity Type : Limit Maturity
Maturity Date : 2041-11-09
Maturity Price : 23.27
Evaluated at bid price : 25.45
Bid-YTW : 3.64 %
CM.PR.G Perpetual-Discount 59,975 Scotia crossed blocks of 10,000 and 25,000, both at 24.95.
YTW SCENARIO
Maturity Type : Limit Maturity
Maturity Date : 2041-11-09
Maturity Price : 24.59
Evaluated at bid price : 24.91
Bid-YTW : 5.45 %
GWO.PR.I Deemed-Retractible 59,574 RBC crossed 49,900 at 22.64.
YTW SCENARIO
Maturity Type : Hard Maturity
Maturity Date : 2022-01-31
Maturity Price : 25.00
Evaluated at bid price : 22.56
Bid-YTW : 5.88 %
MFC.PR.C Deemed-Retractible 43,693 rBC crossed 28,600 at 21.60.
YTW SCENARIO
Maturity Type : Hard Maturity
Maturity Date : 2022-01-31
Maturity Price : 25.00
Evaluated at bid price : 21.52
Bid-YTW : 6.51 %
BAM.PR.Z FixedReset 34,065 Recent new issue.
YTW SCENARIO
Maturity Type : Limit Maturity
Maturity Date : 2041-11-09
Maturity Price : 23.11
Evaluated at bid price : 25.02
Bid-YTW : 4.38 %
CM.PR.E Perpetual-Discount 32,383 YTW SCENARIO
Maturity Type : Limit Maturity
Maturity Date : 2041-11-09
Maturity Price : 24.68
Evaluated at bid price : 24.98
Bid-YTW : 5.64 %
There were 21 other index-included issues trading in excess of 10,000 shares.
Wide Spread Highlights
Issue Index Quote Data and Yield Notes
BAM.PR.H OpRet Quote: 25.36 – 26.83
Spot Rate : 1.4700
Average : 0.9090

YTW SCENARIO
Maturity Type : Call
Maturity Date : 2011-12-09
Maturity Price : 25.00
Evaluated at bid price : 25.36
Bid-YTW : -4.02 %

W.PR.H Perpetual-Discount Quote: 25.08 – 25.47
Spot Rate : 0.3900
Average : 0.2390

YTW SCENARIO
Maturity Type : Limit Maturity
Maturity Date : 2041-11-09
Maturity Price : 23.88
Evaluated at bid price : 25.08
Bid-YTW : 5.48 %

RY.PR.F Deemed-Retractible Quote: 25.15 – 25.50
Spot Rate : 0.3500
Average : 0.2263

YTW SCENARIO
Maturity Type : Call
Maturity Date : 2016-05-24
Maturity Price : 25.00
Evaluated at bid price : 25.15
Bid-YTW : 4.28 %

CU.PR.B Perpetual-Premium Quote: 25.55 – 25.90
Spot Rate : 0.3500
Average : 0.2323

YTW SCENARIO
Maturity Type : Call
Maturity Date : 2011-12-09
Maturity Price : 25.25
Evaluated at bid price : 25.55
Bid-YTW : -12.40 %

CM.PR.M FixedReset Quote: 27.32 – 27.73
Spot Rate : 0.4100
Average : 0.3018

YTW SCENARIO
Maturity Type : Call
Maturity Date : 2014-07-31
Maturity Price : 25.00
Evaluated at bid price : 27.32
Bid-YTW : 3.01 %

TD.PR.G FixedReset Quote: 27.15 – 27.34
Spot Rate : 0.1900
Average : 0.1125

YTW SCENARIO
Maturity Type : Call
Maturity Date : 2014-04-30
Maturity Price : 25.00
Evaluated at bid price : 27.15
Bid-YTW : 2.70 %

TCA Issues Long Paper at 4.587%

Wednesday, November 9th, 2011

DBRS reports that they have:

today assigned a rating of “A” with a Stable trend to the following TransCanada PipeLines Limited (TCPL) new debt issuance:

(1) Proposed $500 million 3.65% unsecured medium-term notes maturing on November 15, 2021.

(2) Proposed $250 million 4.55% unsecured medium-term notes maturing on November 15, 2041.

The issues are expected to settle on November 15, 2011.

The new debt will rank equally, except as to sinking funds, with all of TCPL’s existing and future senior unsecured debt. Net proceeds from the offering will be used to repay indebtedness and for general corporate purposes.

It’s odd that DBRS considers these to be “proposed” issues: the WSJ says it’s not only been done, but that the offering raised $250-million more than the minimum amount targetted and notes:

It also raised C$250 million from an offering of long bonds maturing November 2041. The issue was priced at 184 basis points over the Government of Canada 2041 benchmark to yield 4.587%. The bonds carry a coupon of 4.55%

TCA has two issues of preferred shares outstanding, TCA.PR.X and TCA.PR.Y, both PerpetualPremiums, both with a par value of $50, and both with annual dividends of $2.80, or 5.6%. Sadly, both are trading at levels of about $53, making the YTW scenario a call in the near term, so a comparison to long bonds is of dubious value.

By way of contrast, non-preferred-share-issuing Encana issued in USD at 5.15%:

DBRS has today assigned a rating of A (low) with a Negative trend to the following Encana Corporation (Encana) new debt issuance:

(1) Proposed $600 million 3.9% senior unsecured notes maturing November 15, 2021.

(2) Proposed $400 million 5.15% senior unsecured notes maturing November 15, 2041.

The issues are expected to settle on November 14, 2011.

The new debt will rank equally with all of Encana’s existing and future senior unsecured debt. Net proceeds from the offering will be used to pay down commercial paper indebtedness and for general corporate purposes.

Notes:
All figures in U.S. dollars unless otherwise noted

November 8, 2011

Tuesday, November 8th, 2011

Rumours are floating about specific bank capital surcharges:

Citigroup Inc. (C), JPMorgan Chase & Co., BNP Paribas SA, Royal Bank of Scotland Group Plc, and HSBC Holdings Plc (HSBA) may face top capital surcharges of 2.5 percentage points, according to a provisional list prepared by global regulators and obtained by Bloomberg News.

The list was drawn up as part of plans by the Group of 20 nations to force banks whose failure could damage the global economy to boost their reserves by 1 to 2.5 percentage points above minimum levels agreed on by international regulators. Bank of America Corp. (BAC), Barclays Plc (BARC) and Germany’s biggest bank Deutsche Bank AG (DBK) may face surcharges of 2 percentage points, according to the list.

At least one ECB council member is objecting to the piggy-bank paradigm:

European Central Bank council member Jens Weidmann said the ECB cannot bail out governments by printing money.

“One of the severest forms of monetary policy being roped in for fiscal purposes is monetary financing, in colloquial terms also known as the financing of public debt via the money printing press,” Weidmann, who heads Germany’s Bundesbank, said in a speech in Berlin today. The prohibition of monetary financing in the euro area “is one of the most important achievements in central banking” and “specifically for Germany, it is also a key lesson from the experience of hyperinflation after World War I,” he said.

The ECB is under pressure to ramp up its bond purchases to cap soaring yields in Italy as governments fail to contain the two-year-old sovereign debt crisis. Weidmann also rejected proposals to use Bundesbank currency and gold reserves to help finance purchases by a special fund, saying this is another form of monetary financing.

Pierre Trudeau was a visionary! First in Greece, now in Italy, the slogan is “Elect me and I’ll quit!

Prime Minister Silvio Berlusconi offered to resign as soon as Parliament approves austerity measures in a vote next week, after defections from his ruling party left him without a majority.

“Once that task has been achieved, the prime minister will tender his resignation to the President,” who will then begin consultations with all political parties, President Giorgio Napolitano said tonight in an e-mailed statement after meeting Berlusconi in Rome.

The resignation offer came after Berlusconi failed to muster an absolute majority on a routine parliamentary ballot, obtaining only 308 votes in the 630-seat Chamber of Deputies today.

The yield on Italy’s benchmark 10-year bond jumped 11 basis points today to 6.77 percent, the most since the euro’s introduction in 1999 and near the 7 percent level that drove Greece, Ireland and Portugal to seek international bailouts. The extra premium investors demand to hold the debt instead of German bunds widened to a record 497 basis points.

The desperation of European politicians is leading them down some awfully stupid and dangerous pathways:

Bank regulators may get more powers to enforce a European Union plan to recapitalize lenders, including the ability to ban weaker banks from paying bonuses, under a proposal from the European Commission.

The commission, the EU’s executive arm, will propose the law “in the coming days,” Michel Barnier, the EU’s financial services chief said today.

Europe’s banks will need to raise 106 billion euros ($146 billion) in fresh capital under tougher rules being introduced in response to the euro area’s sovereign-debt crisis, the European Banking Authority said last month.

Policy makers want banks to use funds from withholding bonuses and dividends to reach the capital target, rather than reducing the size of their balance sheets.

The EBA will “ensure that there isn’t deleveraging, and in particular also that there isn’t deleveraging in host countries in which trans-national groups operate as a result of the need to achieve certain capital levels,” Polish Finance Minister Jacek Rostowski said in a speech in Brussels.

Well, if they’re trying to increase capital flight, that’s a really good way to do it! It’s getting to the point where I’m not sure I understand why anybody would entrust any money at all to European bank – whether as equity or insured deposit.

What-Debt? and Spend-Every-Penny (the guys who turned a structural surplus into a structural deficit) are now bringing us Europe: the sequel:

The Harper government will take longer to erase the deficit, won’t raise Employment Insurance premiums as high and will extend a temporary work-sharing program in response to a worsening Canadian economy.

Finance Minister Jim Flaherty released his fall economic update Tuesday, providing the first clear examples of the “flexibility” his government has promised in the face of slower-than-expected economic growth.

These assumptions for slower growth mean Ottawa is now projecting Canada will not produce a fiscal surplus until 2015-16 or 2016-17, depending on the success of a previously-announced plan to find $4-billion a year in spending cuts.

Prime Minister Stephen Harper had promised during the 2011 election campaign that Canada would be in surplus by 2014-15.

The size of the federal debt is now projected to rise from $550.3-billion in 2010-11 to $640.6-billion by 2015-16.

I have no problem with deficit spending, as long as it is accompanied by a plan showing how it will paid for through the cycle. Unfortunately, the Junior Republicans can’t be bothered to think so far ahead.

It was a good day for the Canadian preferred share market, with PerpetualDiscounts gaining 17bp, FixedResets up 4bp and DeemedRetractibles winning 25bp. SLF issues were again notable on the downside of the Performance Highlights table. Volume was good.

HIMIPref™ Preferred Indices
These values reflect the December 2008 revision of the HIMIPref™ Indices

Values are provisional and are finalized monthly
Index Mean
Current
Yield
(at bid)
Median
YTW
Median
Average
Trading
Value
Median
Mod Dur
(YTW)
Issues Day’s Perf. Index Value
Ratchet 0.00 % 0.00 % 0 0.00 0 0.0968 % 2,125.6
FixedFloater 4.82 % 4.53 % 25,353 17.26 1 1.2853 % 3,195.6
Floater 3.38 % 3.41 % 162,401 18.70 2 0.0968 % 2,295.1
OpRet 4.94 % 0.94 % 54,802 1.50 7 -0.1258 % 2,478.7
SplitShare 5.77 % 6.60 % 59,250 5.13 3 -0.2379 % 2,508.0
Interest-Bearing 0.00 % 0.00 % 0 0.00 0 -0.1258 % 2,266.5
Perpetual-Premium 5.57 % 2.79 % 105,708 0.16 13 0.0516 % 2,152.4
Perpetual-Discount 5.33 % 5.31 % 109,499 14.74 17 0.1717 % 2,287.7
FixedReset 5.12 % 2.97 % 209,150 2.51 62 0.0390 % 2,344.3
Deemed-Retractible 5.04 % 4.39 % 208,499 3.82 46 0.2464 % 2,216.1
Performance Highlights
Issue Index Change Notes
GWO.PR.I Deemed-Retractible -1.32 % YTW SCENARIO
Maturity Type : Hard Maturity
Maturity Date : 2022-01-31
Maturity Price : 25.00
Evaluated at bid price : 22.50
Bid-YTW : 5.91 %
FTS.PR.C OpRet -1.14 % YTW SCENARIO
Maturity Type : Call
Maturity Date : 2011-12-08
Maturity Price : 25.50
Evaluated at bid price : 26.10
Bid-YTW : -10.67 %
SLF.PR.A Deemed-Retractible -1.12 % YTW SCENARIO
Maturity Type : Hard Maturity
Maturity Date : 2022-01-31
Maturity Price : 25.00
Evaluated at bid price : 22.12
Bid-YTW : 6.41 %
SLF.PR.B Deemed-Retractible -1.11 % YTW SCENARIO
Maturity Type : Hard Maturity
Maturity Date : 2022-01-31
Maturity Price : 25.00
Evaluated at bid price : 22.37
Bid-YTW : 6.32 %
BMO.PR.Q FixedReset -1.06 % YTW SCENARIO
Maturity Type : Hard Maturity
Maturity Date : 2022-01-31
Maturity Price : 25.00
Evaluated at bid price : 25.23
Bid-YTW : 3.09 %
FTS.PR.H FixedReset 1.18 % YTW SCENARIO
Maturity Type : Limit Maturity
Maturity Date : 2041-11-08
Maturity Price : 23.53
Evaluated at bid price : 25.75
Bid-YTW : 2.82 %
BAM.PR.N Perpetual-Discount 1.28 % YTW SCENARIO
Maturity Type : Limit Maturity
Maturity Date : 2041-11-08
Maturity Price : 22.62
Evaluated at bid price : 22.97
Bid-YTW : 5.22 %
BAM.PR.G FixedFloater 1.29 % YTW SCENARIO
Maturity Type : Limit Maturity
Maturity Date : 2041-11-08
Maturity Price : 25.00
Evaluated at bid price : 19.70
Bid-YTW : 4.53 %
TD.PR.O Deemed-Retractible 1.38 % YTW SCENARIO
Maturity Type : Call
Maturity Date : 2012-10-31
Maturity Price : 25.50
Evaluated at bid price : 25.78
Bid-YTW : 3.72 %
IAG.PR.A Deemed-Retractible 1.71 % YTW SCENARIO
Maturity Type : Hard Maturity
Maturity Date : 2022-01-31
Maturity Price : 25.00
Evaluated at bid price : 22.66
Bid-YTW : 5.93 %
Volume Highlights
Issue Index Shares
Traded
Notes
SLF.PR.F FixedReset 292,424 RBC crossed blocks of 267,700 and 18,400, both at 26.00.
YTW SCENARIO
Maturity Type : Call
Maturity Date : 2014-06-30
Maturity Price : 25.00
Evaluated at bid price : 26.11
Bid-YTW : 4.50 %
CM.PR.E Perpetual-Discount 246,600 TD crossed blocks of 99,700 and 100,000, both at 25.00.
YTW SCENARIO
Maturity Type : Limit Maturity
Maturity Date : 2041-11-08
Maturity Price : 24.69
Evaluated at bid price : 24.99
Bid-YTW : 5.63 %
SLF.PR.G FixedReset 110,370 RBC crossed blocks of 47,200 shares, 14,200 and 10,800, all at 24.50. Desjardins crossed 11,500 at the same price.
YTW SCENARIO
Maturity Type : Hard Maturity
Maturity Date : 2022-01-31
Maturity Price : 25.00
Evaluated at bid price : 24.51
Bid-YTW : 3.68 %
CM.PR.G Perpetual-Discount 88,703 Scotia crossed 50,000 at 24.95. Desjardins crossed 12,000 at the same price.
YTW SCENARIO
Maturity Type : Limit Maturity
Maturity Date : 2041-11-08
Maturity Price : 24.60
Evaluated at bid price : 24.92
Bid-YTW : 5.44 %
RY.PR.R FixedReset 81,875 Scotia crossed blocks of 30,000 and 44,700, both at 26.93.
YTW SCENARIO
Maturity Type : Call
Maturity Date : 2014-02-24
Maturity Price : 25.00
Evaluated at bid price : 26.90
Bid-YTW : 2.71 %
BAM.PR.O OpRet 50,900 TD crossed 50,000 at 25.80.
YTW SCENARIO
Maturity Type : Option Certainty
Maturity Date : 2013-06-30
Maturity Price : 25.00
Evaluated at bid price : 25.58
Bid-YTW : 3.90 %
There were 38 other index-included issues trading in excess of 10,000 shares.
Wide Spread Highlights
Issue Index Quote Data and Yield Notes
GWO.PR.J FixedReset Quote: 26.07 – 26.60
Spot Rate : 0.5300
Average : 0.3725

YTW SCENARIO
Maturity Type : Call
Maturity Date : 2013-12-31
Maturity Price : 25.00
Evaluated at bid price : 26.07
Bid-YTW : 4.24 %

GWO.PR.M Deemed-Retractible Quote: 25.95 – 26.49
Spot Rate : 0.5400
Average : 0.3975

YTW SCENARIO
Maturity Type : Hard Maturity
Maturity Date : 2022-01-31
Maturity Price : 25.00
Evaluated at bid price : 25.95
Bid-YTW : 5.43 %

BNA.PR.E SplitShare Quote: 23.09 – 23.75
Spot Rate : 0.6600
Average : 0.5198

YTW SCENARIO
Maturity Type : Hard Maturity
Maturity Date : 2017-12-10
Maturity Price : 25.00
Evaluated at bid price : 23.09
Bid-YTW : 6.60 %

HSB.PR.C Deemed-Retractible Quote: 25.24 – 25.80
Spot Rate : 0.5600
Average : 0.4300

YTW SCENARIO
Maturity Type : Hard Maturity
Maturity Date : 2022-01-31
Maturity Price : 25.00
Evaluated at bid price : 25.24
Bid-YTW : 5.08 %

HSB.PR.D Deemed-Retractible Quote: 25.30 – 25.70
Spot Rate : 0.4000
Average : 0.2910

YTW SCENARIO
Maturity Type : Hard Maturity
Maturity Date : 2022-01-31
Maturity Price : 25.00
Evaluated at bid price : 25.30
Bid-YTW : 4.95 %

IGM.PR.B Perpetual-Premium Quote: 26.20 – 26.50
Spot Rate : 0.3000
Average : 0.2062

YTW SCENARIO
Maturity Type : Call
Maturity Date : 2018-12-31
Maturity Price : 25.00
Evaluated at bid price : 26.20
Bid-YTW : 5.15 %

November 7, 2011

Tuesday, November 8th, 2011

Another small step in the decline of the West:

Hong Kong companies are issuing a record amount of bonds in Singapore dollars as Europe’s debt crisis boosts relative yields on securities denominated in the U.S. currency, enhancing the city-state’s appeal as a rival financial center.

Singapore-dollar bond sales by borrowers from Hong Kong have risen to $2 billion this year, from $671 million in all of 2010, according to data compiled by Bloomberg. Developers including Henderson Land Development Co. accounted for at least 96 percent of the total. At the same time, Hong Kong companies’ offerings of U.S. dollar notes have shrunk to $1.8 billion from $7 billion in 2010.

Hong Kong borrowers are turning to Singapore as Europe’s deepening debt crisis has driven relative yields on Asian U.S. dollar debt higher. Singapore’s currency market, Asia’s biggest by trading volume, is an additional attraction, enabling efficient conversion to other regional denominations.

To the astonishment of regulators everywhere some banks are bailing out of southern Europe:

BNP Paribas, France’s biggest bank, booked a loss of 812 million euros ($1 billion) in the past four months from reducing its holdings of European sovereign debt, while Commerzbank took losses as it cut its Greek, Irish, Italian, Portuguese and Spanish bonds by 22 percent to 13 billion euros this year.

Banks are selling debt of southern European nations as investors punish companies with large holdings and regulators demand higher reserves to shoulder possible losses. The European Banking Authority is requiring lenders to boost capital by 106 billion euros after marking their government debt to market values. The trend may undermine European leaders’ efforts to lower borrowing costs for countries such as Greece and Italy while generating larger writedowns and capital shortfalls.

Greece might have a new government soon:

Papandreou and Antonis Samaras, leader of New Democracy, “made progress in talks” yesterday “to name a head of a national unity government,” Elias Mosialos, a Greek government spokesman, said in an e-mailed statement. The two men spoke by phone a number of times yesterday, said a Greek government official who declined to be named. Talks will resume in Athens today, the official said.

The unity government’s mission will be implementing the European summit decision from Oct. 26 on a second Greek financing package of 130 billion euros ($179 billion) before leading the country to elections, according to an e-mailed statement from the premier’s office. Papandreou, who has agreed to step aside for a new prime minister, spoke yesterday with German Chancellor Angela Merkel; Jean-Claude Juncker, who heads the group of euro area finance ministers; and European Commission President Jose Barroso.

Not much point talking to Juncker, because he’s a liar. Anyway, it’s lovely that the unity government will be implementing the borrowing part of the plan, but it’s unclear to me whether they will be able to deliver on the paying-back part of the plan. Capital flight is becoming a big problem:

Unsparing in its criticism of Greece, Bild launches another broadside against its favourite target: “Greeks stash 200 billion euros in Swiss bank accounts!” headlines the Berlin tabloid, whose influence on the Chancellorship is an open secret. “While Europe struggles to help Greece with multi-billion euro bailout plans, more and more Greeks are transferring their money out of the country” to avoid the consequences of a crash in the national economy, announces Bild. “Stop the capital flight!” insists the tabloid’s editorial, which lambasts the Greek elite for refusing to introduce a tax on money transfers or penalties for tax evasion.

The Globe & Mail reports:

That disenchantment has also been reflected in the flight of capital from the country in recent weeks. The New York Times, citing banking sources in Athens, estimated that €10-billion to €20-billion were whisked away to safer countries in September and October, escalating a trend that saw €46-billion in deposits leave Greek banks since January 2010.

The wealthy have reportedly been paying cash for homes in London, while those with more modest incomes are stuffing euro notes into safe-deposit boxes.

I’m sure that human flight is a problem, too, although I confess I have no evidence to support this. But come on! If you were Greek, aged under, say, 35, and were trained in an actual skill (doctors and nurses, for instance, have highly transportable skills) wouldn’t you be thinking that maybe France, Germany, or the UK would be better places to make a living?

And let’s not even mention Italy, it’s too depressing. Oh, all right, we’ll talk about Italy:

Italy’s cost of borrowing money soared to its highest point since the euro zone was formed, signalling a growing conviction the sovereign debt crisis is about to get worse as the currency union’s third-largest economy creeps closer to a financial cliff.

The yield on 10-year Italian bonds hit 6.68 per cent – a 14-year high – on Monday before narrowing to 6.45 per cent, amid reports that embattled Prime Minister Silvio Berlusconi was about to resign. Greece, Ireland and Portugal each were forced to seek bailouts soon after their bond yields climbed past 7 per cent.

As long as we’re talking about Europe, DBRS has some interesting things to say about Belgian mortgages:

Firstly, according to data from obtained by DBRS, Belgium has owner-occupation levels that are higher than neighbouring European countries at 71%, compared to 55% for France and 53% for the Netherlands. This is partly as a result of the house price growth over the last decade outstripping the commensurate growth in rental return. It is also infl uenced by the fact that Belgium has very high property purchase transaction costs (both buying and selling property) relative to other European jurisdictions. DBRS understands that purchase costs are routinely in the range of 10-20% of the property cost. Both these factors combined have meant that investment in property for speculative purposes is relatively unattractive as the rental yield is, comparative to other European jurisdictions, low, and day one cash outlay is high.

In Belgium fi xed rate mortgages represent the majority of the market and the majority of the loans have a fixed rate of interest for 10 years or more or for the entire term of the loan. Variable rate loans also feature and differ from the completely variable rate loans found in other jurisdictions in that their variability is restricted by caps and fl oors in the interest rate. Rate caps offer borrowers some protection from spikes in interest rates by limiting the potential mortgage payments due by borrowers regardless of prevailing interest rates.

As part of the continuing campaign to make it impossible for Bad People to do business by making it impossible for anybody to do business, the federal government has issued a Consultation Paper on Proposed Amendments to the Proceeds of Crime (Money Laundering) and Terrorist Financing Regulations on Ascertaining Identity. Naturally, no attempt is made to justify the proposed revisions to protocol in terms of actual results; it is sufficient to pick objectives out of the air, say ‘This makes sense!’ and then enforce it.

BIS has issued a working paper by Michael Brei, Leonardo Gambacorta and Goetz von Peter titled Rescue packages and bank lending:

This paper examines whether the rescue measures adopted during the global financial crisis helped to sustain the supply of bank lending. The analysis proposes a setup that allows testing for structural shifts in the bank lending equation, and employs a novel dataset covering large international banks headquartered in 14 major advanced economies for the period 1995–2010. While stronger capitalisation sustains loan growth in normal times, banks during a crisis can turn additional capital into greater lending only once their capitalisation exceeds a critical threshold. This suggests that recapitalisations may not translate into greater credit supply until bank balance sheets are sufficiently strengthened.

A scandal regarding Olympus has been simmering for a while and has now come to a boil – Olympus was naughty:

Olympus Corp. (7733) said it hid losses by paying inflated fees to advisers on the 2008 acquisition of Gyrus Group Plc, the first admission of wrongdoing from the Japanese camera and medical-equipment maker since accusations from its former chief executive officer surfaced four weeks ago.

The stock plunged by the daily limit after the company said it also used three other acquisitions to help hide the losses on investments from the 1990s. Allegations by Michael C. Woodford after he was axed as CEO on Oct. 14 had wiped more than half the value from the company’s stock before today.

Prohibition is drying up in the States:

U.S. states that have kept a tight rein on alcohol sales since the Prohibition era may be loosening their grip.

Lawmakers in Utah, where even high-alcohol beer is sold through state liquor stores, were urged by an advisory panel this year to put the business in private hands. Pennsylvania, Virginia and North Carolina have considered privatizing state liquor outlets. Tomorrow in Washington, votes will be counted on a ballot measure backed by Costco Wholesale Corp. (COST) that would end state control of liquor retailing.

Budget deficits forecast to reach $103 billion this fiscal year are making states more willing to open the taps, to the dismay of some public-health advocates who warn it may exacerbate social ills. Companies including Costco, bourbon maker Beam Inc. and Warren Buffett’s Berkshire Hathaway Inc. (BRK/A), which owns food and alcohol distributor McLane Co., may gain a larger share of the $8.5 billion in gross sales last year in the 18 states where liquor is still controlled.

One wonders if Ontario will ever follow!

There was a defense of milkfare in Saturday’s Globe:

[Federal Agriculture Minister Gerry Ritz] noted the Americans approved $450-million (U.S.) last year to backstop their dairy industry.

How much did Ottawa spend on backstopping Canadian dairy farmers?

“Zip,” Mr. Ritz said.

Oh, and how much did consumers pay directly to subsidize the bucolic lifestyle of the favoured few?

Every year the distortions caused by the system grow larger. Canadians may not realize it when they go to the grocery store, but they’re paying twice the world average for dairy products – and up to three times what Americans pay. That’s a hidden $3-billion a year tax on all of us.

Roughly half the money flows back to dairy farmers, making them richer than other farmers, who work just as hard. Bloated government agencies and marketing boards soak up a significant chunk of the rest.

I’d rather make my donation directly, assuming that I have to make one at all. But maybe that’s just me.

It was a mixed day for the Canadian preferred share market, with PerpetualDiscounts gaining 5bp, FixedResets down 9bp and DeemedRetractibles losing 21bp. Good volatility, all losers, with Sun Life notable again for its losses. Volume was light.

HIMIPref™ Preferred Indices
These values reflect the December 2008 revision of the HIMIPref™ Indices

Values are provisional and are finalized monthly
Index Mean
Current
Yield
(at bid)
Median
YTW
Median
Average
Trading
Value
Median
Mod Dur
(YTW)
Issues Day’s Perf. Index Value
Ratchet 0.00 % 0.00 % 0 0.00 0 -0.0967 % 2,123.5
FixedFloater 4.88 % 4.60 % 24,479 17.17 1 0.0000 % 3,155.1
Floater 3.39 % 3.41 % 69,476 18.70 2 -0.0967 % 2,292.8
OpRet 4.94 % 0.95 % 50,756 1.50 7 -0.0984 % 2,481.8
SplitShare 5.75 % 6.41 % 59,861 5.14 3 -0.3903 % 2,514.0
Interest-Bearing 0.00 % 0.00 % 0 0.00 0 -0.0984 % 2,269.4
Perpetual-Premium 5.56 % 3.30 % 107,007 0.47 13 0.0779 % 2,151.3
Perpetual-Discount 5.33 % 5.40 % 108,518 14.74 17 0.0510 % 2,283.8
FixedReset 5.12 % 3.01 % 207,994 2.51 62 -0.0855 % 2,343.4
Deemed-Retractible 5.06 % 4.45 % 211,431 3.82 46 -0.2119 % 2,210.6
Performance Highlights
Issue Index Change Notes
SLF.PR.F FixedReset -1.80 % YTW SCENARIO
Maturity Type : Call
Maturity Date : 2014-06-30
Maturity Price : 25.00
Evaluated at bid price : 26.16
Bid-YTW : 4.41 %
SLF.PR.A Deemed-Retractible -1.71 % YTW SCENARIO
Maturity Type : Hard Maturity
Maturity Date : 2022-01-31
Maturity Price : 25.00
Evaluated at bid price : 22.37
Bid-YTW : 6.26 %
IAG.PR.A Deemed-Retractible -1.63 % YTW SCENARIO
Maturity Type : Hard Maturity
Maturity Date : 2022-01-31
Maturity Price : 25.00
Evaluated at bid price : 22.28
Bid-YTW : 6.15 %
BAM.PR.H OpRet -1.63 % YTW SCENARIO
Maturity Type : Call
Maturity Date : 2011-12-07
Maturity Price : 25.00
Evaluated at bid price : 25.35
Bid-YTW : -3.92 %
SLF.PR.B Deemed-Retractible -1.22 % YTW SCENARIO
Maturity Type : Hard Maturity
Maturity Date : 2022-01-31
Maturity Price : 25.00
Evaluated at bid price : 22.62
Bid-YTW : 6.17 %
GWO.PR.J FixedReset -1.21 % YTW SCENARIO
Maturity Type : Call
Maturity Date : 2013-12-31
Maturity Price : 25.00
Evaluated at bid price : 26.18
Bid-YTW : 4.02 %
Volume Highlights
Issue Index Shares
Traded
Notes
CM.PR.G Perpetual-Discount 75,245 Desjardins crossed 27,000 at 24.90.
YTW SCENARIO
Maturity Type : Limit Maturity
Maturity Date : 2041-11-07
Maturity Price : 24.58
Evaluated at bid price : 24.90
Bid-YTW : 5.45 %
BAM.PR.Z FixedReset 35,160 Recent new issue.
YTW SCENARIO
Maturity Type : Limit Maturity
Maturity Date : 2041-11-07
Maturity Price : 23.11
Evaluated at bid price : 25.02
Bid-YTW : 4.38 %
BNS.PR.Z FixedReset 33,500 Recent secondary offering.
YTW SCENARIO
Maturity Type : Hard Maturity
Maturity Date : 2022-01-31
Maturity Price : 25.00
Evaluated at bid price : 24.92
Bid-YTW : 3.21 %
GWO.PR.J FixedReset 30,964 Scotia crossed 14,000 at 26.50.
YTW SCENARIO
Maturity Type : Call
Maturity Date : 2013-12-31
Maturity Price : 25.00
Evaluated at bid price : 26.18
Bid-YTW : 4.02 %
RY.PR.W Perpetual-Discount 28,355 YTW SCENARIO
Maturity Type : Limit Maturity
Maturity Date : 2041-11-07
Maturity Price : 24.40
Evaluated at bid price : 24.91
Bid-YTW : 4.90 %
BMO.PR.N FixedReset 27,385 YTW SCENARIO
Maturity Type : Call
Maturity Date : 2014-02-25
Maturity Price : 25.00
Evaluated at bid price : 27.17
Bid-YTW : 2.47 %
There were 25 other index-included issues trading in excess of 10,000 shares.
Wide Spread Highlights
Issue Index Quote Data and Yield Notes
TCA.PR.Y Perpetual-Premium Quote: 52.62 – 53.34
Spot Rate : 0.7200
Average : 0.4623

YTW SCENARIO
Maturity Type : Call
Maturity Date : 2014-03-05
Maturity Price : 50.00
Evaluated at bid price : 52.62
Bid-YTW : 3.30 %

SLF.PR.F FixedReset Quote: 26.16 – 26.90
Spot Rate : 0.7400
Average : 0.4972

YTW SCENARIO
Maturity Type : Call
Maturity Date : 2014-06-30
Maturity Price : 25.00
Evaluated at bid price : 26.16
Bid-YTW : 4.41 %

FTS.PR.C OpRet Quote: 26.40 – 26.95
Spot Rate : 0.5500
Average : 0.3634

YTW SCENARIO
Maturity Type : Call
Maturity Date : 2011-12-07
Maturity Price : 25.50
Evaluated at bid price : 26.40
Bid-YTW : -23.58 %

HSB.PR.C Deemed-Retractible Quote: 25.15 – 25.56
Spot Rate : 0.4100
Average : 0.2875

YTW SCENARIO
Maturity Type : Call
Maturity Date : 2014-06-30
Maturity Price : 25.00
Evaluated at bid price : 25.15
Bid-YTW : 5.11 %

IAG.PR.F Deemed-Retractible Quote: 25.70 – 26.20
Spot Rate : 0.5000
Average : 0.3802

YTW SCENARIO
Maturity Type : Hard Maturity
Maturity Date : 2022-01-31
Maturity Price : 25.00
Evaluated at bid price : 25.70
Bid-YTW : 5.66 %

CM.PR.P Deemed-Retractible Quote: 25.85 – 26.21
Spot Rate : 0.3600
Average : 0.2443

YTW SCENARIO
Maturity Type : Call
Maturity Date : 2012-10-29
Maturity Price : 25.00
Evaluated at bid price : 25.85
Bid-YTW : 2.08 %

The Life Insurance Industry and the Long Game

Monday, November 7th, 2011

Julie Dickson of OSFI gave a speech titled The Life Insurance Industry and the Long Game, which gave some gentle hints to the industry, but was short on details regarding the potential for regulatory change:

Should rates continue at the current low level – below 3% on government bonds for a 30-year term – it will be a real game changer for the life insurance sector.

Since life insurers often lock in their assumptions for the expected rate of return when the product is priced, there is an implicit assumption that the life insurer will continue to earn the same average interest rate over the lifetime of the product. When interest rates fall life insurers must reinvest the renewal premiums on new investments at lower rates than originally priced, leading to a compression in the product margin.

As regulators, we want life insurers to maintain healthy solvency ratios and still deliver on their promises to policyholders. If insurers are moving risk from their balance sheets onto policyholders, policyholders need to understand the risks they are assuming – we would not want to see a repeat of the vanishing premium events of the early 1990s.

The low interest rate environment also puts pressure on life insurers to recognize that they must discount their liabilities at the prevailing rate of interest. Currently in Canada, actuarial practice allows life insurers to grade in the effects of a decreasing interest rate environment over 10 years. This is a prudent approach. But we are concerned that a few life insurers may not be moving quickly enough to recognize that a change in strategy is also required. Life insurers need to start making changes to their product portfolios today to mitigate the grading of these low interest rates into the ultimate reinvestment rate (URR) to value long term insurance liabilities.

Through fora like the G-20, the Basel Committee on Banking Supervision, and the Financial Stability Board, international agreements are moving from discussion to implementation. The banking industry has been the focus of the majority of the reforms to date, but the life insurance industry is never far from the discussions.

For example, we see the role of the Chief Risk Officer (CRO) as being of primary importance to both banks and insurers. The first line of defence is the business itself and it must own the risk in its operations. We see the CRO as being another line of defence for the board, shareholders, creditors, policyholders and other significant stakeholders (including regulators and supervisors) to ensure the effective management of risk within a financial institution – sort of like wearing a belt and suspenders, or a check on the front office. We expect the CRO to be independent, to work with the board to ensure there are independent processes and controls throughout the organization, and to serve the interests and concerns of significant stakeholders. Strengthening the role of the CRO is a significant change for some life insurers, but a necessary one.

On the process of stress testing, we know that the recent “simulated crisis” stress test that OSFI asked specific Canadian life insurers to undertake did cause some concerns for those companies, in particular the degree of detail we requested. At the same time, however, we were struck by some of the weaknesses in the operating capacity of companies to provide the material in a timely manner. We have had discussions with industry representatives to review these concerns and are in the process of making changes to the reporting requirements of the 2012 stress test.

An issue that is receiving considerable attention globally is capital. The right amount of regulatory capital needs to be carried for the right risk. As the regulatory capital regime in Canada evolves, the objective will be to ensure this happens. We also encourage insurers to continue to develop their capabilities: economic capital models need to be more than a multiple (or a fraction) of regulatory capital – they need to allocate the right economic capital to the right risk.

Countercyclical Credit Buffers

Monday, November 7th, 2011

The Bank for International Settlements has released a working paper by Mathias Drehmann, Claudio Borio and Kostas Tsatsaronis titled Anchoring countercyclical capital buffers: the role of credit aggregates:

We investigate the performance of different variables as anchors for setting the level of the countercyclical regulatory capital buffer requirements for banks. The gap between the ratio of credit-to-GDP and its long-term backward-looking trend performs best as an indicator for the accumulation of capital as this variable captures the build-up of system-wide vulnerabilities that typically lead to banking crises. Other indicators, such as credit spreads, are better in indicating the release phase as they are contemporaneous signals of banking sector distress that can precede a credit crunch.

They explain:

We find that the variable that performs best as an indicator for the build-up phase is the gap between the ratio of credit-to-GDP and its long-term trend (the credit-to-GDP gap). Across countries and crisis episodes, the variable exhibits very good signalling properties, as rapid credit growth lifts the gap as early as three or four years prior to the crisis, allowing banks to build up capital with sufficient lead time. In addition, the gap typically generates very low “noise”, by not producing many false warning signals that crises are imminent.

The credit-to-GDP gap, however, is not a reliable coincident indicator of systemic stress in the banking sector. In general, a prompt and sizeable release of the buffer is desirable. Banks would then be free to use the capital to absorb writedowns. A gradual release would reduce the buffer’s effectiveness. Aggregate credit often grows even as strains materialise in the banking system. This reflects in part borrowers’ ability to draw on existing credit lines and banks’ reluctance to call loans as they tighten standards on new ones. A fall in GDP can also push the ratio higher. Aggregate credit spreads do a better job in signalling stress. However, their signal is very noisy: all too often they would have called for a release of capital at the wrong time. Moreover, as spread data do not exist for a number of countries their applicability would be highly constrained internationally.

We conclude that it would be difficult for a policy tool to rely on a single indicator as a guide across all cyclical phases. It could be possible to construct rules based on a range of conditioning variables rather than just one, something not analysed in this paper. However, it is hard to envisage how this could be done in a simple, robust and transparent way. More generally, our analysis shows that all indicators provide false signals. Thus, no fully rule-based mechanism is perfect. Some degree of judgement, both for the build-up and particularly for the release phase, would be inevitable when setting countercyclical capital buffers in practice. That said, the analysis of the political economy of how judgement can be incorporated in a way that preserves transparency and accountability of the policymakers in charge goes beyond the scope of this paper.

It’s a lucky thing that judgement is required for the process to work – otherwise there might be layoffs in the regulatory ranks! It’s also a lucky thing that details regarding the incorporation of judgement are beyond the scope of the paper, as otherwise one might have to examine the track record of the regulatory establishment in predicting crises.

I suggest that incorporating the judgement of the regulators into the process will have numerous effects:

  • Increasing politicization of the regulatory bureaucracy
  • Fewer crises (since the regulators will tend to err on the side of caution)
  • More severe crises (since the range of judgments existing in the private sector will be replaced by a one-size-fits-all judgment imposed according to the fad of the day)
  • increased uncertainty during a crisis, as both the sellers and the buyers of new bank capital will be unsure as to whether or not the buffers will be released.

I suggest that eventually we will regret the role of regulatory judgement to the extent that it is incorporated into the process.

I believe that the release of countercyclical buffers should be linked to the amount by which a bank’s write-offs have exceeded the norm for the past one (maybe two?) years. This would encourage (or at least mitigate the discouragement) of recognition of losses and provide a time limit for raising replacement capital (since the release will be effective for only one (maybe two) years.

The authors considered using bank losses as the anchor (building-up) indicator:

Aggregate gross losses: This indicator of performance focuses on the cost side (non-performing loans, provisions etc). The financial cycle is frequently signalled by the fall and rise of realised losses.

Although the use of this signal is not supported by the raw data, I suggest that:

  • It provides the most logical link to the condition that one is trying to alleviate, and
  • the knock-on effect of such a change (i.e., the way in which behaviour will be adjusted to account for the adjustement in rules) is in this case highly desirable – losses will be recognized faster.

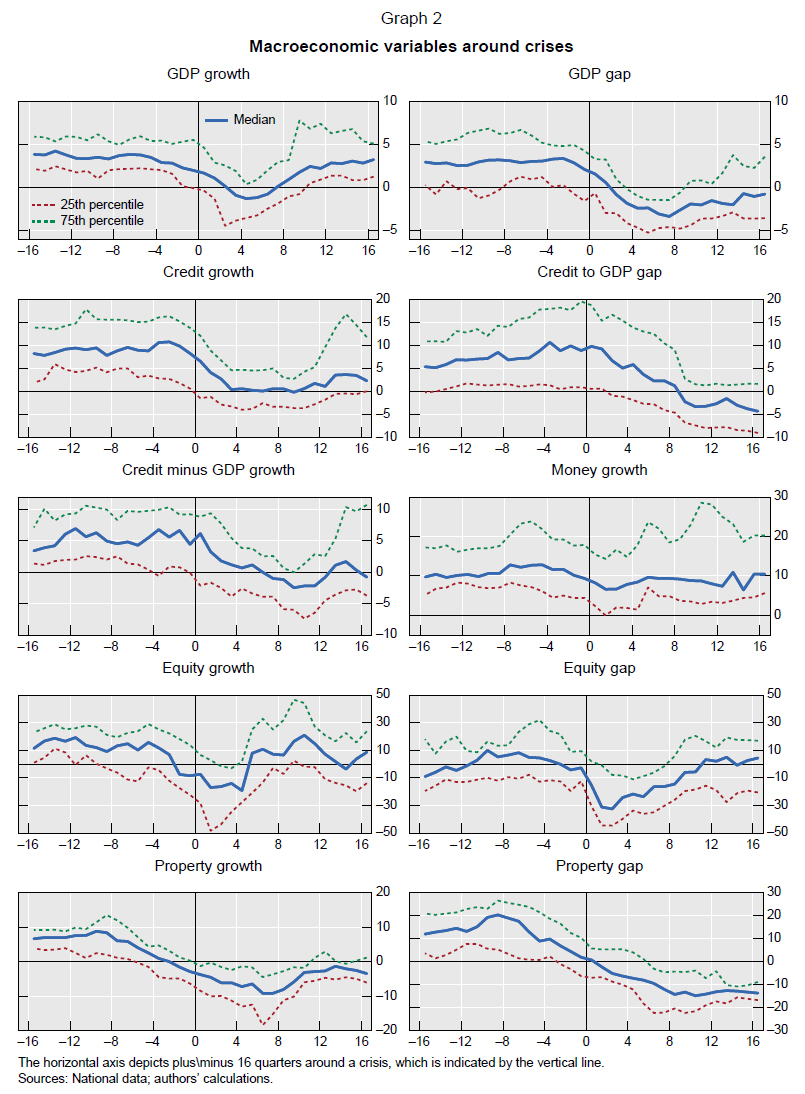
As the authors’ graph shows, there’s no magic formula for predicting a bank crisis:


Click for Big

Although the credit-to-GDP gap is the best-performing indicator for the build-up phase, Graph 2 indicates that it declines only slowly once crises materialise. This is also borne out by the statistical tests shown in Tables 5 to 7. As before, bold values for “Predicted” highlight thresholds for which a release signal is issued correctly for at least 66% of the crises. The bold noise-to-signal ratio indicates the lowest noise-to-signal ratio for all threshold values that satisfy this condition.

None of the macro variables and of the indicators of banking sector conditions satisfy the required degree of predictive power to make them robust anchor variables for the release phase, ie none of these variables signals more than 66% of the crises. The best indicator is a drop of credit growth below 8%. This happens at the onset of more than 40% of crises and such a signal provides very few false alarms (the noise-to-signal ratio is around 10%).

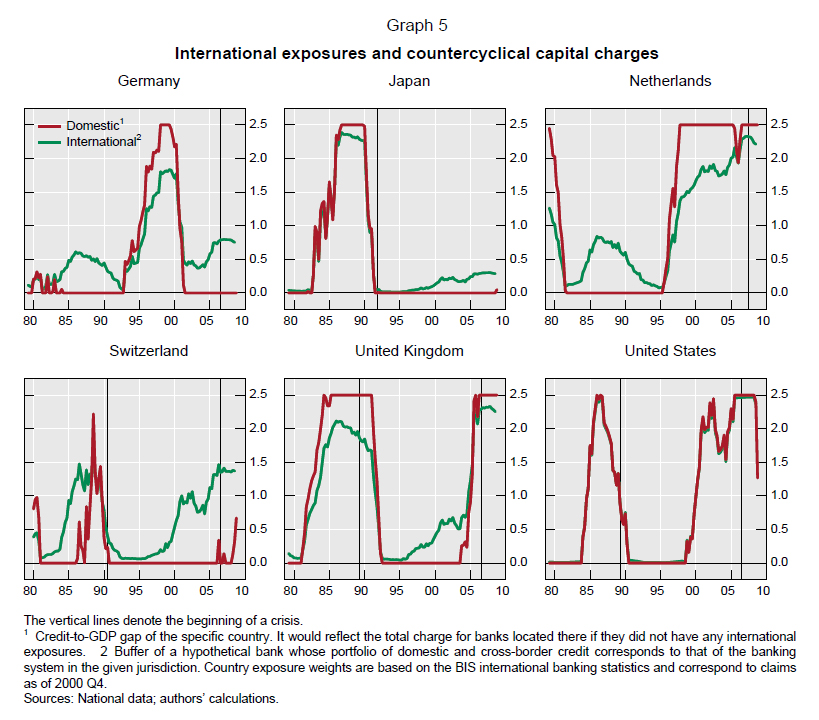
A backtest of the Credit Gap as an anchor variable is encouraging:


Click for Big

Part of the authors’ conclusion is:

The analysis shows that the best variables to signal the pace and size of the build-up of the buffers differ from those that provide the best signals for their release. Credit, measured by the deviation of the credit-to-GDP ratio from its trend, emerges as the best variable for the build-up phase, as it has the strongest leading indicator properties for financial system distress. A side-benefit of using this variable as the anchor is that it could help to restrain the credit boom and hence risk taking to some extent.

A final word of caution is in order. Are our empirical results subject to the usual Lucas or Goodhart critiques? In other words, if the scheme proved successful, would the leading indicator properties of the credit-to-GDP variable disappear? The answer is “yes”, by definition, if the criterion of success was avoiding major distress among banks. As credit exceeds the critical threshold, banks would build-up buffers to withstand the bust. If, in addition, the scheme acted as a brake on risk-taking during the boom, the bust would be less likely in the first place. However, the answer is less clear if the criterion was the more ambitious one of avoiding disruptive financial busts: busts could occur even if banks remained reasonably resilient. In either situation, however, the loss of predictive content per se would be no reason to abandon the scheme.

One thing I will note is that it may be helpful to disaggregate the accumulation signal. As has previously been reported on PrefBlog, residential real-estate now makes up more than 40% of Canadian banks’ credit portfolios, vs. the more normal 30%. I suggest that it would be useful to examine the components of the credit gap, in the hopes that one or more of them will prove a better signal than the complete set.

It may also be the case that changes in the proportion of various components of aggregate credit are just as important as the aggregate amount itself – these changes could be indicative of dislocations in the economy that will have grievous effects if, as and when they return to normal.

MAPF Performance: October, 2011

Sunday, November 6th, 2011

The fund had a good month in October, making up some of the ground lost in September.

The fund’s Net Asset Value per Unit as of the close October 31 was $10.4924.

Returns to October 31, 2011
Period MAPF Index CPD
according to
Claymore
One Month +2.16% +0.60% +0.82%
Three Months -3.80% -0.39% -0.65%
One Year +2.37% +6.44% +3.72%
Two Years (annualized) +11.41% +10.28% N/A
Three Years (annualized) +27.68% +12.72% +9.95%
Four Years (annualized) +18.37% +5.90%  
Five Years (annualized) +13.74% +3.64%  
Six Years (annualized) +12.47% +3.88%  
Seven Years (annualized) +11.58% +3.90%  
Eight Years (annualized) +12.06% +4.11%  
Nine Years (annualized) +13.57% +4.46%  
Ten Years (annualized) +12.01% +4.37%  
The Index is the BMO-CM “50”
MAPF returns assume reinvestment of distributions, and are shown after expenses but before fees.
CPD Returns are for the NAV and are after all fees and expenses.
* CPD does not directly report its two-year returns.
Figures for Omega Preferred Equity (which are after all fees and expenses) for 1-, 3- and 12-months are +0.85%, -0.52% and +4.67%, respectively, according to Morningstar after all fees & expenses. Three year performance is +10.86%.
Figures for Jov Leon Frazer Preferred Equity Fund Class I Units (which are after all fees and expenses) for 1-, 3- and 12-months are +0.54%, -0.26% and +1.79% respectively, according to Morningstar
Figures for Manulife Preferred Income Fund (formerly AIC Preferred Income Fund) (which are after all fees and expenses) for 1-, 3- and 12-months are +0.40%, -0.30% & +3.36%, respectively
Figures for Horizons AlphaPro Preferred Share ETF are not yet available (inception date 2010-11-23)

MAPF returns assume reinvestment of dividends, and are shown after expenses but before fees. Past performance is not a guarantee of future performance. You can lose money investing in Malachite Aggressive Preferred Fund or any other fund. For more information, see the fund’s main page. The fund is available either directly from Hymas Investment Management or through a brokerage account at Odlum Brown Limited.

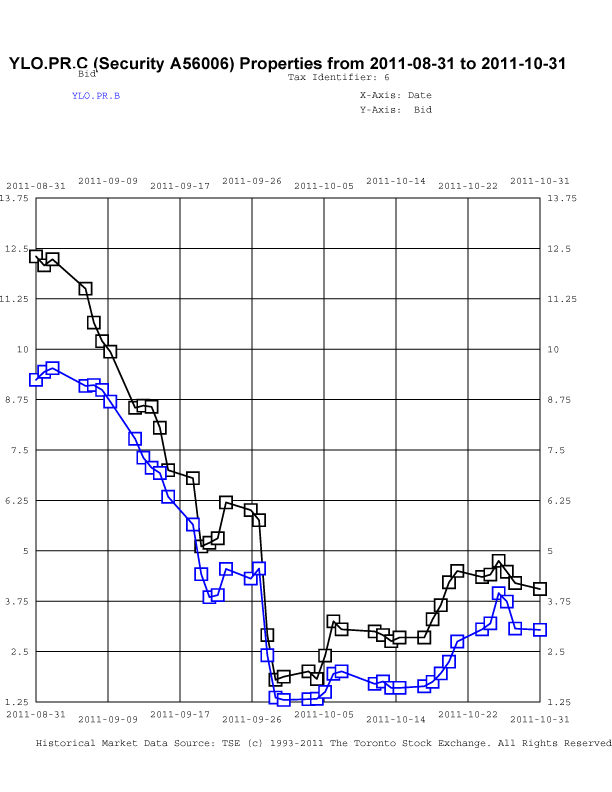
The fund’s returns in October were aided by a small bounce in the value of the YLO preferreds:


Click for big

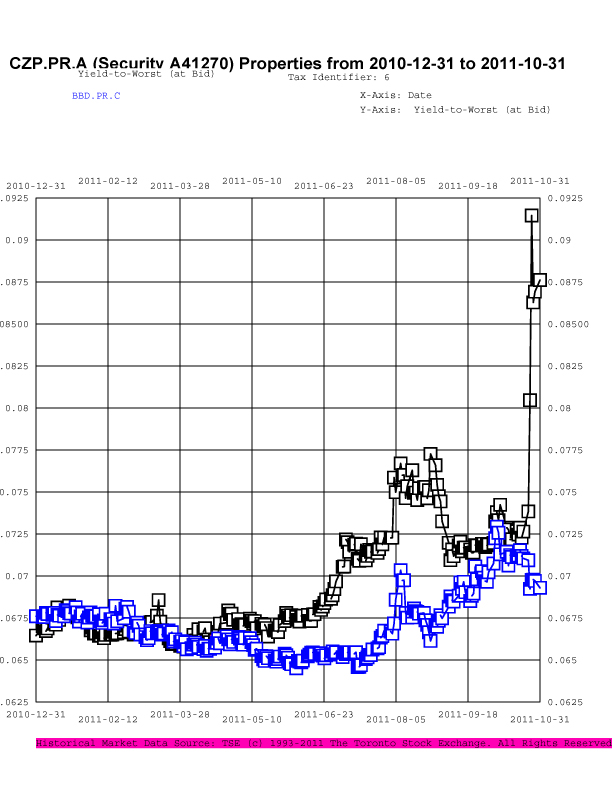
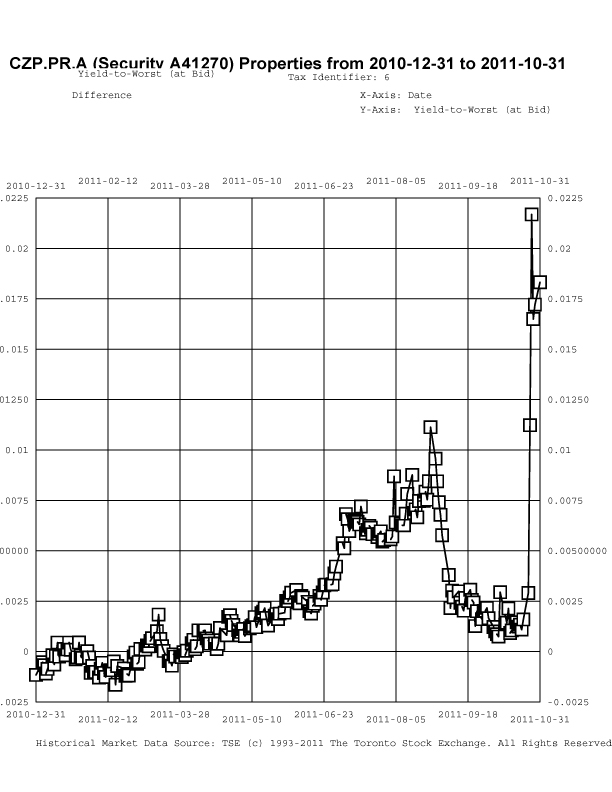
However, there was a drag on performance due to a holding in CZP.PR.A. The bulk of this position was purchased in February and March of this year, when this PerpetualDiscount issue was rated three notches higher than BBD.PR.C, but yielded about the same:

The spread widened in June, 2011, following S&P’s announcemnet that CZP was on review-negative, but gradually returned to more usual levels … until the details of the take-over by Atlantic Power (ATP) were announced! DBRS warned of a three-notch downgrade (which would make the credit ratings of BBD and CZP equal) and … there was a lot of selling in late October.

The problem with the ATP take-over is that it is being structured, effectively, as a complete acquisition, rather than keeping Capital Power as a wholly-owned subsidiary. While the structure retains the wholly-owned subsidiary legal structure, the subsidiary is guaranteeing the senior debt of the holding company (the same way in which the attempted Teachers / BCE deal was structured), so CZP has lost its credit advantage of being “closer to the money” than the holding company.

The position in CZP.PR.A as of October 31 amounted to about 2.6% of fund value. It is my current intention to maintain the position until such time as the yield is again comparable with BBD.PR.C – as it now “should” be, given that a three-notch downgrade will make the credit ratings identical.

Sometimes everything works … sometimes the trading works, but sectoral shifts overwhelm the increment … sometimes nothing works. The fund seeks to earn incremental return by selling liquidity (that is, taking the other side of trades that other market participants are strongly motivated to execute), which can also be referred to as ‘trading noise’. There were a lot of strongly motivated market participants during the Panic of 2007, generating a lot of noise! Unfortunately, the conditions of the Panic may never be repeated in my lifetime … but the fund will simply attempt to make trades when swaps seem profitable, without worrying about the level of monthly turnover.

There’s plenty of room for new money left in the fund. I have shown in recent issues of PrefLetter that market pricing for FixedResets is demonstrably stupid and I have lots of confidence – backed up by my bond portfolio management experience in the markets for Canadas and Treasuries, and equity trading on the NYSE & TSX – that there is enough demand for liquidity in any market to make the effort of providing it worthwhile (although the definition of “worthwhile” in terms of basis points of outperformance changes considerably from market to market!) I will continue to exert utmost efforts to outperform but it should be borne in mind that there will almost inevitably be periods of underperformance in the future.

The yields available on high quality preferred shares remain elevated, which is reflected in the current estimate of sustainable income.

Calculation of MAPF Sustainable Income Per Unit
Month NAVPU Portfolio
Average
YTW
Leverage
Divisor
Securities
Average
YTW
Capital
Gains
Multiplier
Sustainable
Income
per
current
Unit
June, 2007 9.3114 5.16% 1.03 5.01% 1.2857 0.3628
September 9.1489 5.35% 0.98 5.46% 1.2857 0.3885
December, 2007 9.0070 5.53% 0.942 5.87% 1.2857 0.4112
March, 2008 8.8512 6.17% 1.047 5.89% 1.2857 0.4672
June 8.3419 6.034% 0.952 6.338% 1.2857 $0.4112
September 8.1886 7.108% 0.969 7.335% 1.2857 $0.4672
December, 2008 8.0464 9.24% 1.008 9.166% 1.2857 $0.5737
March 2009 $8.8317 8.60% 0.995 8.802% 1.2857 $0.6046
June 10.9846 7.05% 0.999 7.057% 1.2857 $0.6029
September 12.3462 6.03% 0.998 6.042% 1.2857 $0.5802
December 2009 10.5662 5.74% 0.981 5.851% 1.0819 $0.5714
March 2010 10.2497 6.03% 0.992 6.079% 1.0819 $0.5759
June 10.5770 5.96% 0.996 5.984% 1.0819 $0.5850
September 11.3901 5.43% 0.980 5.540% 1.0819 $0.5832
December 2010 10.7659 5.37% 0.993 5.408% 1.0000 $0.5822
March, 2011 11.0560 6.00% 0.994 5.964% 1.0000 $0.6594
June 11.1194 5.87% 1.018 5.976% 1.0000 $0.6645
September 10.2709 6.10%
Note
1.001 6.106% 1.0000 $0.6271
October, 2011 10.4924 6.01%
Note
1.001 6.016% 1.0000 $0.6312
NAVPU is shown after quarterly distributions of dividend income and annual distribution of capital gains.
Portfolio YTW includes cash (or margin borrowing), with an assumed interest rate of 0.00%
The Leverage Divisor indicates the level of cash in the account: if the portfolio is 1% in cash, the Leverage Divisor will be 0.99
Securities YTW divides “Portfolio YTW” by the “Leverage Divisor” to show the average YTW on the securities held; this assumes that the cash is invested in (or raised from) all securities held, in proportion to their holdings.
The Capital Gains Multiplier adjusts for the effects of Capital Gains Dividends. On 2009-12-31, there was a capital gains distribution of $1.989262 which is assumed for this purpose to have been reinvested at the final price of $10.5662. Thus, a holder of one unit pre-distribution would have held 1.1883 units post-distribution; the CG Multiplier reflects this to make the time-series comparable. Note that Dividend Distributions are not assumed to be reinvested.
Sustainable Income is the resultant estimate of the fund’s dividend income per current unit, before fees and expenses. Note that a “current unit” includes reinvestment of prior capital gains; a unitholder would have had the calculated sustainable income with only, say, 0.9 units in the past which, with reinvestment of capital gains, would become 1.0 current units.
DeemedRetractibles are comprised of all Straight Perpetuals (both PerpetualDiscount and PerpetualPremium) issued by BMO, BNS, CM, ELF, GWO, HSB, IAG, MFC, NA, RY, SLF and TD, which are not exchangable into common at the option of the company (definition refined in May). These issues are analyzed as if their prospectuses included a requirement to redeem at par on or prior to 2022-1-31, in addition to the call schedule explicitly defined. See OSFI Does Not Grandfather Extant Tier 1 Capital, CM.PR.D, CM.PR.E, CM.PR.G: Seeking NVCC Status and the January, February, March and June, 2011, editions of PrefLetter for the rationale behind this analysis.
Yields for September, 2011, to October, 2011, were calculated by imposing a cap of 10% on the yields of YLO issues held, in order to avoid their extremely high calculated yields distorting the calculation and to reflect the uncertainty in the marketplace that these yields will be realized.

Significant positions were held in DeemedRetractible and FixedReset issues on August 31; all of the former and most of the latter currently have their yields calculated with the presumption that they will be called by the issuers at par prior to 2022-1-31. This presents another complication in the calculation of sustainable yield. The fund also holds a position in a SplitShare (BNA.PR.C) and an OperatingRetractible Scrap (YLO.PR.B) which also have their yields calculated with the expectation of a maturity at par, a somewhat dubious assumption in the latter case.

However, if the entire portfolio except for the PerpetualDiscounts were to be sold and reinvested in these issues, the yield of the portfolio would be the 5.98% shown in the MAPF Portfolio Composition: October 2011 analysis (which is greater than the 5.37% index yield on October). Given such reinvestment, the sustainable yield would be $10.4924 * 0.0598 = $0.6274, an increase from the $10.2709 * 0.0584 = $0.5998 reported in September.

Different assumptions lead to different results from the calculation, but the overall positive trend is apparent. I’m very pleased with the results! It will be noted that if there was no trading in the portfolio, one would expect the sustainable yield to be constant (before fees and expenses). The success of the fund’s trading is showing up in

  • the very good performance against the index
  • the long term increases in sustainable income per unit

As has been noted, the fund has maintained a credit quality equal to or better than the index; outperformance is due to constant exploitation of trading anomalies.

Again, there are no predictions for the future! The fund will continue to trade between issues in an attempt to exploit market gaps in liquidity, in an effort to outperform the index and keep the sustainable income per unit – however calculated! – growing.