Archive for April, 2012

April 5, 2012

Thursday, April 5th, 2012

Julie Dickson’s speech was not very interesting – just a shopping list of aspirations for a board. Of passing interest was:

This leads me to explain why OSFI’s draft guideline (B-20) on Sound Residential Mortgage Underwriting Practices and Procedures, which we made public on March 19th, begins with the statement that boards must establish real estate underwriting policies. In fact, most boards have already established such policies. This makes sense; housing is the largest asset class exposure of banks – almost 42 per cent of total bank assets.

While these policies will have to be updated to reflect the new guidance, going forward senior management will have to provide a declaration to the board that the financial institution is in compliance with the OSFI guideline. This was added because we had noticed cases where board approved polices were not being followed.

Seems to me that if I was on a board that set a policy and that policy was not followed, I’d simply ensure that somebody senior got fired at every board meeting until it did get followed. But perhaps that’s just another reason why I’m not on a big-shot board.

Another, related, reason is my antiquated idea that boards are in place to set policies and hire staff to carry them out. The modern view is that boards exist to provide jobs to unqualified women – despite that fact that it does not work:

A recent study released by the German central bank found that risk taking within the banking industry increases with more women on an executive board. The same goes for younger executives. In contrast, men who are graying at the temples and executives with Ph.D. degrees reduce the level of risk.

Tomorrow’s US jobs number is expected to be encouraging:

Employers probably added more than 200,000 workers to payrolls in March for a fourth straight month as U.S. companies gained confidence sales will keep improving, economists said before a government report today.

Hiring increased by 205,000 after rising by 227,000 in February, according to the median projection of 80 economists surveyed by Bloomberg News. The last time employment advanced at a similar pace for as many months was late 1999 into 2000. The jobless rate probably held at a three-year low of 8.3 percent.

Cowboys will have 45 minutes to settle their bets:

While stock markets around the world are shut for Good Friday, the Labor Department will publish its monthly employment report at 8:30 a.m. New York time. Equity traders will have 45 minutes to react, as trading of futures linked to the Standard & Poor’s 500 Index and Dow Jones Industrial Average will continue until 9:15 a.m. on CME Group Inc. (CME)’s Chicago Mercantile Exchange.

The Canadian jobs number was good:

Canada’s labour market has finally perked up after half a year in the doldrums as a commodities boom and a firmer U.S. economy give employers the confidence to hire.

The economy churned out 82,300 jobs last month, the most since 2008, with many of the positions created in full-time work. The hiring spree sent the country’s jobless rate down two notches to 7.2 per cent in March, matching the lowest rate seen in the recovery.

First National, proud issuer of FN.PR.A, was confirmed at Pfd-3 by DBRS:

DBRS has today confirmed the Senior Secured – Guaranteed Debt and Class A Preference Shares ratings of First National Financial Corporation (FNFC) at BBB and Pfd-3, respectively, and the Issuer Rating of First National Financial LP (FNFLP) at BBB; all trends remain Stable.

The ratings and trends reflect FNFC’s status as Canada’s largest non-bank mortgage originator, with just under $60 billion in mortgages under administration (MUA) as of December 31, 2011; its strong asset quality profile, with all assets secured by real estate and a substantial portion insured; and its high-quality, low-cost servicing capabilities.

The rating on FNFC’s Senior Secured – Guaranteed Debt is based on a senior guarantee from FNFLP and an Intercreditor Agreement between Computershare Trust Company of Canada as the debenture trustee and the lenders under a credit facility. The Intercreditor Agreement ranks the indebtedness created under the debentures equally and ratably with the indebtedness created under FNFLP’s credit facility.

It was another mixed day for the Canadian preferred share market, with PerpetualPremiums winning 13bp, FixedResets off 2bp and DeemedRetractibles gaining 11bp. Only one issue made it to the Performance Highlights table. Volume was pathetic.

HIMIPref™ Preferred Indices
These values reflect the December 2008 revision of the HIMIPref™ Indices

Values are provisional and are finalized monthly
Index Mean
Current
Yield
(at bid)
Median
YTW
Median
Average
Trading
Value
Median
Mod Dur
(YTW)
Issues Day’s Perf. Index Value
Ratchet 0.00 % 0.00 % 0 0.00 0 0.1329 % 2,417.6
FixedFloater 4.52 % 3.92 % 37,353 17.38 1 -0.0951 % 3,448.6
Floater 2.99 % 3.01 % 46,771 19.73 3 0.1329 % 2,610.4
OpRet 4.93 % 3.42 % 68,027 1.17 6 0.0451 % 2,499.6
SplitShare 5.25 % -4.84 % 85,019 0.70 4 -0.0890 % 2,693.0
Interest-Bearing 0.00 % 0.00 % 0 0.00 0 0.0451 % 2,285.7
Perpetual-Premium 5.48 % -3.53 % 89,888 0.16 23 0.1273 % 2,217.4
Perpetual-Discount 5.20 % 5.17 % 135,476 15.18 10 0.0946 % 2,401.6
FixedReset 5.02 % 2.99 % 186,121 2.21 67 -0.0155 % 2,392.0
Deemed-Retractible 4.96 % 3.88 % 201,950 2.02 46 0.1088 % 2,305.3
Performance Highlights
Issue Index Change Notes
PWF.PR.F Perpetual-Premium 1.14 % YTW SCENARIO
Maturity Type : Call
Maturity Date : 2012-05-05
Maturity Price : 25.00
Evaluated at bid price : 25.26
Bid-YTW : -11.38 %
Volume Highlights
Issue Index Shares
Traded
Notes
RY.PR.W Perpetual-Premium 86,210 Scotia crossed 45,000 at 25.40; TD crossed 25,000 at the same price. TD bought 11,000 from Nesbitt at 25.39.
YTW SCENARIO
Maturity Type : Call
Maturity Date : 2014-02-24
Maturity Price : 25.00
Evaluated at bid price : 25.36
Bid-YTW : 4.43 %
ENB.PR.H FixedReset 68,981 Recent new issue.
YTW SCENARIO
Maturity Type : Limit Maturity
Maturity Date : 2042-04-05
Maturity Price : 23.16
Evaluated at bid price : 25.20
Bid-YTW : 3.59 %
FTS.PR.F Perpetual-Premium 20,965 RBC crossed 10,000 at 25.12.
YTW SCENARIO
Maturity Type : Limit Maturity
Maturity Date : 2042-04-05
Maturity Price : 24.57
Evaluated at bid price : 25.10
Bid-YTW : 4.91 %
NA.PR.K Deemed-Retractible 20,945 YTW SCENARIO
Maturity Type : Call
Maturity Date : 2012-05-15
Maturity Price : 25.00
Evaluated at bid price : 25.60
Bid-YTW : -8.41 %
RY.PR.A Deemed-Retractible 20,430 YTW SCENARIO
Maturity Type : Call
Maturity Date : 2014-05-24
Maturity Price : 25.25
Evaluated at bid price : 25.48
Bid-YTW : 4.22 %
CM.PR.M FixedReset 20,300 RBC crossed 12,000 at 27.05.
YTW SCENARIO
Maturity Type : Call
Maturity Date : 2014-07-31
Maturity Price : 25.00
Evaluated at bid price : 27.01
Bid-YTW : 2.73 %
There were 12 other index-included issues trading in excess of 10,000 shares.
Wide Spread Highlights
Issue Index Quote Data and Yield Notes
BAM.PR.B Floater Quote: 17.71 – 19.00
Spot Rate : 1.2900
Average : 0.7519

YTW SCENARIO
Maturity Type : Limit Maturity
Maturity Date : 2042-04-05
Maturity Price : 17.71
Evaluated at bid price : 17.71
Bid-YTW : 2.98 %

BAM.PR.J OpRet Quote: 26.85 – 27.35
Spot Rate : 0.5000
Average : 0.3062

YTW SCENARIO
Maturity Type : Call
Maturity Date : 2014-03-31
Maturity Price : 26.00
Evaluated at bid price : 26.85
Bid-YTW : 3.52 %

TCA.PR.Y Perpetual-Premium Quote: 52.01 – 52.48
Spot Rate : 0.4700
Average : 0.3115

YTW SCENARIO
Maturity Type : Call
Maturity Date : 2014-03-05
Maturity Price : 50.00
Evaluated at bid price : 52.01
Bid-YTW : 3.21 %

SLF.PR.I FixedReset Quote: 25.25 – 25.60
Spot Rate : 0.3500
Average : 0.2686

YTW SCENARIO
Maturity Type : Call
Maturity Date : 2016-12-31
Maturity Price : 25.00
Evaluated at bid price : 25.25
Bid-YTW : 4.05 %

BAM.PR.G FixedFloater Quote: 21.01 – 21.59
Spot Rate : 0.5800
Average : 0.5029

YTW SCENARIO
Maturity Type : Limit Maturity
Maturity Date : 2042-04-05
Maturity Price : 21.80
Evaluated at bid price : 21.01
Bid-YTW : 3.92 %

SLF.PR.H FixedReset Quote: 24.15 – 24.40
Spot Rate : 0.2500
Average : 0.1810

YTW SCENARIO
Maturity Type : Hard Maturity
Maturity Date : 2022-01-31
Maturity Price : 25.00
Evaluated at bid price : 24.15
Bid-YTW : 4.25 %

CSE.PR.A Downgraded to P-4(high) by S&P

Thursday, April 5th, 2012

Standard & Poor’s has announced:

  • We are lowering our long-term corporate credit rating on Capstone Infrastructure Corp. to ‘BB+’ from ‘BBB-‘.
  • We are also lowering our global scale preferred stock rating on Capstone to ‘B+’ from ‘BB’, and our Canada scale preferred stock rating to ‘P-4(High)’ from ‘P-3’.
  • In addition, we are placing the ratings on the company on CreditWatch with developing implications.
  • The downgrade reflects our view that Capstone’s liquidity is ‘less-than-adequate’; as per our criteria, a company with ‘less-than-adequate’ liquidity cannot have a corporate credit rating higher than ‘BB+’.
  • We believe the CreditWatch resolution could result in a return to investment-grade status for Capstone.
  • Although we consider it unlikely, if the company is unable to either pay down or extend its C$119 million bank revolver maturing in June, a multinotch downgrade could occur.


Standard & Poor’s views the company’s revenues and cash flow from long-term power purchase agreements with provincial government agencies and investment-grade off-takers as stable. In addition, we believe there is a track record of sustained high availability and operating performance of Capstone’s generation assets. We believe that offsetting these strengths are modest asset and geographic diversity, recontracting risks for two of its material generating facilities, and our expectation that the company would increase debt in executing its growth strategy. Evidence of this includes the acquisition of Bristol Water Holdings UK Ltd. While we believe that this acquisition will help to stabilize revenue in the long term, its financing has challenged liquidity.

The company has outlined several initiatives to address its liquidity position. These include refinancing some of the hydro projects under MPT Hydro L.P. and using the net proceeds to reduce debt outstanding under the CPC facility; recapitalizing Varmevarden AB (a company, which Capstone purchased in March 2011, that owns and operates a portfolio of 11 district heating businesses in Sweden) and using proceeds to reduce the amount outstanding on the senior credit facility; and other options, including a new corporate credit facility. To date, the company has completed the Varmevarden refinancing and realized proceeds of approximately C$50 million, which it used to pay down a portion of the senior credit facility.

We believe the CreditWatch resolution, which we expect to come within the next 90 days, could result in a return to investment-grade status for Capstone. Although we consider it unlikely, if the company is unable to either pay down or extend its C$119 million bank revolver maturing in June, a multinotch downgrade could occur.

Capstone is not rated by DBRS. CSE.PR.A was last mentioned on PrefBlog when it dived following a common dividend warning. CSE.PR.A is tracked by HIMIPref™ but is relegated to the Scraps index on credit concerns.

Update, 2016-2-24: S&P later affirmed the company and revised the outlook to Stable from Positive:

    •We are also affirming our ratings on the company, including our ‘BB+’ long-term corporate credit rating.

  • •The outlook revision reflects our assessment of Capstone’s stable cash flow.
  • •In addition, Capstone has taken on some additional parent-level debt in conjunction with its purchase of Renewable Energy Developers Inc., which has negatively affected parent-level credit metrics.


The outlook revision reflects our view of Capstone’s stable, albeit reduced cash flow resulting from the new contract for its power plant at Cardinal, and the company’s continued cash flow that is commensurate with the ‘BB+’ rating.

“In addition, Capstone has taken on some additional parent-level debt in conjunction with its purchase of Renewable Energy Developers Inc., which has negatively affected parent-level credit metrics,” said Standard & Poor’s credit analyst Stephen Goltz.

April 4, 2012

Thursday, April 5th, 2012

There are rumours about Rona, too:

In corporate news, Rona Inc. (TSX:RON) has denied that the company is up for sale after stock in the home renovation retailer jumped more than 12 per cent in heavy trading Tuesday on the Toronto Stock Exchange.

The Quebec-based retailer issued the denial in response to movement in its stock after Robert Hull, chief financial officer of Lowe’s Companies Inc., said his U.S.-based rival might be interested if Rona put itself up for sale. On Wednesday, Rona shares lost 42 cents, or four per cent, to $10.06.

The pain in Spain is starting to gain:

Prime Minister Mariano Rajoy said Spain’s situation is one of “extreme difficulty” and signaled that his budget cuts are less painful than a bailout would be, as demand for the nation’s debt slumped at an auction.

Spain sold 2.59 billion euros ($3.4 billion) of bonds today, just above the minimum amount it planned for the auction and below the 3.5 billion-euro maximum target. The average yield on the bonds due in October 2016, which act as the five-year benchmark, rose to 4.319 percent from 3.376 percent at last month’s sale. Secondary-market yields rose to 4.48 percent.

Spain’s 10-year borrowing costs are approaching the levels seen in December, before the European Central Bank said it would make unlimited three-year loans to bank.

The BoC has published a paper by Bruno Feunou, Jean-Sébastien Fontaine, Abderrahim Taamouti and Roméo Tédongap titled Risk Premium, Variance Premium and the Maturity Structure of Uncertainty:

Expected returns vary when investors face time-varying investment opportunities. Longrun risk models (Bansal and Yaron 2004) and no-arbitrage affine models (Duffie, Pan, and Singleton 2000) emphasize sources of risk that are not observable to the econometrician. We show that, for both classes of models, the term structure of risk
implicit in option prices can reveal these risk factors ex-ante. Empirically, we construct the variance term structure implied in SP500 option prices. The variance term structure reveal two important drivers of the bond premium, the equity premium, and the variance premium, jointly. We also consider the term structure of higher-order risks as measured by skewness and kurtosis and still find that two factors are sufficient to summarize the information content from the term structure of risks. Overall, our results bode well for the ability of structural models to explain risk-returns trade-offs across different markets using only very few sources of risk.

Somebody complained to me today that they were getting spam from my company domain, himivest.com. So I found a good article about eMail spoofing:

When this simplistic method is used, you can tell where the mail originated (for example, that it did not come from thewhitehouse.com) by checking the actual mail headers. Many e-mail clients don’t show these by default. In Outlook, open the message and then click View | Options to see the headers, as shown in Figure 3.

In this example, you can see that the message actually originated from a computer named XDREAM and was sent from the mail.augustmail.com SMTP server.

Unfortunately, even the headers don’t always tell you the truth about where the message came from. Spammers and other spoofers often use open relays to send their bogus or malicious messages. An open relay is an SMTP server that is not correctly configured and so allows third-parties to send e-mail through it that is not sent from nor to a local user. In that case, the “Received from” field in the header only points you to the SMTP server that was victimized.

BAM issued ten year CAD notes at 3.95% to pay off a maturing USD obligation.

Enbridge Gas Distribution, proud issuer of ENB.PR.A, ENB.PR.B, ENB.PR.D, ENB.PR.F and ENB.PR.H, was confirmed at Pfd-2(low) by DBRS:

DBRS has today confirmed the Unsecured Debentures & Medium-Term Notes, Commercial Paper, and Cumulative & Cumulative Redeemable Convertible Preferred Share ratings of Enbridge Gas Distribution Inc. (EGD or the Company) at “A”, R-1 (low) and Pfd-2 (low), respectively, all with Stable trends. The rating confirmation is based on EGD’s low business risk operations, stable regulatory environment in Ontario, strong franchise area and stable financial profile.

EGD’s financial profile remained stable in 2011, with all credit metrics being commensurate with DBRS’s “A” rating guidelines. DBRS notes that the Company requires significant liquidity to finance working capital (mostly gas inventory for winter distributions). Given the low gas price environment, EGD’s liquidity remains adequate to meet its operational needs. Over the medium term, moderate cash flow deficits are expected, due to a large capex program. However, EGD’s current debt leverage is well below the regulatory capital structure of 36% equity, providing EGD with significant financial flexibility. DBRS expects the Company to remain prudent in funding its cash shortfalls and maintaining its credit metrics within the “A” rating category. In August 2011, the Company financed its $66 million acquisition of 15-megawatt (MW) solar power assets from its parent, Enbridge Inc., with equity, which was viewed as positive to the financial profile.

It was a mixed day for the Canadian preferred share market, with PerpetualPremiums flat, FixedResets gaining 9bp and DeemedRetractibles down 3bp. Volatility was low. Volume was slightly below average.

PerpetualDiscounts now yield 5.17%, equivalent to 6.72% interest at the current conversion factor of 1.3x. Long corporates now yield about 4.6%, so the pre-tax interest-equivalent spread (in this context, the “Seniority Spread”) is now about 215bp, a dramatic drop from the 230bp reported March 30.

HIMIPref™ Preferred Indices
These values reflect the December 2008 revision of the HIMIPref™ Indices

Values are provisional and are finalized monthly
Index Mean
Current
Yield
(at bid)
Median
YTW
Median
Average
Trading
Value
Median
Mod Dur
(YTW)
Issues Day’s Perf. Index Value
Ratchet 0.00 % 0.00 % 0 0.00 0 -0.5476 % 2,414.4
FixedFloater 4.52 % 3.91 % 38,876 17.39 1 -2.1860 % 3,451.9
Floater 2.99 % 3.00 % 46,437 19.76 3 -0.5476 % 2,606.9
OpRet 4.93 % 3.59 % 66,569 1.20 6 0.1614 % 2,498.5
SplitShare 5.24 % -5.34 % 86,294 0.70 4 0.0099 % 2,695.4
Interest-Bearing 0.00 % 0.00 % 0 0.00 0 0.1614 % 2,284.6
Perpetual-Premium 5.46 % 1.37 % 90,986 0.16 23 -0.0008 % 2,214.6
Perpetual-Discount 5.19 % 5.17 % 134,456 15.10 10 0.1120 % 2,399.3
FixedReset 5.02 % 2.98 % 191,208 2.20 67 0.0942 % 2,392.3
Deemed-Retractible 4.97 % 3.88 % 205,549 2.02 46 -0.0315 % 2,302.8
Performance Highlights
Issue Index Change Notes
BAM.PR.G FixedFloater -2.19 % YTW SCENARIO
Maturity Type : Limit Maturity
Maturity Date : 2042-04-04
Maturity Price : 21.81
Evaluated at bid price : 21.03
Bid-YTW : 3.91 %
BAM.PR.B Floater -1.40 % YTW SCENARIO
Maturity Type : Limit Maturity
Maturity Date : 2042-04-04
Maturity Price : 17.60
Evaluated at bid price : 17.60
Bid-YTW : 2.99 %
TD.PR.P Deemed-Retractible 1.20 % YTW SCENARIO
Maturity Type : Call
Maturity Date : 2012-11-01
Maturity Price : 26.00
Evaluated at bid price : 26.59
Bid-YTW : 0.48 %
Volume Highlights
Issue Index Shares
Traded
Notes
TD.PR.O Deemed-Retractible 118,797 Desjardins crossed blocks of 48,200 and 30,400, both at 26.00. TD crossed 30,000 at the same price.
YTW SCENARIO
Maturity Type : Call
Maturity Date : 2012-05-04
Maturity Price : 25.75
Evaluated at bid price : 25.78
Bid-YTW : -0.79 %
RY.PR.W Perpetual-Premium 78,659 Nesbitt sold 10,000 to TD at 25.41, then sold blocks o 10,000 and 19,800 to Scotia at 25.40, and finally crossed 29,700 at 25.40.
YTW SCENARIO
Maturity Type : Call
Maturity Date : 2014-02-24
Maturity Price : 25.00
Evaluated at bid price : 25.38
Bid-YTW : 4.38 %
ENB.PR.H FixedReset 63,030 Recent new issue.
YTW SCENARIO
Maturity Type : Limit Maturity
Maturity Date : 2042-04-04
Maturity Price : 23.14
Evaluated at bid price : 25.15
Bid-YTW : 3.60 %
BMO.PR.M FixedReset 55,160 TD crossed 48,500 at 26.05.
YTW SCENARIO
Maturity Type : Call
Maturity Date : 2013-08-25
Maturity Price : 25.00
Evaluated at bid price : 25.96
Bid-YTW : 2.60 %
RY.PR.D Deemed-Retractible 48,675 Desjardins crossed 40,000 at 25.79.
YTW SCENARIO
Maturity Type : Call
Maturity Date : 2016-02-24
Maturity Price : 25.00
Evaluated at bid price : 25.70
Bid-YTW : 3.88 %
RY.PR.B Deemed-Retractible 47,630 Desjardins crossed 40,000 at 26.12.
YTW SCENARIO
Maturity Type : Call
Maturity Date : 2012-08-24
Maturity Price : 25.75
Evaluated at bid price : 26.02
Bid-YTW : 3.19 %
There were 27 other index-included issues trading in excess of 10,000 shares.
Wide Spread Highlights
Issue Index Quote Data and Yield Notes
BAM.PR.G FixedFloater Quote: 21.03 – 21.60
Spot Rate : 0.5700
Average : 0.4184

YTW SCENARIO
Maturity Type : Limit Maturity
Maturity Date : 2042-04-04
Maturity Price : 21.81
Evaluated at bid price : 21.03
Bid-YTW : 3.91 %

GWO.PR.M Deemed-Retractible Quote: 26.04 – 26.55
Spot Rate : 0.5100
Average : 0.4202

YTW SCENARIO
Maturity Type : Hard Maturity
Maturity Date : 2022-01-31
Maturity Price : 25.00
Evaluated at bid price : 26.04
Bid-YTW : 5.30 %

BNS.PR.K Deemed-Retractible Quote: 25.55 – 25.84
Spot Rate : 0.2900
Average : 0.2091

YTW SCENARIO
Maturity Type : Call
Maturity Date : 2012-05-28
Maturity Price : 25.50
Evaluated at bid price : 25.55
Bid-YTW : 1.29 %

IGM.PR.B Perpetual-Premium Quote: 26.25 – 26.70
Spot Rate : 0.4500
Average : 0.3759

YTW SCENARIO
Maturity Type : Call
Maturity Date : 2018-12-31
Maturity Price : 25.00
Evaluated at bid price : 26.25
Bid-YTW : 4.98 %

SLF.PR.I FixedReset Quote: 25.35 – 25.60
Spot Rate : 0.2500
Average : 0.1793

YTW SCENARIO
Maturity Type : Call
Maturity Date : 2016-12-31
Maturity Price : 25.00
Evaluated at bid price : 25.35
Bid-YTW : 3.95 %

IAG.PR.C FixedReset Quote: 26.36 – 26.65
Spot Rate : 0.2900
Average : 0.2233

YTW SCENARIO
Maturity Type : Call
Maturity Date : 2013-12-31
Maturity Price : 25.00
Evaluated at bid price : 26.36
Bid-YTW : 3.02 %

YLO: The Jostling Starts, the Rumours Swirl

Wednesday, April 4th, 2012

There are rumours of restructuring jostling at YLO:

Yellow Media’s creditors want to take over the troubled phone directory company in a bid to salvage their investments.

The company’s senior-ranking bondholders organized a call last week to discuss a plan to encourage the company to restructure through the Canadian Business Corporations Act, according to a bondholder who participated in the call. The result would be a debt-for-equity swap that would give the bondholders ownership control.

There’s more colour in a later story:

“If, for some reason, we get paid in equity, it’s never optimal, but it’s probably acceptable because it’s got a value,” said Paul Gardner, a portfolio manager at Avenue Investment Management who participated in the bondholder discussions.

They also believe that it is better to put together a plan before the Montreal company hits a financial wall. “It’s much better to have everything in place in an orderly restructuring than putting a gun to the debt holders’ heads,” Mr. Gardner said, adding that it can get “nasty in court.”

Other investors, however, are skeptical. Glen Bradford, chief executive officer of ARM Holdings, which holds about 250,000 of the company’s preferred shares, said bondholders “purposefully” leaked news of their meetings to increase the value of their holdings.

“As an equity holder, I am still failing to see how the creditors have any say in the matter as long as the company continues to meet its debt obligations as they come due,” Mr. Bradford said.

After analyzing the company’s finances under several scenarios, RBC Dominion Securities analyst Andrew Calder determined that it would be able to pay its debts through 2013. By 2014, however, he said the company would likely need to refinance to meet its obligations.

There doesn’t seem to be much on the web about Glen Bradford or ARM Holdings by way of performance numbers, but I dug up his resume. Avenue Investment Management commented in their latest performance report:

Another reason for the relative underperformance of the Avenue Bond portfolio was our exposure to Yellow Media Bonds. However, we still believe that we will earn an enhanced rate of return between now and maturity in 2015. We believe that over the long term the $500-$600 million of earnings before interest and taxes (EBIT) they make per year will allow them to pay down debt more quickly which should result in a higher valuation for the bond.

Avenue Investment makes GIPS compliant composites available on request, which is a good sign, but are a bit shy regarding putting numbers on the web.

It’s way too early to draw any conclusions regarding the status of preferred shares in a restructuring, but the mention of using the Canadian Business Corporations Act implies a few things:

  • They’re not thinking of a debt-for-equity swap alone (e.g., a tender) as that wouldn’t require judicial involvement
  • the plans involve the rights of the preferred shareholders
  • Preferred shareholders will get a vote

Norton Rose points out:

In Mega Brands, the company sought to restructure the company’s debt while injecting $225 million in new capital by public and private financing. In exchange for their consent, guaranteed creditors, debentureholders and shareholders were to receive a
combination of cash payments, shares in a new Mega Brands company and warrants.

In Mega Brands, the Court’s reasoning was twofold. First, it had no issue with the applicant utilizing a section 192 CBCA arrangement to transfer the quasi-totality of property from one company to another, as this is commonly done under CBCA plans of arrangement. Second, relying on a Policy Statement of Industry Canada” and on judicial precedents (including Abitibi), the Court concluded that section 192 of the CBCA was an appropriate way to restructure debt.

Second, the company seeking an arrangement must not be insolvent.

In Mega Brands, the Court found that the arrangement was fair and reasonable. Specifically, the Court pointed out the following factors as evidence that the arrangement was fair and reasonable:” a fair negotiation process took place; an independent committee of the I3oard of Directors was appointed; a fairness opinion was rendered by a reputable financial institution stating that the arrangement was fair, from a financial point of view,
to Mega and the shareholders, and that the holders of secured debt and convertible debentures and the shareholders would be in a better financial position under the recapitalization than if Mega were liquidated; the Board of Directors unanimously approved and recommended the arrangement; the full disclosure of the arrangement was set out in the circular; approval was given by the shareholders and lenders as required by the interim order; and finally, no one filed a Notice of Appearance or contestation with respect to the final order hearing.

I pointed out to a journalist today that YLO.PR.A and YLO.PR.B can be converted to common at the option of company without getting any permissions at all, judicial or otherwise – and if I was a debt-holder, I would make such a conversion a pre-condition of any arrangement. YLO.PR.C and YLO.PR.D holders are in a better position to negotiate.

And, of course, there is no guarantee that the company will even talk to the bondholder group, or that any proposal will be made to security holders if they do talk.

April 3, 2012

Wednesday, April 4th, 2012

The David Berry saga continues to drag on:

A hearing was originally scheduled before a Hearing Panel of the Investment Industry Regulatory Organization of Canada (IIROC), in the matter of David Berry for April 10 to April 23, 2012. The hearing was adjourned to June 13, 2012.

The hearing concerns allegations that Mr. Berry solicited client orders during the distribution of new issues by Scotia Capital contrary to UMIR 7.7(5) (as it existed prior to May 2005), and conducted off-marketplace trades that were not printed on a marketplace or recognized exchange as required by UMIR 6.4.

Assiduous Readers will remember that David Berry was a superb trader of preferred shares, who was assigned significant capital by Scotia at a time when the market was starved for liquidity. He made ridiculous potfulls of money for the bank and in so doing, a pretty good pile for himself. The bank’s executives got upset that a mere peon was making so much and, when he wouldn’t accept a voluntary pay cut, unleashed an army of accountants and lawyers on his trading to uncover instances where a rule had been broken – I have also heard that clients were swept up in this witchhunt and required to cooperate voluntarily with the investigation as a condition of doing business with Scotia.

Naturally, they found a few picayune transgressions, pretended to be shocked and fired him. He’s suing for $100-million. IIROC is an eager participant in this charade.

Royal Bank is scooping up full control of RBC-Dexia:

Royal Bank of Canada (RY-T57.04-1.70-2.89%) is buying the 50-per-cent stake in RBC Dexia Investor Services that it doesn’t already own from its struggling European partner.

Canada’s largest bank said Tuesday morning it will purchase the 50 per cent stake of RBC Dexia partnership from Banque Internationale à Luxembourg SA for $1.1-billion in cash.

The deal will give RBC full control of the European business, which advises institutional investors and administers large pensions and investment funds. The assets went on the block last year when Banque Internationale à Luxembourg, formerly known as Dexia Banque Internationale, was hit hard by the European banking crisis and forced to jettison assets to stabilize its operations.

DBRS comments:

RBC will take an after-tax charge of approximately $200 million, with $170 million (after tax) of that owing primarily to a write-down of intangibles as a result of revaluing the 50% of RBC Dexia that is already owns. The other $30 million (after tax) represents RBC’s share of a loss related to an exchange of securities at RBC Dexia.

Courtesy of the US housing market, here’s another illustration of the law of unintended consequences:

As many as 1.25 million of America’s least cared for homes are headed for auction after a year-long probe into foreclosure practices kept them off the market.

Sales of repossessed properties probably will rise 25 percent this year from 1 million in 2011, according to Moody’s Analytics Inc. Prices for the homes could drop as much as 10 percent because they deteriorated as they were held in reserve during investigations by state officials resolved in February, according to RealtyTrac Inc. That month, 43 percent of foreclosures were delinquent for two or more years, from a 21 percent share in 2010, according to Lender Processing Services Inc. in Jacksonville, Florida.

Homes stockpiled less than a year sell for about 35 percent below the value set by lenders, according to a March 15 report by the Federal Reserve Bank of Cleveland. At two years, the loss is close to 60 percent.

The Fed’s confidence in the US economy is increasing:

The Federal Reserve is holding off on increasing monetary accommodation unless the U.S. economic expansion falters or prices rise at a rate slower than its 2 percent target.

“A couple of members indicated that the initiation of additional stimulus could become necessary if the economy lost momentum or if inflation seemed likely to remain below” 2 percent, according to minutes of their March 13 meeting released today in Washington. That contrasts with the assessment at the FOMC’s January meeting in which some Fed officials saw current conditions warranting additional action “before long.”

There are many pairs of words that, when seen in the same sentence, alert the reader that some insane logic based on infantile assumptions is about to result in nonsensical verbiage. One such pair is “Privacy” and “Commissioner”. Another is “Internet” and “Regulators”:

Google Inc. (GOOG), owner of the world’s most-popular search engine, misled Australian consumers in 2007 by including paid advertisements from competitors in search results for businesses, an appeal court ruled.

The Federal Court of Appeal in Sydney today overturned a lower court decision and ordered the Mountain View, California- based company to set up a protocol to avoid repeating the practice.

The ACCC appealed, citing four advertisements, including those that showed up in a search for the Australian company Harvey World Travel, that it said Google should have known would contravene the law.

A search for a business name would include results from competitors who paid to have their ads placed in a column beside the search results.

A user who sought information about Harvey World Travel was instead given the web address of one of its competitors, the panel said.

“Google tells the user that the URL provided below is the contact information about Harvey World Travel,” the panel wrote. “The enquiry is made of Google and it is Google’s response which is misleading.”

So my question is: why does it matter whether Google’s respons is misleading, assuming that a rational person would consider it misleading, which is by no means obvious? The user isn’t paying Google anything for the service, zip, zero, zilch! How does Google owe some kind of duty to the user? As far as I’m concerned, Google can answer queries of any type with pictures of naked women without breaching any duty; if they aren’t pretty enough, I’ll use a different search engine.

If any user of the Internet can run crying boo-hoo-hoo to the courts to get something fixed – and, doubtless, to get some kind of pecuniary benefit out of the whimpering – I’ve got a long list of websites that I know contain demonstrably false statements about preferred shares …

It was another positive day for the Canadian preferred share market, with PerpetualPremiums up 10bp, and both FixedResets and DeemedRetractibles gaining 12bp. Volatility was good, but surprisingly skewed to the downside. Volume was low.

HIMIPref™ Preferred Indices
These values reflect the December 2008 revision of the HIMIPref™ Indices

Values are provisional and are finalized monthly
Index Mean
Current
Yield
(at bid)
Median
YTW
Median
Average
Trading
Value
Median
Mod Dur
(YTW)
Issues Day’s Perf. Index Value
Ratchet 0.00 % 0.00 % 0 0.00 0 -0.3950 % 2,427.7
FixedFloater 4.42 % 3.83 % 38,772 17.59 1 -0.0465 % 3,529.0
Floater 2.97 % 3.00 % 46,933 19.76 3 -0.3950 % 2,621.3
OpRet 4.94 % 3.89 % 67,518 1.20 6 -0.1611 % 2,494.5
SplitShare 5.24 % -5.32 % 87,088 0.70 4 0.3525 % 2,695.1
Interest-Bearing 0.00 % 0.00 % 0 0.00 0 -0.1611 % 2,281.0
Perpetual-Premium 5.46 % 1.10 % 92,358 0.16 23 0.0994 % 2,214.6
Perpetual-Discount 5.19 % 5.21 % 136,524 15.12 10 0.2246 % 2,396.6
FixedReset 5.01 % 3.01 % 190,426 2.22 67 0.1175 % 2,390.1
Deemed-Retractible 4.96 % 3.93 % 206,753 2.02 46 0.1164 % 2,303.6
Performance Highlights
Issue Index Change Notes
IGM.PR.B Perpetual-Premium -1.42 % YTW SCENARIO
Maturity Type : Call
Maturity Date : 2018-12-31
Maturity Price : 25.00
Evaluated at bid price : 26.35
Bid-YTW : 4.90 %
ELF.PR.F Perpetual-Discount -1.30 % YTW SCENARIO
Maturity Type : Limit Maturity
Maturity Date : 2042-04-03
Maturity Price : 23.97
Evaluated at bid price : 24.26
Bid-YTW : 5.47 %
BAM.PR.X FixedReset -1.08 % YTW SCENARIO
Maturity Type : Limit Maturity
Maturity Date : 2042-04-03
Maturity Price : 23.04
Evaluated at bid price : 24.70
Bid-YTW : 3.58 %
BAM.PR.C Floater -1.07 % YTW SCENARIO
Maturity Type : Limit Maturity
Maturity Date : 2042-04-03
Maturity Price : 17.55
Evaluated at bid price : 17.55
Bid-YTW : 3.00 %
MFC.PR.B Deemed-Retractible -1.02 % YTW SCENARIO
Maturity Type : Hard Maturity
Maturity Date : 2022-01-31
Maturity Price : 25.00
Evaluated at bid price : 23.31
Bid-YTW : 5.61 %
SLF.PR.G FixedReset 1.02 % YTW SCENARIO
Maturity Type : Hard Maturity
Maturity Date : 2022-01-31
Maturity Price : 25.00
Evaluated at bid price : 24.87
Bid-YTW : 3.51 %
BAM.PR.M Perpetual-Discount 1.02 % YTW SCENARIO
Maturity Type : Limit Maturity
Maturity Date : 2042-04-03
Maturity Price : 22.48
Evaluated at bid price : 22.85
Bid-YTW : 5.21 %
BAM.PR.N Perpetual-Discount 1.33 % YTW SCENARIO
Maturity Type : Limit Maturity
Maturity Date : 2042-04-03
Maturity Price : 22.45
Evaluated at bid price : 22.80
Bid-YTW : 5.22 %
Volume Highlights
Issue Index Shares
Traded
Notes
ENB.PR.H FixedReset 167,400 Recent new issue
YTW SCENARIO
Maturity Type : Limit Maturity
Maturity Date : 2042-04-03
Maturity Price : 23.13
Evaluated at bid price : 25.10
Bid-YTW : 3.61 %
ELF.PR.H Perpetual-Discount 124,756 Recent new issue
YTW SCENARIO
Maturity Type : Limit Maturity
Maturity Date : 2042-04-03
Maturity Price : 24.59
Evaluated at bid price : 24.98
Bid-YTW : 5.52 %
BAM.PF.A FixedReset 55,895 Recent new issue
YTW SCENARIO
Maturity Type : Limit Maturity
Maturity Date : 2042-04-03
Maturity Price : 23.14
Evaluated at bid price : 25.15
Bid-YTW : 4.33 %
ENB.PR.D FixedReset 37,485 TD crosssed 27,000 at 25.54.
YTW SCENARIO
Maturity Type : Call
Maturity Date : 2018-03-01
Maturity Price : 25.00
Evaluated at bid price : 25.52
Bid-YTW : 3.69 %
BAM.PR.H OpRet 29,090 Called for redemption.
YTW SCENARIO
Maturity Type : Option Certainty
Maturity Date : 2012-05-03
Maturity Price : 25.00
Evaluated at bid price : 24.99
Bid-YTW : 6.72 %
PWF.PR.I Perpetual-Premium 28,806 RBC crossed 23,900 at 25.90.
YTW SCENARIO
Maturity Type : Call
Maturity Date : 2012-05-30
Maturity Price : 25.00
Evaluated at bid price : 25.66
Bid-YTW : -4.04 %
There were 20 other index-included issues trading in excess of 10,000 shares.
Wide Spread Highlights
Issue Index Quote Data and Yield Notes
ENB.PR.B FixedReset Quote: 25.29 – 25.74
Spot Rate : 0.4500
Average : 0.3145

YTW SCENARIO
Maturity Type : Limit Maturity
Maturity Date : 2042-04-03
Maturity Price : 23.24
Evaluated at bid price : 25.29
Bid-YTW : 3.79 %

PWF.PR.H Perpetual-Premium Quote: 25.41 – 25.76
Spot Rate : 0.3500
Average : 0.2527

YTW SCENARIO
Maturity Type : Call
Maturity Date : 2012-05-03
Maturity Price : 25.00
Evaluated at bid price : 25.41
Bid-YTW : -1.86 %

TD.PR.C FixedReset Quote: 26.56 – 26.81
Spot Rate : 0.2500
Average : 0.1544

YTW SCENARIO
Maturity Type : Call
Maturity Date : 2014-01-31
Maturity Price : 25.00
Evaluated at bid price : 26.56
Bid-YTW : 2.65 %

TD.PR.S FixedReset Quote: 26.05 – 26.29
Spot Rate : 0.2400
Average : 0.1522

YTW SCENARIO
Maturity Type : Call
Maturity Date : 2013-07-31
Maturity Price : 25.00
Evaluated at bid price : 26.05
Bid-YTW : 2.46 %

RY.PR.H Deemed-Retractible Quote: 26.92 – 27.20
Spot Rate : 0.2800
Average : 0.2105

YTW SCENARIO
Maturity Type : Call
Maturity Date : 2013-05-24
Maturity Price : 26.00
Evaluated at bid price : 26.92
Bid-YTW : 2.78 %

GWO.PR.M Deemed-Retractible Quote: 26.00 – 26.39
Spot Rate : 0.3900
Average : 0.3217

YTW SCENARIO
Maturity Type : Hard Maturity
Maturity Date : 2022-01-31
Maturity Price : 25.00
Evaluated at bid price : 26.00
Bid-YTW : 5.31 %

EMA.PR.A: DBRS Assigns Negative Trend

Wednesday, April 4th, 2012

DBRS has announced that it:

has today confirmed Emera Inc.’s (Emera or Holdco) Medium-Term Notes rating and Cumulative Preferred Shares rating at BBB (high) and Pfd-3 (high), respectively, and changed the trends on both to Negative from Stable. Emera’s ratings continue to be supported by strong and stable operating cash flows generated by its relatively low-risk regulated subsidiaries. Dividends and interest income flowing up from its operating subsidiaries continue to cover Emera’s interest and operating costs.

However, the Negative trend reflects DBRS’s concern regarding the ongoing high degree of non-consolidated leverage at the Holdco level for the current rating. On a non-consolidated basis, the debt-to-capital ratio has continued to deteriorate since 2008 and remains at approximately 40% as at December 31, 2011. DBRS acknowledges that a significant portion of the debt at the Holdco level was used to fund acquisitions of contracted/regulated assets that add diversification to Emera’s business profile. Going forward, the balance sheet could be further pressured by funding requirements for other regulated capital expenditures, the proposed Maritime Link Transmission Project, a subsea transmission link from Newfoundland to Nova Scotia that is 100% owned by Emera, and Emera’s 29% interest in the transmission link between the island of Newfoundland and Labrador.

Resolution of the Negative trend in the coming months will follow a full assessment of Emera’s plans to reduce its non-consolidated debt to levels commensurate with its current rating and its overall financing strategy on proposed projects in the next five years.

This follows a similar announcement from S&P.

April 2, 2012

Tuesday, April 3rd, 2012

OSFI has announced:

The Superintendent of Financial Institutions, Julie Dickson, will deliver remarks on the topic of boards and risk governance at the Toronto Board of Trade on Thursday, April 5th.

The Superintendent will address the role of corporate governance in managing risk and elements that make for strong, transparent and accountable boards of directors.

The Superintendent will be available to respond to questions from the news media following her remarks.

I can’t remember anything like this before – it’s a great departure from OSFI’s tradition of secrecy. It could be a major announcement, for all the preciousness of the topic. Who knows? Maybe they will announce that regulated companies can no longer hire senior civil servants within five years of their leaving government service – but knowing OSFI, it’s more likely to be the other way around.

This is the future of retail:

A new front in virtual retailing has emerged on a wall at a busy subway station in downtown Toronto.

An online health and beauty retailer on Monday launched a pop-up store at a key commuter hub that features images of Pampers diapers and Tide detergent, rather than the products themselves. Using a smartphone app, shoppers place their orders by scanning quick response codes – QR codes, for short – on pictures of products, which are then shipped, often as quickly as the next day, to customers free of charge.

My quibble is that displaying images only makes it no different from shopping on-line. I think this kind of thing needs samples to look at and touch – and as soon as those store move in, the big box is dead:

After 50 years of putting mom and pops out of business, big-box retail is having a mid-life crisis. A slow economy has hurt same-store sales, narrowing margins at big stores. Meanwhile, consumers, armed with price-comparison technology, are visiting more stores seeking deals or exclusive merchandise rather than making one-stop, fill-the-cart excursions.

It was a good day for the Canadian preferred share market, with PerpetualPremiums gaining 22bp, FixedResets up 22bp and DeemedRetractibles winning 26bp. The Performance Highlights table is well populated and uniformly positive. Volume was very light.

HIMIPref™ Preferred Indices
These values reflect the December 2008 revision of the HIMIPref™ Indices

Values are provisional and are finalized monthly
Index Mean
Current
Yield
(at bid)
Median
YTW
Median
Average
Trading
Value
Median
Mod Dur
(YTW)
Issues Day’s Perf. Index Value
Ratchet 0.00 % 0.00 % 0 0.00 0 1.5858 % 2,437.3
FixedFloater 4.42 % 3.83 % 39,100 17.60 1 2.4286 % 3,530.7
Floater 2.96 % 2.97 % 45,490 19.83 3 1.5858 % 2,631.7
OpRet 4.93 % 3.60 % 67,265 1.18 6 0.0645 % 2,498.5
SplitShare 5.26 % -4.12 % 87,798 0.70 4 0.0298 % 2,685.6
Interest-Bearing 0.00 % 0.00 % 0 0.00 0 0.0645 % 2,284.6
Perpetual-Premium 5.47 % 1.79 % 91,013 0.17 23 0.2197 % 2,212.4
Perpetual-Discount 5.20 % 5.26 % 138,596 15.04 10 0.3961 % 2,391.3
FixedReset 5.02 % 3.01 % 192,856 2.22 67 0.2177 % 2,387.3
Deemed-Retractible 4.97 % 3.93 % 205,956 3.08 46 0.2575 % 2,300.9
Performance Highlights
Issue Index Change Notes
FTS.PR.H FixedReset 1.06 % YTW SCENARIO
Maturity Type : Limit Maturity
Maturity Date : 2042-04-02
Maturity Price : 23.59
Evaluated at bid price : 25.75
Bid-YTW : 2.92 %
BAM.PR.X FixedReset 1.09 % YTW SCENARIO
Maturity Type : Limit Maturity
Maturity Date : 2042-04-02
Maturity Price : 23.14
Evaluated at bid price : 24.97
Bid-YTW : 3.52 %
PWF.PR.P FixedReset 1.33 % YTW SCENARIO
Maturity Type : Limit Maturity
Maturity Date : 2042-04-02
Maturity Price : 23.55
Evaluated at bid price : 25.95
Bid-YTW : 3.11 %
BAM.PR.B Floater 1.36 % YTW SCENARIO
Maturity Type : Limit Maturity
Maturity Date : 2042-04-02
Maturity Price : 17.84
Evaluated at bid price : 17.84
Bid-YTW : 2.95 %
CIU.PR.A Perpetual-Discount 1.41 % YTW SCENARIO
Maturity Type : Limit Maturity
Maturity Date : 2042-04-02
Maturity Price : 24.11
Evaluated at bid price : 24.40
Bid-YTW : 4.75 %
BAM.PR.K Floater 1.44 % YTW SCENARIO
Maturity Type : Limit Maturity
Maturity Date : 2042-04-02
Maturity Price : 17.59
Evaluated at bid price : 17.59
Bid-YTW : 3.00 %
BAM.PR.C Floater 1.95 % YTW SCENARIO
Maturity Type : Limit Maturity
Maturity Date : 2042-04-02
Maturity Price : 17.74
Evaluated at bid price : 17.74
Bid-YTW : 2.97 %
BAM.PR.G FixedFloater 2.43 % YTW SCENARIO
Maturity Type : Limit Maturity
Maturity Date : 2042-04-02
Maturity Price : 22.33
Evaluated at bid price : 21.51
Bid-YTW : 3.83 %
IGM.PR.B Perpetual-Premium 2.81 % YTW SCENARIO
Maturity Type : Call
Maturity Date : 2014-12-31
Maturity Price : 26.00
Evaluated at bid price : 26.73
Bid-YTW : 4.43 %
Volume Highlights
Issue Index Shares
Traded
Notes
ELF.PR.H Perpetual-Discount 426,481 New issue settled today.
YTW SCENARIO
Maturity Type : Limit Maturity
Maturity Date : 2042-04-02
Maturity Price : 24.59
Evaluated at bid price : 24.98
Bid-YTW : 5.52 %
HSE.PR.A FixedReset 226,100 Desjardins crossed 24,700 at 25.92, then blocks of 100,000 and 65,000 at 25.95. Nesbitt crossed 20,000 at 25.95.
YTW SCENARIO
Maturity Type : Limit Maturity
Maturity Date : 2042-04-02
Maturity Price : 23.53
Evaluated at bid price : 25.93
Bid-YTW : 3.18 %
ENB.PR.H FixedReset 104,049 Recent new issue.
YTW SCENARIO
Maturity Type : Limit Maturity
Maturity Date : 2042-04-02
Maturity Price : 23.11
Evaluated at bid price : 25.06
Bid-YTW : 3.62 %
BAM.PF.A FixedReset 68,160 Recent new issue.
YTW SCENARIO
Maturity Type : Limit Maturity
Maturity Date : 2042-04-02
Maturity Price : 23.11
Evaluated at bid price : 25.05
Bid-YTW : 4.36 %
ENB.PR.F FixedReset 59,429 Scotia crossed 30,000 at 25.40.
YTW SCENARIO
Maturity Type : Limit Maturity
Maturity Date : 2042-04-02
Maturity Price : 23.23
Evaluated at bid price : 25.40
Bid-YTW : 3.88 %
TRP.PR.B FixedReset 56,462 Desjardins crossed 25,000 at 25.35; Nesbitt crossed 20,000 at the same price.
YTW SCENARIO
Maturity Type : Limit Maturity
Maturity Date : 2042-04-02
Maturity Price : 23.48
Evaluated at bid price : 25.42
Bid-YTW : 2.77 %
There were 14 other index-included issues trading in excess of 10,000 shares.
Wide Spread Highlights
Issue Index Quote Data and Yield Notes
PWF.PR.F Perpetual-Premium Quote: 25.07 – 25.40
Spot Rate : 0.3300
Average : 0.1997

YTW SCENARIO
Maturity Type : Limit Maturity
Maturity Date : 2042-04-02
Maturity Price : 24.84
Evaluated at bid price : 25.07
Bid-YTW : 5.32 %

CIU.PR.A Perpetual-Discount Quote: 24.40 – 24.74
Spot Rate : 0.3400
Average : 0.2138

YTW SCENARIO
Maturity Type : Limit Maturity
Maturity Date : 2042-04-02
Maturity Price : 24.11
Evaluated at bid price : 24.40
Bid-YTW : 4.75 %

GWO.PR.G Deemed-Retractible Quote: 25.03 – 25.34
Spot Rate : 0.3100
Average : 0.2058

YTW SCENARIO
Maturity Type : Call
Maturity Date : 2013-12-31
Maturity Price : 25.00
Evaluated at bid price : 25.03
Bid-YTW : 5.17 %

GWO.PR.J FixedReset Quote: 26.21 – 26.50
Spot Rate : 0.2900
Average : 0.1988

YTW SCENARIO
Maturity Type : Call
Maturity Date : 2013-12-31
Maturity Price : 25.00
Evaluated at bid price : 26.21
Bid-YTW : 3.16 %

POW.PR.G Perpetual-Premium Quote: 25.65 – 25.85
Spot Rate : 0.2000
Average : 0.1284

YTW SCENARIO
Maturity Type : Call
Maturity Date : 2021-04-15
Maturity Price : 25.00
Evaluated at bid price : 25.65
Bid-YTW : 5.24 %

BAM.PR.G FixedFloater Quote: 21.51 – 22.00
Spot Rate : 0.4900
Average : 0.4189

YTW SCENARIO
Maturity Type : Limit Maturity
Maturity Date : 2042-04-02
Maturity Price : 22.33
Evaluated at bid price : 21.51
Bid-YTW : 3.83 %

ELF.PR.H Steady on Good Volume

Tuesday, April 3rd, 2012

E-L Financial Corporation Limited has announced:

the completion of its previously-announced sale to a syndicate of underwriters, co-led by Scotia Capital Inc. and TD Securities Inc., of 4,000,000 Non-Cumulative Redeemable First Preference Shares, Series 3 for sale to the public at a price of $25.00 per share and paying fixed non-cumulative quarterly dividends that will yield 5.50% per annum. The gross proceeds of $100,000,000, less the expenses of the offering, will be added to the Corporation’s capital base to supplement the Corporation’s financial resources and used for general corporate purposes. The First Preference Shares, Series 3 will be posted for trading on the Toronto Stock Exchange (“TSX”) under the symbol ELF.PR.H.

The First Preference Shares, Series 3 will rank in priority to the common shares and the Series A Preference Shares of the Corporation, with respect to the payment of dividends and with respect to the distribution of assets on the dissolution, liquidation or winding up of the Corporation. On and after April 17, 2017, the Corporation may, subject to TSX approval, convert all or any part of the outstanding First Preference Shares, Series 3 into freely tradeable common shares of the Corporation. The First Preference Shares, Series 3 are also redeemable at the option of the Corporation on and after April 17, 2017.

ELF.PR.H is a Straight Perpetual, 5.50%, announced March 9. It will be assigned to the PerpetualDiscounts index – although issued by an Insurance Holding Company, it is exchangeable for common at the option of the company, a feature which CIBC has used to achieve NVCC status for three of its issues.

ELF.PR.H traded 426,481 shares today in a range of 24.94-09 before closing at 24.98-00, 10×30. Vital statistics are:

ELF.PR.H Perpetual-Discount YTW SCENARIO
Maturity Type : Limit Maturity
Maturity Date : 2042-04-02
Maturity Price : 24.59
Evaluated at bid price : 24.98
Bid-YTW : 5.52 %

YLO Bonds Downgraded to B, Trend Negative, by DBRS

Monday, April 2nd, 2012

DBRS has announced that it:

has today downgraded Yellow Media Inc.’s (Yellow Media or the Company) Issuer Rating to B (low) from B (high); its Medium-Term Notes rating to B (low) from B (high), with an RR4 recovery rating; and its Exchangeable Subordinated Debentures to CCC from B (low), with an RR6 recovery rating. The trend on all ratings remains Negative.

DBRS notes that Yellow Media’s unsecured debt continues to have average recovery prospects (RR4; 30% to 50% expected recovery), while its subordinated debt has poor recovery prospects (RR6; 0% to 10% expected recovery) under a base case default/recovery scenario.

Today’s downgrade reflects the fact that the Company has made no progress in improving its liquidity position throughout the remainder of Q1 2012. The window for refinancing activities continues to diminish as the Company’s first debt maturity (of its roughly $2 billion of total gross debt) approaches in February 2013, which marks the beginning of a period of sizable and relatively steady debt maturities over the 2013 to 2016 time frame. As such, we believe that the likelihood that the Company’s financing activities in 2012 will involve some form of compromise for existing creditors has increased to a level that is no longer consistent with the previous B (high) ratings.

The Negative trend reflects the possibility that Yellow Media’s ratings could be further downgraded with the passage of time or in the event that the Company pursues some form of recapitalization.

YLO has four issues of preferred shares outstanding: YLO.PR.A & YLO.PR.B (Operating Retractible) and YLO.PR.C & YLO.PR.D (FixedReset). All are tracked by HIMIPref™; all are relegated to the Scraps index on credit concerns.

MAPF Performance: March, 2012

Sunday, April 1st, 2012

The fund underperformed in March, as DeemedRetractibles issued by insurers underperformed the rest of market.

The fund’s Net Asset Value per Unit as of the close March 30, 2012, was 10.3944, after giving effect to a dividend distribution of $0.112796.

Returns to March, 2012
Period MAPF BMO-CM “50” Index TXPR
Total Return
CPD
according to
Blackrock
One Month -1.03% -0.17% -0.39% -0.39%
Three Months +4.25% +1.30% +1.21% +1.16%
One Year +2.11% +5.95% +4.55% +4.08%
Two Years (annualized) +12.05% +9.47% +7.90% N/A
Three Years (annualized) +22.31% +14.85% +12.48% +11.73%
Four Years (annualized) +18.47% +6.87% +5.23%  
Five Years (annualized) +14.16% +3.92%    
Six Years (annualized) +12.66% +3.98%    
Seven Years (annualized) +11.95% +4.16%    
Eight Years (annualized) +11.19% +3.89%    
Nine Years (annualized) +14.09% +4.65%    
Ten Years (annualized) +12.19% +4.61%    
Eleven Years (annualized) +12.54% +4.30%    
MAPF returns assume reinvestment of distributions, and are shown after expenses but before fees.
CPD Returns are for the NAV and are after all fees and expenses.
* CPD does not directly report its two-year returns.
Figures for Omega Preferred Equity (which are after all fees and expenses) for 1-, 3- and 12-months are -0.40%, +1.59% and +4.69%, respectively, according to Morningstar after all fees & expenses. Three year performance is +13.06%.
Figures for Jov Leon Frazer Preferred Equity Fund Class I Units (which are after all fees and expenses) for 1-, 3- and 12-months are -0.40%, +0.17% and +2.71% respectively, according to Morningstar. Three Year performnce is +9.96%
Figures for Manulife Preferred Income Fund (formerly AIC Preferred Income Fund) (which are after all fees and expenses) for 1-, 3- and 12-months are -0.42%, +1.22% & +4.85%, respectively
Figures for Horizons AlphaPro Preferred Share ETF (which are after all fees and expenses) for 1-, 3- and 12-months are -0.29%, +1.97% & +5.64%, respectively.

MAPF returns assume reinvestment of dividends, and are shown after expenses but before fees. Past performance is not a guarantee of future performance. You can lose money investing in Malachite Aggressive Preferred Fund or any other fund. For more information, see the fund’s main page. The fund is available either directly from Hymas Investment Management or through a brokerage account at Odlum Brown Limited.

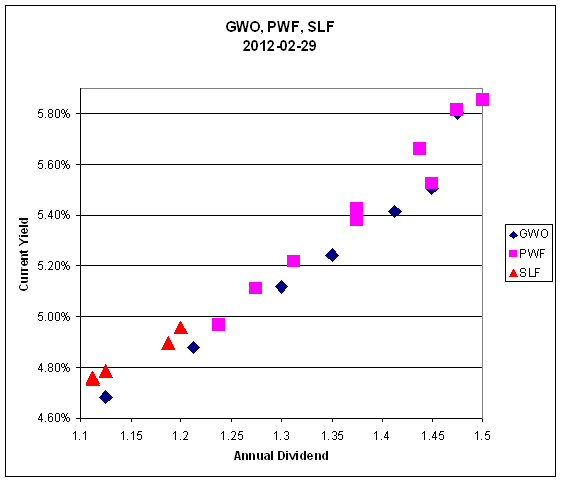
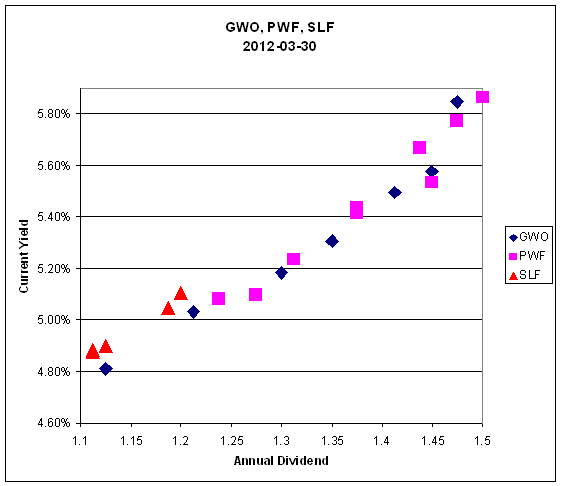
SLF DeemedRetractibles may be compared with PWF and GWO:


Click for Big

Click for Big

It is quite apparent that that the market continues to treat regulated issues (SLF, GWO) no differently from unregulated issues (PWF). What is not quite so apparent from these charts is that the slope of the relationship between dividend rates and current yields has flattened considerably over the month – the slope of the regression line has changed from 0.0277 in February to 0.0243 in March.

Those of you who have been paying attention will remember that in a “normal” market (which we have not seen in over a year) the slope of this line is related to the implied volatility of yields in Black-Scholes theory, as discussed in the January, 2010, edition of PrefLetter. Despite the current month’s flattening, however, the relationship is still far too large to be explained by Implied Volatility – the numbers still indicate an overwhelming degree of directionality in the market’s price expectations.

However, the trading that began in February (swapping low-coupon GWO issues for the higher-coupon ones) which was continued in March, has yielded very favourable results since trade-time:

Sample GWO Trade
Approximate Figures
Date GWO.PR.I
Coupon 1.125
GWO.PR.P
Coupon 1.35
3/1 Sold
24.20
Bought
25.86
3/30 Closing Bid
23.39
Closing Bid
25.52

As may be seen, the trade mitigated the loss. It’s a shame that SLF hasn’t got any high-coupon issues; if they had, I suspect similar trades would have been executable for this issuer!

Sometimes everything works … sometimes it’s 50-50 … sometimes nothing works. The fund seeks to earn incremental return by selling liquidity (that is, taking the other side of trades that other market participants are strongly motivated to execute), which can also be referred to as ‘trading noise’. There were a lot of strongly motivated market participants during the Panic of 2007, generating a lot of noise! Unfortunately, the conditions of the Panic may never be repeated in my lifetime … but the fund will simply attempt to make trades when swaps seem profitable, without worrying about the level of monthly turnover.

There’s plenty of room for new money left in the fund. I have shown in recent issues of PrefLetter that market pricing for FixedResets is demonstrably stupid and I have lots of confidence – backed up by my bond portfolio management experience in the markets for Canadas and Treasuries, and equity trading on the NYSE & TSX – that there is enough demand for liquidity in any market to make the effort of providing it worthwhile (although the definition of “worthwhile” in terms of basis points of outperformance changes considerably from market to market!) I will continue to exert utmost efforts to outperform but it should be borne in mind that there will almost inevitably be periods of underperformance in the future.

The yields available on high quality preferred shares remain elevated, which is reflected in the current estimate of sustainable income.

Calculation of MAPF Sustainable Income Per Unit
Month NAVPU Portfolio
Average
YTW
Leverage
Divisor
Securities
Average
YTW
Capital
Gains
Multiplier
Sustainable
Income
per
current
Unit
June, 2007 9.3114 5.16% 1.03 5.01% 1.3240 0.3524
September 9.1489 5.35% 0.98 5.46% 1.3240 0.3773
December, 2007 9.0070 5.53% 0.942 5.87% 1.3240 0.3993
March, 2008 8.8512 6.17% 1.047 5.89% 1.3240 0.3938
June 8.3419 6.034% 0.952 6.338% 1.3240 $0.3993
September 8.1886 7.108% 0.969 7.335% 1.3240 $0.4537
December, 2008 8.0464 9.24% 1.008 9.166% 1.3240 $0.5571
March 2009 $8.8317 8.60% 0.995 8.802% 1.3240 $0.5872
June 10.9846 7.05% 0.999 7.057% 1.3240 $0.5855
September 12.3462 6.03% 0.998 6.042% 1.3240 $0.5634
December 2009 10.5662 5.74% 0.981 5.851% 1.1141 $0.5549
March 2010 10.2497 6.03% 0.992 6.079% 1.1141 $0.5593
June 10.5770 5.96% 0.996 5.984% 1.1141 $0.5681
September 11.3901 5.43% 0.980 5.540% 1.1141 $0.5664
December 2010 10.7659 5.37% 0.993 5.408% 1.0298 $0.5654
March, 2011 11.0560 6.00% 0.994 5.964% 1.0298 $0.6403
June 11.1194 5.87% 1.018 5.976% 1.0298 $0.6453
September 10.2709 6.10%
Note
1.001 6.106% 1.0298 $0.6090
December, 2011 10.0793 5.63%
Note
1.031 5.805% 1.0000 $0.5851
March, 2012 10.3944 5.13%
Note
0.996 5.109% 1.0000 $0.5310
NAVPU is shown after quarterly distributions of dividend income and annual distribution of capital gains.
Portfolio YTW includes cash (or margin borrowing), with an assumed interest rate of 0.00%
The Leverage Divisor indicates the level of cash in the account: if the portfolio is 1% in cash, the Leverage Divisor will be 0.99
Securities YTW divides “Portfolio YTW” by the “Leverage Divisor” to show the average YTW on the securities held; this assumes that the cash is invested in (or raised from) all securities held, in proportion to their holdings.
The Capital Gains Multiplier adjusts for the effects of Capital Gains Dividends. On 2009-12-31, there was a capital gains distribution of $1.989262 which is assumed for this purpose to have been reinvested at the final price of $10.5662. Thus, a holder of one unit pre-distribution would have held 1.1883 units post-distribution; the CG Multiplier reflects this to make the time-series comparable. Note that Dividend Distributions are not assumed to be reinvested.
Sustainable Income is the resultant estimate of the fund’s dividend income per current unit, before fees and expenses. Note that a “current unit” includes reinvestment of prior capital gains; a unitholder would have had the calculated sustainable income with only, say, 0.9 units in the past which, with reinvestment of capital gains, would become 1.0 current units.
DeemedRetractibles are comprised of all Straight Perpetuals (both PerpetualDiscount and PerpetualPremium) issued by BMO, BNS, CM, ELF, GWO, HSB, IAG, MFC, NA, RY, SLF and TD, which are not exchangable into common at the option of the company (definition refined in May). These issues are analyzed as if their prospectuses included a requirement to redeem at par on or prior to 2022-1-31, in addition to the call schedule explicitly defined. See OSFI Does Not Grandfather Extant Tier 1 Capital, CM.PR.D, CM.PR.E, CM.PR.G: Seeking NVCC Status and the January, February, March and June, 2011, editions of PrefLetter for the rationale behind this analysis.
Yields for September, 2011, to January, 2012, were calculated by imposing a cap of 10% on the yields of YLO issues held, in order to avoid their extremely high calculated yields distorting the calculation and to reflect the uncertainty in the marketplace that these yields will be realized. Commencing February, 2012, yields on these issues have been set to zero.

Significant positions were held in DeemedRetractible and FixedReset issues on March 30; all of these currently have their yields calculated with the presumption that they will be called by the issuers at par prior to 2022-1-31. This presents another complication in the calculation of sustainable yield. The fund also holds a position in SplitShare issues (BNA.PR.C) which also have their yields calculated with the expectation of a maturity at par.

The decline in the calculated sustainable yield is due to a significant shortening of term in the year to date, together with the elimination of expected dividends from the YLO issues – January’s run-up in the prices of longer-term issues has made it prudent to increase the investment in shorter-term, better-credit, lower-yielding FixedResets, although the weighting in this asset class remains well below index levels.

I will no longer show calculations that assume the conversion of the entire portfolio into PerpetualDiscounts, as there are currently only seven such issues of investment grade, from only three issuer groups. Additionally, the fund has only small holdings of these issues.

Different assumptions lead to different results from the calculation, but the overall positive trend is apparent. I’m very pleased with the long-term results! It will be noted that if there was no trading in the portfolio, one would expect the sustainable yield to be constant (before fees and expenses). The success of the fund’s trading is showing up in

  • the very good performance against the index
  • the long term increases in sustainable income per unit

As has been noted, the fund has maintained a credit quality equal to or better than the index; outperformance is due to constant exploitation of trading anomalies.

Again, there are no predictions for the future! The fund will continue to trade between issues in an attempt to exploit market gaps in liquidity, in an effort to outperform the index and keep the sustainable income per unit – however calculated! – growing.