Archive for June, 2012

VNR.PR.A Firm on Good Volume

Wednesday, June 6th, 2012

Valener Inc. has announced:

the closing of the previously announced public offering of Cumulative Rate Reset Preferred Shares, Series A (the “Series A Preferred Shares”). Valener issued a total of 4,000,000 Series A Preferred Shares at a price of $25.00 per Series A Preferred Share, for gross proceeds of $100,000,000. The offering was made on a bought deal basis through a syndicate of underwriters co-led by BMO Capital Markets and TD Securities Inc.

The Series A Preferred Shares commence trading on the Toronto Stock Exchange today under the symbol VNR.PR.A.

“We are pleased that Valener has successfully completed its first distribution of Preferred Shares, which reflects the confidence the financial markets have in our company”, Mr. Pierre Monahan, Chairman of the Board of Directors of Valener, stated.

The net proceeds of the offering will be used by Valener to subscribe to additional units of Gaz Métro Limited Partnership (“Gaz Métro”) in order for Gaz Métro to finance part of its proposed acquisition of Central Vermont Public Service Corporation (the “CVPS Acquisition”) and any balance, for general corporate purposes. In the event the CVPS Acquisition does not proceed, Valener will use the net proceeds of the offering to repay amounts under its credit facility and for general corporate purposes.

Note that the issue size was upsized following announcement of the issue.

VNR.PR.A is a FixedReset, 4.35%+281, announced May 15. The issue will be tracked by HIMIPref™ and assigned to the FixedResets subindex.

VNR.PR.A traded 400,176 shares today in a range of 25.10-18 before closing at 25.14-15, 21×26. Vital statistics are:

VNR.PR.A FixedReset YTW SCENARIO
Maturity Type : Limit Maturity
Maturity Date : 2042-06-06
Maturity Price : 23.19
Evaluated at bid price : 25.15
Bid-YTW : 3.88 %

LFE.PR.A Tight-Lipped Regarding Special Retraction Results

Wednesday, June 6th, 2012

It will be recalled that LFE.PR.A is undergoing a reorganization; a very important part of this reorganization was:

Shareholders who do not wish to remain invested in the Company under its reorganized share structure will have until the close of business on May 17, 2012 to provide the Company with notice through their CDS participant that they wish to have their Preferred Shares or Class A Shares redeemed pursuant to the 2012 Special Retraction Right, and to surrender their Shares for retraction. On such a special retraction, each holder of a Preferred Share will receive the lesser of (i) $10.00 and (ii) the net asset value per Unit calculated on May 31, 2012; while holder of a Class A Share will receive the net asset value per Unit calculated on May 31, 2012, less $10.00. Shareholders interested in exercising such retraction right should contact the CDS Participant through which they hold the Shares for further information and instructions as to how to exercise this right. Shareholders should note that the requirements of any particular CDS Participant may vary, and that Shareholders may need to inform their CDS Participant of any intention to exercise this retraction right in advance of the May 17 deadline. Payment for the Class A Shares or Preferred Shares so tendered for retraction pursuant to the 2012 Special Retraction Right will be made no later than June 19, 2012.

So – the company has known what the consolidation ratio was going to be for which issue (either the capital units or the preferreds) since … oh, call it the morning of May 18. In my innocence, I had assumed that the details of the consolidation would be made available on the NAV date of May 31 (or June 1, anyway!):

If more Class A Shares are tendered for retraction under the 2012 Special Retraction Right than Preferred Shares, the outstanding Preferred Shares will be consolidated so that following the retraction pursuant to the 2012 Special Retraction Right there would be an equal number of Preferred Shares and Class A Shares outstanding. Similarly, if more Preferred Shares are tendered for retraction than Class A Shares, the outstanding Class A shares will be consolidated so that again there would be an equal number of Preferred Shares and Class A Shares outstanding following implementation of the 2012 Special Retraction Right. The Company may implement this consolidation by adjusting the number of 2012 Preferred Shares, 2013 Warrants and 2014 Warrants to be issued to holders of Preferred Shares, in the event a consolidation of Preferred Shares is required.

No announcement has yet been made, so I inquired; the answer received was:

A news release will likely be disseminated close to the June 19th Special Retraction payment date.

Knowing the consolidation ratio is critical when evaluating credit quality of LFE.PR.A; it is also critical when evaluating the option value of LFE. But good old Quadravest is going to keep us in the dark; and I cannot even begin to fathom the purpose behind the delay.

All I can suggest is that according to the 2011 Financials, there were 10,712,753 units outstanding on 2011-11-30 and this number is reflected for each part of the unit on the TMX Money Website. Another possibility is to check SEDAR for filings that are only semi-publicized.

What a total waste of time.

ALA.PR.U Weak on Good Volume

Wednesday, June 6th, 2012

AltaGas has announced:

it has closed its previously announced public offering of 8,000,000 Cumulative Redeemable Five-Year Fixed Rate Reset Preferred Shares, Series C (the “Series C Preferred Shares”) at a price of US$25.00 per Series C Preferred Share (“the Offering”) for aggregate gross proceeds of US$200 million. The previously announced underwriters’ option to purchase an additional 2,000,000 Series C Preferred Shares at a price of US$25.00 per share was exercised in full.

The Offering was first announced on May 29, 2012 when AltaGas entered into an agreement with a syndicate of underwriters, co-led by RBC Capital Markets, CIBC and Scotiabank.

Net proceeds will be used to reduce outstanding indebtedness and for general corporate purposes.

The Series C Preferred Shares will commence trading today on the Toronto Stock Exchange under the symbol ALA.PR.U.

ALA.PR.U is a FixedReset, US-Pay, 4.40%+358, announced May 29. The issue traded 402,860 shares today in a range of 24.35-60 before closing at 24.45-49, 20×1.

ALA.PR.U will not be tracked by HIMIPref™ as there are insufficient USD issues available to form a coherent universe.

June 5, 2012

Wednesday, June 6th, 2012

Oh, the technology!

The Romney and Obama campaigns want supporters to be able to send contributions instantly using their smartphones, a step that would let telecommunications companies join in collecting fees that now flow to bank-card networks.

Campaigns will have access to texters’ phone numbers, creating the opportunity to “upsell” them for larger donations, according to Armour, a press secretary in Al Gore’s 1988 presidential campaign.

Political campaigns can expect to see 50 to 70 percent of a donation, with the rest going to fees to aggregators and carriers, Sege said. By comparison, a “card not present” transaction, such as one involving a credit card number entered into a campaign website, carries a fee ranging between 2 and 3 percent, according to Trish Wexler, spokeswoman for the Electronic Payments Coalition, a trade group that represents credit card networks and banks.

Tax the rich? It gets a little complex:

Increasing volatility in tax collections is complicating local governments’ emergence from the worst fiscal crisis since the Great Depression. States projected or dealt with a combined $54 billion of deficits in the fiscal year starting July 1, according to a report from the Center on Budget and Policy Priorities, a nonprofit group in Washington focusing on issues affecting lower-income Americans.

California Governor Jerry Brown, a Democrat, last month cut the most-populous state’s revenue forecast by $4.3 billion after capital gains receipts fell 5 percent, instead of gaining 15 percent as forecast. In response, he proposed steps such as reducing government employees’ workweek by 5 percent.

A one-step rating cut in January by Moody’s Investors Service, to Aa3, has contributed to weakness in Connecticut debt, said Brian Steeves, a portfolio manager at Belle Haven Investments in White Plains, New York. The rank is Moody’s fourth-highest.

Moody’s cited pension and debt costs as well as the state’s susceptibility to “financial market fluctuations,” given the dependence on capital gains.

There are more official worries about the US national debt:

The U.S. government risks a fiscal crisis unless it makes significant changes in tax and spending policies, the Congressional Budget Office said.

The nonpartisan agency said today that without policy changes, the national debt within 15 years will top the historical peak set after World War II. In 1946, government debt amounted to 109 percent of the economy.

The gap between projected taxes and spending is so large, the report said, that if lawmakers merely wanted to prevent the debt-to-GDP ratio from increasing over the next 25 years, they’d have to immediately and permanently cut $700 billion from the $3.6 trillion U.S. budget.

Nothing will happen until the Treasury Secretary has to ask the President to play “Bond Salesman”. That’s what it took in Canada in 1994.

There is more despairing acknowledgement that the TMX / Maple deal is anti-competitive:

Chief among the concerns is that the result will be higher costs for users of TMX’s services that provide trading and market data, RBC said in its submissions. ITG, another large trading house, echoed many of RBC’s concerns in its own comments, which were also handed to the OSC on Monday.

RBC argues that the Maple proposal “will require a significantly different approach to the regulation of fees and fee models in Canada,” and will require the OSC to bulk up to deal with the added workload.

“The commission should recognize the very substantial increase in its capacity and capability that will be required in order to make it an effective regulator of market structure and fees,” RBC said.

ITG’s suggestions were along the same lines, saying that “the structure proposed by the Maple acquisition is fraught with conflicts of interest across every facet of the trading, clearing and settlement infrastructure of this country” and those conflicts “have the potential to seriously affect the ability of other participants to compete effectively in our capital markets.”

A successful deal will mean more jobs for more important regulators! Golly, I wonder if the regulators will approve it.

Investors have learned to demand to be shown the money whenever the Europeans politicians talk about ending the crisis. They are not yet so realistic about the G-7:

Asian stocks rose as finance ministers and central bank governors from the world’s leading economies agreed to coordinate their response to Europe’s financial crisis and U.S. service-industry growth tempered concern the world’s largest economy is slowing.

Finance ministers and central bank governors from the Group of Seven economies agreed to coordinate their response to Europe’s financial crisis on a conference call yesterday. G-7 officials said they will work together to help Spain and Greece place their public finances on a sustainable footing, Japanese Finance Minister Jun Azumi told reporters in Tokyo following the call.

I’m just overjoyed that they’re going to work together to coordinate their response! Yay!

The latest wooly-thinking comes from commentary on the Wisconsin gubernatorial re-run:

Over the past year, Wisconsinites divided into two camps: those who see public unions as critical to ensuring a stable middle-class and those like Mr. Walker who see them as the source of ballooning government debts and higher taxes.

Wrong! Public unions are not the source of ballooning government debts and higher taxes. The source of ballooning government debts and higher taxes are gutless wonder politicians (and do-gooders and their wooly minded supporters) who agree to ludicrous contracts. You will never hear me criticize welfare recipients, whether of the human or corporate variety, who ask for government largesse. Anybody can ask for money! It’s a free country! The villains are the idiots who give it to them.

What, never? Hardly ever.

Much more interesting was the note that:

But since Mr. Walker signed the collective-bargaining bill, which was passed last year by Wisconsin’s Republican-controlled legislature amid weeks of protests around the state capitol, membership in the state’s public-sector unions has withered.

That is because the law ended the automatic deduction of union dues. Public workers must now choose to opt in to the union, rather than being included by virtue of their job.

The result is that the main union that represents state and municipal workers in Wisconsin saw its membership fall by more than half to about 29,000 from 63,000 in the past year. The Wisconsin wing of the American Federation of Teachers lost a third of its members.

It was a mixed day for the Canadian preferred share market, with PerpetualPremiums gaining 10bp, FixedResets winning 18bp and DeemedRetractibles off 9bp. Insurance losers were again notable in the Performance Highlights table, but on a much less overwhelming basis than they were yesterday. Volume was average.

HIMIPref™ Preferred Indices
These values reflect the December 2008 revision of the HIMIPref™ Indices

Values are provisional and are finalized monthly
Index Mean
Current
Yield
(at bid)
Median
YTW
Median
Average
Trading
Value
Median
Mod Dur
(YTW)
Issues Day’s Perf. Index Value
Ratchet 0.00 % 0.00 % 0 0.00 0 -0.4128 % 2,322.3
FixedFloater 4.48 % 3.86 % 28,310 17.59 1 0.1890 % 3,518.1
Floater 3.11 % 3.14 % 76,489 19.32 3 -0.4128 % 2,507.4
OpRet 4.81 % 2.56 % 38,740 1.03 5 -0.0696 % 2,497.1
SplitShare 5.35 % 3.93 % 50,124 0.52 4 -1.2945 % 2,678.2
Interest-Bearing 0.00 % 0.00 % 0 0.00 0 -0.0696 % 2,283.4
Perpetual-Premium 5.45 % 3.08 % 79,937 0.60 26 0.0981 % 2,225.5
Perpetual-Discount 5.06 % 5.11 % 136,606 15.22 7 -0.3845 % 2,432.3
FixedReset 5.07 % 3.18 % 191,030 7.90 70 0.1843 % 2,382.6
Deemed-Retractible 5.04 % 3.91 % 149,988 3.16 45 -0.0885 % 2,292.1
Performance Highlights
Issue Index Change Notes
FBS.PR.C SplitShare -5.47 % Not a real loss! There was exactly one trade today, for 3,000 shares at 10.60.
YTW SCENARIO
Maturity Type : Call
Maturity Date : 2012-12-15
Maturity Price : 10.00
Evaluated at bid price : 10.03
Bid-YTW : 3.93 %
MFC.PR.I FixedReset -1.74 % YTW SCENARIO
Maturity Type : Hard Maturity
Maturity Date : 2022-01-31
Maturity Price : 25.00
Evaluated at bid price : 24.33
Bid-YTW : 4.61 %
GWO.PR.I Deemed-Retractible -1.57 % YTW SCENARIO
Maturity Type : Hard Maturity
Maturity Date : 2022-01-31
Maturity Price : 25.00
Evaluated at bid price : 22.56
Bid-YTW : 5.83 %
POW.PR.D Perpetual-Discount -1.56 % YTW SCENARIO
Maturity Type : Limit Maturity
Maturity Date : 2042-06-05
Maturity Price : 24.22
Evaluated at bid price : 24.56
Bid-YTW : 5.15 %
CIU.PR.A Perpetual-Discount -1.23 % YTW SCENARIO
Maturity Type : Limit Maturity
Maturity Date : 2042-06-05
Maturity Price : 23.81
Evaluated at bid price : 24.10
Bid-YTW : 4.78 %
MFC.PR.B Deemed-Retractible -1.12 % YTW SCENARIO
Maturity Type : Hard Maturity
Maturity Date : 2022-01-31
Maturity Price : 25.00
Evaluated at bid price : 22.10
Bid-YTW : 6.28 %
RY.PR.H Deemed-Retractible 1.06 % YTW SCENARIO
Maturity Type : Call
Maturity Date : 2013-05-24
Maturity Price : 26.00
Evaluated at bid price : 26.75
Bid-YTW : 2.56 %
GWO.PR.J FixedReset 1.13 % YTW SCENARIO
Maturity Type : Call
Maturity Date : 2013-12-31
Maturity Price : 25.00
Evaluated at bid price : 25.85
Bid-YTW : 3.51 %
IAG.PR.E Deemed-Retractible 1.17 % YTW SCENARIO
Maturity Type : Call
Maturity Date : 2018-12-31
Maturity Price : 25.00
Evaluated at bid price : 26.00
Bid-YTW : 5.24 %
BAM.PF.A FixedReset 2.20 % YTW SCENARIO
Maturity Type : Limit Maturity
Maturity Date : 2042-06-05
Maturity Price : 23.11
Evaluated at bid price : 25.05
Bid-YTW : 4.10 %
Volume Highlights
Issue Index Shares
Traded
Notes
CIU.PR.B FixedReset 263,360 National crossed 261,800 at 26.70.
YTW SCENARIO
Maturity Type : Call
Maturity Date : 2014-06-01
Maturity Price : 25.00
Evaluated at bid price : 26.80
Bid-YTW : 3.01 %
BMO.PR.O FixedReset 250,019 National crossed four blocks: 40,000 and 50,000 shares, then 46,200 and 30,000, all at 26.63. TD crossed blocks of 47,900 and 25,000, both at 26.63 again.
YTW SCENARIO
Maturity Type : Call
Maturity Date : 2014-05-25
Maturity Price : 25.00
Evaluated at bid price : 26.65
Bid-YTW : 3.13 %
BNS.PR.Z FixedReset 90,700 TD crossed 50,000 at 25.00.
YTW SCENARIO
Maturity Type : Hard Maturity
Maturity Date : 2022-01-31
Maturity Price : 25.00
Evaluated at bid price : 24.96
Bid-YTW : 3.04 %
BMO.PR.P FixedReset 87,600 National crossed 80,000 at 26.48.
YTW SCENARIO
Maturity Type : Call
Maturity Date : 2015-02-25
Maturity Price : 25.00
Evaluated at bid price : 26.51
Bid-YTW : 3.15 %
FTS.PR.F Perpetual-Premium 79,762 Desjardins crossed 71,400 at 25.45.
YTW SCENARIO
Maturity Type : Call
Maturity Date : 2014-12-01
Maturity Price : 25.25
Evaluated at bid price : 25.32
Bid-YTW : 4.78 %
IAG.PR.G FixedReset 70,960 Recent new issue.
YTW SCENARIO
Maturity Type : Hard Maturity
Maturity Date : 2022-01-31
Maturity Price : 25.00
Evaluated at bid price : 25.26
Bid-YTW : 4.04 %
There were 32 other index-included issues trading in excess of 10,000 shares.
Wide Spread Highlights
Issue Index Quote Data and Yield Notes
MFC.PR.I FixedReset Quote: 24.33 – 24.79
Spot Rate : 0.4600
Average : 0.2647

YTW SCENARIO
Maturity Type : Hard Maturity
Maturity Date : 2022-01-31
Maturity Price : 25.00
Evaluated at bid price : 24.33
Bid-YTW : 4.61 %

FBS.PR.C SplitShare Quote: 10.03 – 10.60
Spot Rate : 0.5700
Average : 0.4295

YTW SCENARIO
Maturity Type : Call
Maturity Date : 2012-12-15
Maturity Price : 10.00
Evaluated at bid price : 10.03
Bid-YTW : 3.93 %

FTS.PR.E OpRet Quote: 26.32 – 26.99
Spot Rate : 0.6700
Average : 0.5603

YTW SCENARIO
Maturity Type : Call
Maturity Date : 2013-06-01
Maturity Price : 25.75
Evaluated at bid price : 26.32
Bid-YTW : 2.56 %

HSB.PR.D Deemed-Retractible Quote: 25.36 – 25.85
Spot Rate : 0.4900
Average : 0.3975

YTW SCENARIO
Maturity Type : Hard Maturity
Maturity Date : 2022-01-31
Maturity Price : 25.00
Evaluated at bid price : 25.36
Bid-YTW : 4.96 %

CIU.PR.A Perpetual-Discount Quote: 24.10 – 24.45
Spot Rate : 0.3500
Average : 0.2657

YTW SCENARIO
Maturity Type : Limit Maturity
Maturity Date : 2042-06-05
Maturity Price : 23.81
Evaluated at bid price : 24.10
Bid-YTW : 4.78 %

IAG.PR.F Deemed-Retractible Quote: 25.77 – 26.00
Spot Rate : 0.2300
Average : 0.1535

YTW SCENARIO
Maturity Type : Call
Maturity Date : 2019-03-31
Maturity Price : 25.00
Evaluated at bid price : 25.77
Bid-YTW : 5.33 %

June 4, 2012

Tuesday, June 5th, 2012

RBC is defending its capital markets exposure:

Frustrated with a recent ratings downgrade and worried by the imminent possibility of another, Royal Bank of Canada is intent on proving that its capital markets arm poses no real threat to its future.

Facing another blow, RBC lashed out, arguing that its inclusion in a review of too-big-to-fail firms was “unwarranted,” in part because its capital markets business represented less than 25 per cent of the bank’s bottom line.

Building on this argument, RBC put together a special presentation for analysts and investors on Friday that focused solely on its capital markets business. The bank did not come out and say that the presentation was designed to prove Moody’s wrong, but the potential downgrade was hinted at many times.

RBC also devoted a lot of time to risk management practices, another of Moody’s concerns. In February, the rating agency noted that “rapidly changing risk positions expose these firms to unexpected losses that can overwhelm the resources of even the largest, most diversified groups.” RBC noted that of the roughly 1,000 people added since 2008, the majority have been in the back office, where divisions such as risk management are housed.

Divisions such as compliance are also housed in the back office. The RBC Presentation proudly states that the Capital Market division is:

Strategically extending our loan book to deepen client relationships

  • Modest sized loan book representing 13% of RBC’s total outstanding loans and acceptances
  • Since 2009, increased the number of lending clients by 30% to over 1,200

… but I’m not sure if that’s a good thing for either the bank or society, despite all their protestations regarding diversification, exposure limits and profitability. The lending makes it difficult, if not impossible, for non-bank dealers to compete; and the dual purpose of the lending (to make a lending profit and to make a trading profit) makes these loans somewhat more suceptible to jiggery-pokery at approval time.

The OSC has a new policy:

Staff of the Compliance and Registrant Regulation Branch of the Ontario Securities Commission (the OSC) is sending this email to firms that are registered under the Securities Act (Ontario) (the Act) in the categories of exempt market dealer, scholarship plan dealer, or portfolio manager, to advise such firms of a new approach OSC staff will be adopting when performing compliance reviews under section 20 of the Act. Specifically, OSC staff will now contact clients of registered firms as a routine part of its compliance review process.

While OSC staff have historically not contacted clients of a registered firm as part of the compliance review process, we have done so in a number of exceptional cases and have found that client contact is a valuable method of assessing the firm’s compliance with Ontario securities law. Accordingly, we will be expanding our use of this important tool and will be contacting clients in the normal course of compliance reviews. Clients may be asked a variety of questions regarding their experience with their registered firm and representative, including such things as the accuracy of know-your-client information the firm has about them and investment recommendations and advice provided to them.

Unless OSC staff have reason to believe that regulatory action against a firm may be warranted, clients who are contacted by OSC staff will be informed that they are being contacted in the normal course of a compliance review of the firm, and that the call to them should not be interpreted as a sign of any misconduct by the firm. Clients will also be informed that they are not required to speak with OSC staff should they choose not to, and that their participation in the compliance review process is entirely voluntary.

The Globe has a very interesting piece on housing affordability:

Where things get weird is in how they calculate the average house price. What they’ve done is set the price at $144,600 in 1990, which is simply the average resale price at the time as calculated by the Canadian Real Estate Association (CREA). From that point, the Bank of Canada estimates the change in the average house price by averaging out gains as reported by Statistics Canada’s New House Price index (NHPI), and by Royal Lepage (i.e. CREA).

The issue here is that the NHPI is a quality-adjusted index, which means it seeks to measure the change in a comparable dwelling over time. This is a very important concept when it comes to tracking true inflation over time as you need an apples-to-apples comparison.

We know that the average size of new dwellings has risen in Canada, with the average new house being just under 2,000 square feet, according to data from the Canadian Home Builders Association. This is up markedly since the 1970s when the average house size in Canada was under 1,100 square feet. So as a society, we’ve changed our expectations for what constitutes a “normal sized” house. The problem is that as we’ve demanded larger and larger homes with better amenities and have been willing to stretch the household budget further to get those, the NHPI has been busy factoring out these changes.

The end result is that by pegging 50 per cent of the growth in house prices to the NHPI, the average house price used in the Bank of Canada affordability index has significantly underperformed other measures of house price appreciation. The chart above illustrates the change in value of the average house used in the Bank of Canada affordability index. If you believe that the average house in Canada is $260,000, I can see how you’d think that there was no problem with affordability in Canada.

The full piece is well-worth reading and is a good companion to the recent RBC quarterly report on the topic.

Henry Paulson has joined the fray on new US MMF rules:

Former Treasury Secretary Henry Paulson is backing U.S. Securities and Exchange Commission Chairman Mary Schapiro’s effort to impose new rules on money- market funds.

In a letter that the SEC published May 30 on its website, Paulson highlights excerpts of his 2010 book, “On the Brink,” which provides his account of the financial crisis. Paulson’s letter covered the period between Sept. 16 and Sept. 19, 2008 when Bank of New York Mellon Corp., BlackRock Inc. (BLK) and Northern Trust Corp. (NTRS) reported requests for “billions in redemptions” from their money funds. Such requests exacerbated a credit crisis that began earlier that month, he wrote.

Schapiro initially proposed requiring money-market firms float their $1 net asset value along with mandating more capital and preventing customers from withdrawing all of their funds for 30 days. The so-called holdback provision has been particularly controversial in the industry and Schapiro is said to be open to replacing it with a fee that would be imposed on customers who take out their money during a liquidity crisis.

Money-market firms have also fought the effort to move the industry to a floating net asset value. Paulson’s letter highlights a passage in his book that supports the floating value.

How is one to square the circle? MMFs invest in risky assets – corporate paper. No amount of rules will eliminate the credit risk. Only capital will do that – all MMFs must have either a second class of securities that will take the first loss following a credit event or a credible guarantee from their sponsors … nothing else will do. All together folks … MMFs ARE BANKS IN FUNDS’ CLOTHING! They should be regulated as such! And – importantly – since they are banks, they should hold more capital against holdings of bank paper – any bank paper, from any bank – than should be the case for non-bank paper!

It was a rotten day for the Canadian preferred share market, with PerpetualPremiums off 16bp, FixedResets down 26bp and DeemedRetractibles losing 41bp. To make things more interesting, Floaters got whacked for 431bp, so it is not enough to speak glibly about ‘rising interest rates’! A very lengthy list of losers in the Performance Highlights table was comprised almost entirely of insurance issues. Volume was below average.

HIMIPref™ Preferred Indices
These values reflect the December 2008 revision of the HIMIPref™ Indices

Values are provisional and are finalized monthly
Index Mean
Current
Yield
(at bid)
Median
YTW
Median
Average
Trading
Value
Median
Mod Dur
(YTW)
Issues Day’s Perf. Index Value
Ratchet 0.00 % 0.00 % 0 0.00 0 -4.3077 % 2,331.9
FixedFloater 4.49 % 3.87 % 29,476 17.58 1 0.1420 % 3,511.4
Floater 3.10 % 3.12 % 77,012 19.37 3 -4.3077 % 2,517.8
OpRet 4.81 % 2.55 % 38,967 1.04 5 0.0155 % 2,498.8
SplitShare 5.28 % -5.32 % 50,745 0.54 4 0.6061 % 2,713.3
Interest-Bearing 0.00 % 0.00 % 0 0.00 0 0.0155 % 2,285.0
Perpetual-Premium 5.46 % 3.31 % 78,569 0.60 26 -0.1590 % 2,223.4
Perpetual-Discount 5.04 % 5.07 % 137,290 15.30 7 -0.2184 % 2,441.7
FixedReset 5.08 % 3.25 % 191,552 7.90 70 -0.2570 % 2,378.2
Deemed-Retractible 5.04 % 3.92 % 155,934 3.17 45 -0.4091 % 2,294.1
Performance Highlights
Issue Index Change Notes
BAM.PR.K Floater -4.71 % YTW SCENARIO
Maturity Type : Limit Maturity
Maturity Date : 2042-06-04
Maturity Price : 17.00
Evaluated at bid price : 17.00
Bid-YTW : 3.12 %
BAM.PR.B Floater -4.65 % YTW SCENARIO
Maturity Type : Limit Maturity
Maturity Date : 2042-06-04
Maturity Price : 17.01
Evaluated at bid price : 17.01
Bid-YTW : 3.12 %
BAM.PR.C Floater -3.55 % YTW SCENARIO
Maturity Type : Limit Maturity
Maturity Date : 2042-06-04
Maturity Price : 16.86
Evaluated at bid price : 16.86
Bid-YTW : 3.14 %
BAM.PF.A FixedReset -2.74 % YTW SCENARIO
Maturity Type : Limit Maturity
Maturity Date : 2042-06-04
Maturity Price : 22.92
Evaluated at bid price : 24.51
Bid-YTW : 4.22 %
SLF.PR.D Deemed-Retractible -2.68 % YTW SCENARIO
Maturity Type : Hard Maturity
Maturity Date : 2022-01-31
Maturity Price : 25.00
Evaluated at bid price : 21.45
Bid-YTW : 6.44 %
MFC.PR.F FixedReset -2.57 % YTW SCENARIO
Maturity Type : Hard Maturity
Maturity Date : 2022-01-31
Maturity Price : 25.00
Evaluated at bid price : 23.54
Bid-YTW : 4.00 %
SLF.PR.C Deemed-Retractible -2.50 % YTW SCENARIO
Maturity Type : Hard Maturity
Maturity Date : 2022-01-31
Maturity Price : 25.00
Evaluated at bid price : 21.45
Bid-YTW : 6.44 %
SLF.PR.E Deemed-Retractible -2.04 % YTW SCENARIO
Maturity Type : Hard Maturity
Maturity Date : 2022-01-31
Maturity Price : 25.00
Evaluated at bid price : 21.60
Bid-YTW : 6.40 %
SLF.PR.B Deemed-Retractible -1.89 % YTW SCENARIO
Maturity Type : Hard Maturity
Maturity Date : 2022-01-31
Maturity Price : 25.00
Evaluated at bid price : 22.89
Bid-YTW : 5.95 %
MFC.PR.B Deemed-Retractible -1.63 % YTW SCENARIO
Maturity Type : Hard Maturity
Maturity Date : 2022-01-31
Maturity Price : 25.00
Evaluated at bid price : 22.35
Bid-YTW : 6.13 %
MFC.PR.G FixedReset -1.56 % YTW SCENARIO
Maturity Type : Hard Maturity
Maturity Date : 2022-01-31
Maturity Price : 25.00
Evaluated at bid price : 24.60
Bid-YTW : 4.41 %
SLF.PR.A Deemed-Retractible -1.55 % YTW SCENARIO
Maturity Type : Hard Maturity
Maturity Date : 2022-01-31
Maturity Price : 25.00
Evaluated at bid price : 22.90
Bid-YTW : 5.89 %
POW.PR.A Perpetual-Premium -1.30 % YTW SCENARIO
Maturity Type : Limit Maturity
Maturity Date : 2042-06-04
Maturity Price : 24.89
Evaluated at bid price : 25.12
Bid-YTW : 5.65 %
MFC.PR.C Deemed-Retractible -1.25 % YTW SCENARIO
Maturity Type : Hard Maturity
Maturity Date : 2022-01-31
Maturity Price : 25.00
Evaluated at bid price : 22.07
Bid-YTW : 6.13 %
MFC.PR.D FixedReset -1.25 % YTW SCENARIO
Maturity Type : Call
Maturity Date : 2014-06-19
Maturity Price : 25.00
Evaluated at bid price : 26.15
Bid-YTW : 4.13 %
PWF.PR.L Perpetual-Premium -1.16 % YTW SCENARIO
Maturity Type : Limit Maturity
Maturity Date : 2042-06-04
Maturity Price : 24.48
Evaluated at bid price : 24.76
Bid-YTW : 5.20 %
SLF.PR.H FixedReset -1.10 % YTW SCENARIO
Maturity Type : Hard Maturity
Maturity Date : 2022-01-31
Maturity Price : 25.00
Evaluated at bid price : 24.31
Bid-YTW : 3.90 %
SLF.PR.G FixedReset -1.09 % YTW SCENARIO
Maturity Type : Hard Maturity
Maturity Date : 2022-01-31
Maturity Price : 25.00
Evaluated at bid price : 24.50
Bid-YTW : 3.34 %
IAG.PR.E Deemed-Retractible -1.08 % YTW SCENARIO
Maturity Type : Call
Maturity Date : 2017-12-31
Maturity Price : 25.25
Evaluated at bid price : 25.70
Bid-YTW : 5.52 %
SLF.PR.F FixedReset -1.07 % YTW SCENARIO
Maturity Type : Call
Maturity Date : 2014-06-30
Maturity Price : 25.00
Evaluated at bid price : 25.82
Bid-YTW : 4.15 %
BAM.PR.R FixedReset -1.06 % YTW SCENARIO
Maturity Type : Limit Maturity
Maturity Date : 2042-06-04
Maturity Price : 23.59
Evaluated at bid price : 26.20
Bid-YTW : 3.49 %
BNA.PR.E SplitShare 1.14 % YTW SCENARIO
Maturity Type : Hard Maturity
Maturity Date : 2017-12-10
Maturity Price : 25.00
Evaluated at bid price : 24.80
Bid-YTW : 5.04 %
Volume Highlights
Issue Index Shares
Traded
Notes
IAG.PR.G FixedReset 97,915 Recent new issue.
YTW SCENARIO
Maturity Type : Hard Maturity
Maturity Date : 2022-01-31
Maturity Price : 25.00
Evaluated at bid price : 25.10
Bid-YTW : 4.12 %
BNS.PR.Z FixedReset 78,166 TD sold 10,000 to Scotia at 25.00 and crossed 40,000 at the same price.
YTW SCENARIO
Maturity Type : Hard Maturity
Maturity Date : 2022-01-31
Maturity Price : 25.00
Evaluated at bid price : 24.96
Bid-YTW : 3.04 %
ELF.PR.H Perpetual-Premium 65,698 Scotia bought 11,900 from anonymous at 25.15.
YTW SCENARIO
Maturity Type : Limit Maturity
Maturity Date : 2042-06-04
Maturity Price : 24.68
Evaluated at bid price : 25.08
Bid-YTW : 5.56 %
SLF.PR.A Deemed-Retractible 52,793 YTW SCENARIO
Maturity Type : Hard Maturity
Maturity Date : 2022-01-31
Maturity Price : 25.00
Evaluated at bid price : 22.90
Bid-YTW : 5.89 %
ENB.PR.D FixedReset 43,087 Desjardins crossed 40,000 at 25.25.
YTW SCENARIO
Maturity Type : Limit Maturity
Maturity Date : 2042-06-04
Maturity Price : 23.19
Evaluated at bid price : 25.22
Bid-YTW : 3.44 %
ENB.PR.H FixedReset 42,965 Scotia crossed 28,700 at 25.20.
YTW SCENARIO
Maturity Type : Limit Maturity
Maturity Date : 2042-06-04
Maturity Price : 23.13
Evaluated at bid price : 25.10
Bid-YTW : 3.33 %
There were 24 other index-included issues trading in excess of 10,000 shares.
Wide Spread Highlights
Issue Index Quote Data and Yield Notes
BAM.PR.O OpRet Quote: 25.95 – 26.88
Spot Rate : 0.9300
Average : 0.5744

YTW SCENARIO
Maturity Type : Option Certainty
Maturity Date : 2013-06-30
Maturity Price : 25.00
Evaluated at bid price : 25.95
Bid-YTW : 2.24 %

FTS.PR.E OpRet Quote: 26.32 – 26.99
Spot Rate : 0.6700
Average : 0.4400

YTW SCENARIO
Maturity Type : Call
Maturity Date : 2013-06-01
Maturity Price : 25.75
Evaluated at bid price : 26.32
Bid-YTW : 2.55 %

POW.PR.A Perpetual-Premium Quote: 25.12 – 25.70
Spot Rate : 0.5800
Average : 0.3632

YTW SCENARIO
Maturity Type : Limit Maturity
Maturity Date : 2042-06-04
Maturity Price : 24.89
Evaluated at bid price : 25.12
Bid-YTW : 5.65 %

BAM.PF.A FixedReset Quote: 24.51 – 25.00
Spot Rate : 0.4900
Average : 0.2928

YTW SCENARIO
Maturity Type : Limit Maturity
Maturity Date : 2042-06-04
Maturity Price : 22.92
Evaluated at bid price : 24.51
Bid-YTW : 4.22 %

TCA.PR.X Perpetual-Premium Quote: 51.80 – 52.50
Spot Rate : 0.7000
Average : 0.5387

YTW SCENARIO
Maturity Type : Call
Maturity Date : 2013-10-15
Maturity Price : 50.00
Evaluated at bid price : 51.80
Bid-YTW : 3.31 %

MFC.PR.F FixedReset Quote: 23.54 – 23.99
Spot Rate : 0.4500
Average : 0.3145

YTW SCENARIO
Maturity Type : Hard Maturity
Maturity Date : 2022-01-31
Maturity Price : 25.00
Evaluated at bid price : 23.54
Bid-YTW : 4.00 %

MAPF Performance: May 2012

Sunday, June 3rd, 2012

The fund was approximately even with the index in May, as outperformance in high-coupon GWO issues and BNA.PR.C was offset by weakness in the low-coupon SLF and MFC issues.

The fund’s Net Asset Value per Unit as of the close May 31, 2012, was 10.3798.

Returns to May, 2012
Period MAPF BMO-CM “50” Index TXPR
Total Return
CPD
according to
Blackrock
One Month -0.61% -0.73% -0.56% -0.59%
Three Months -1.17% +0.06% -0.23% -0.29%
One Year -0.50% +3.91% +3.29% +2.83%
Two Years (annualized) +12.45% +10.51% +8.65% N/A
Three Years (annualized) +14.93% +10.77% +8.57% +7.87%
Four Years (annualized) +17.81% +6.56% +4.88% N/A
Five Years (annualized) +14.62% +4.80%   +2.56%
Six Years (annualized) +12.99% +4.16%    
Seven Years (annualized) +11.85% +4.00%    
Eight Years (annualized) +11.64% +4.35%    
Nine Years (annualized) +12.67% +4.33%    
Ten Years (annualized) +12.04% +4.68%    
Eleven Years (annualized) +12.43% +4.42%    
MAPF returns assume reinvestment of distributions, and are shown after expenses but before fees.
CPD Returns are for the NAV and are after all fees and expenses.
* CPD does not directly report its two- or four-year returns.
Figures for Omega Preferred Equity (which are after all fees and expenses) for 1-, 3- and 12-months are -0.47%, -0.12% and +3.42%, respectively, according to Morningstar after all fees & expenses. Three year performance is +9.45%.
Figures for Jov Leon Frazer Preferred Equity Fund Class I Units (which are after all fees and expenses) for 1-, 3- and 12-months are -0.59%, -0.52% and +1.91% respectively, according to Morningstar. Three Year performance is +6.33%
Figures for Manulife Preferred Income Fund (formerly AIC Preferred Income Fund) (which are after all fees and expenses) for 1-, 3- and 12-months are -0.59%, -0.54% & +2.88%, respectively. Three Year performance is +6.09%
Figures for Horizons AlphaPro Preferred Share ETF (which are after all fees and expenses) for 1-, 3- and 12-months are -0.47%, +0.06% & +4.76%, respectively.

MAPF returns assume reinvestment of dividends, and are shown after expenses but before fees. Past performance is not a guarantee of future performance. You can lose money investing in Malachite Aggressive Preferred Fund or any other fund. For more information, see the fund’s main page. The fund is available either directly from Hymas Investment Management or through a brokerage account at Odlum Brown Limited.

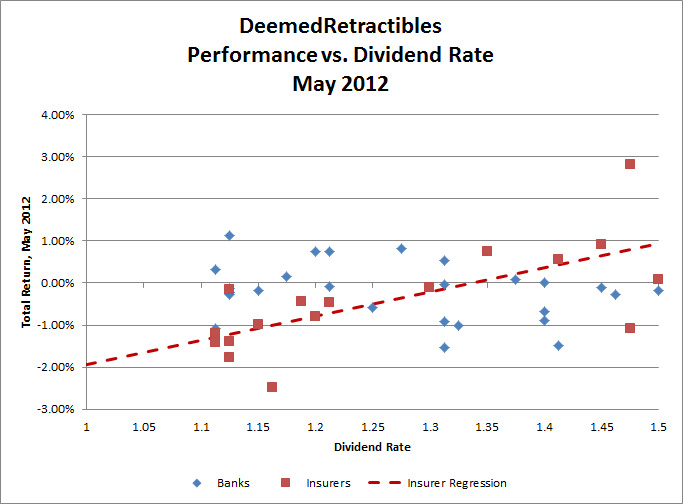
In cases such as this it is often possible to explain deviations through a change in the Implied Volatility of the embedded call option in StraightPerpetuals – as was the case in June 2008. Accordingly, we compare the month’s performance of individual DeemedRetractible issues with their Dividend Rate:

Click for Big

This actually works quite well, in sharp distinction to the situation last month – there is a clear correlation (44%) between dividend rate and May 2012 performance (about 290bp over the range of the chart).

This is illustrative of a problem that has bedevilled the market over the past year – the OSFI decision not to grandfather Straight Perpetuals as Tier 1 bank capital, and their continued foot-dragging regarding a decision on insurer Straight Perpetuals has segmented the market to the point where trading has become much more difficult. The fund has done well by trading between GWO issues, which have a good range of annual coupons, but is “stuck” in the MFC and SLF issues, which have a much narrower range of coupon. Until the market became so grossly segmented, this was not so much of a problem – but now banks are not available to swap into (because they are so expensive) and non-regulated companies are likewise unavailable (because they are not DeemedRetractibles; they should not participate in the increase in value that will follow the OSFI decision I anticipate). The fund’s portfolio is, in effect ‘locked in’ to the MFC & SLF issues due to projected gains from a future OSFI decision, to the detriment of trading gains.

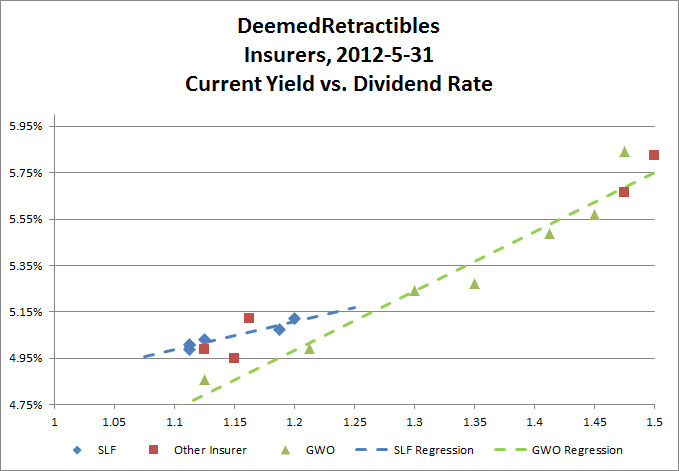
The behaviour of the SLF DeemedRetractibles continues to be puzzling:

SLF DeemedRetractibles
Ticker Dividend
Rate
Quote
5/31
May 2012
Total Return
Current
Yield
4/30
YTW
4/30
SLF.PR.A 1.1875 23.40-45

-0.43% 5.07% 5.60%
SLF.PR.B 1.20 23.43-58 -0.80% 5.12% 5.63%
SLF.PR.C 1.1125 22.21-25 -1.42% 5.01% 5.97%
SLF.PR.D 1.1125 22.30-39 -1.20% 4.99% 5.92%
SLF.PR.E 1.125 22.36-41 -1.40% 5.03% 5.93%

SLF.PR.A and SLF.PR.B are incorporated in the index; SLF.PR.C, SLF.PR.D and SLF.PR.E are in the fund. As may be seen from the following chart, the relationship between Current Yield and Annual Dividend Rate is quite different for GWO and SLF:

Click for big

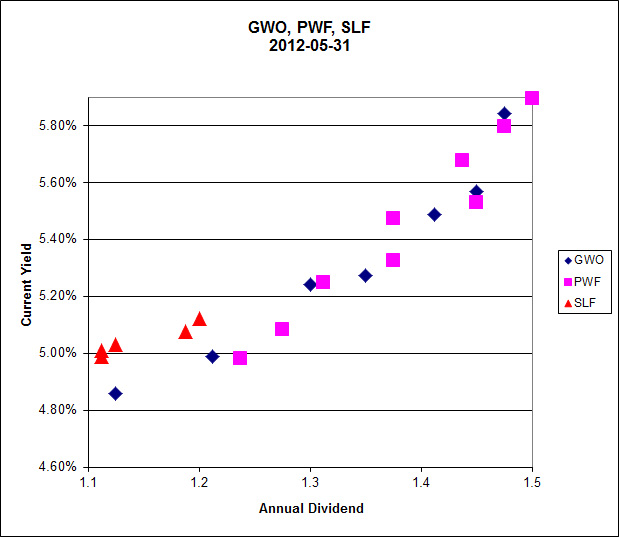
SLF DeemedRetractibles may be compared with PWF and GWO:

Click for Big

It is quite apparent that that the market continues to treat regulated issues (SLF, GWO) no differently from unregulated issues (PWF).

Those of you who have been paying attention will remember that in a “normal” market (which we have not seen in over a year) the slope of this line is related to the implied volatility of yields in Black-Scholes theory, as discussed in the January, 2010, edition of PrefLetter. The relationship is still far too large to be explained by Implied Volatility – the numbers still indicate an overwhelming degree of directionality in the market’s price expectations.

Sometimes everything works … sometimes it’s 50-50 … sometimes nothing works. The fund seeks to earn incremental return by selling liquidity (that is, taking the other side of trades that other market participants are strongly motivated to execute), which can also be referred to as ‘trading noise’. There were a lot of strongly motivated market participants during the Panic of 2007, generating a lot of noise! Unfortunately, the conditions of the Panic may never be repeated in my lifetime … but the fund will simply attempt to make trades when swaps seem profitable, without worrying about the level of monthly turnover.

There’s plenty of room for new money left in the fund. I have shown in recent issues of PrefLetter that market pricing for FixedResets is demonstrably stupid and I have lots of confidence – backed up by my bond portfolio management experience in the markets for Canadas and Treasuries, and equity trading on the NYSE & TSX – that there is enough demand for liquidity in any market to make the effort of providing it worthwhile (although the definition of “worthwhile” in terms of basis points of outperformance changes considerably from market to market!) I will continue to exert utmost efforts to outperform but it should be borne in mind that there will almost inevitably be periods of underperformance in the future.

The yields available on high quality preferred shares remain elevated, which is reflected in the current estimate of sustainable income.

Calculation of MAPF Sustainable Income Per Unit
Month NAVPU Portfolio
Average
YTW
Leverage
Divisor
Securities
Average
YTW
Capital
Gains
Multiplier
Sustainable
Income
per
current
Unit
June, 2007 9.3114 5.16% 1.03 5.01% 1.3240 0.3524
September 9.1489 5.35% 0.98 5.46% 1.3240 0.3773
December, 2007 9.0070 5.53% 0.942 5.87% 1.3240 0.3993
March, 2008 8.8512 6.17% 1.047 5.89% 1.3240 0.3938
June 8.3419 6.034% 0.952 6.338% 1.3240 $0.3993
September 8.1886 7.108% 0.969 7.335% 1.3240 $0.4537
December, 2008 8.0464 9.24% 1.008 9.166% 1.3240 $0.5571
March 2009 $8.8317 8.60% 0.995 8.802% 1.3240 $0.5872
June 10.9846 7.05% 0.999 7.057% 1.3240 $0.5855
September 12.3462 6.03% 0.998 6.042% 1.3240 $0.5634
December 2009 10.5662 5.74% 0.981 5.851% 1.1141 $0.5549
March 2010 10.2497 6.03% 0.992 6.079% 1.1141 $0.5593
June 10.5770 5.96% 0.996 5.984% 1.1141 $0.5681
September 11.3901 5.43% 0.980 5.540% 1.1141 $0.5664
December 2010 10.7659 5.37% 0.993 5.408% 1.0298 $0.5654
March, 2011 11.0560 6.00% 0.994 5.964% 1.0298 $0.6403
June 11.1194 5.87% 1.018 5.976% 1.0298 $0.6453
September 10.2709 6.10%
Note
1.001 6.106% 1.0298 $0.6090
December, 2011 10.0793 5.63%
Note
1.031 5.805% 1.0000 $0.5851
March, 2012 10.3944 5.13%
Note
0.996 5.109% 1.0000 $0.5310
May, 2012 10.3798 5.34%
Note
1.004 5.361% 1.0000 $0.5564
NAVPU is shown after quarterly distributions of dividend income and annual distribution of capital gains.
Portfolio YTW includes cash (or margin borrowing), with an assumed interest rate of 0.00%
The Leverage Divisor indicates the level of cash in the account: if the portfolio is 1% in cash, the Leverage Divisor will be 0.99
Securities YTW divides “Portfolio YTW” by the “Leverage Divisor” to show the average YTW on the securities held; this assumes that the cash is invested in (or raised from) all securities held, in proportion to their holdings.
The Capital Gains Multiplier adjusts for the effects of Capital Gains Dividends. On 2009-12-31, there was a capital gains distribution of $1.989262 which is assumed for this purpose to have been reinvested at the final price of $10.5662. Thus, a holder of one unit pre-distribution would have held 1.1883 units post-distribution; the CG Multiplier reflects this to make the time-series comparable. Note that Dividend Distributions are not assumed to be reinvested.
Sustainable Income is the resultant estimate of the fund’s dividend income per current unit, before fees and expenses. Note that a “current unit” includes reinvestment of prior capital gains; a unitholder would have had the calculated sustainable income with only, say, 0.9 units in the past which, with reinvestment of capital gains, would become 1.0 current units.
DeemedRetractibles are comprised of all Straight Perpetuals (both PerpetualDiscount and PerpetualPremium) issued by BMO, BNS, CM, ELF, GWO, HSB, IAG, MFC, NA, RY, SLF and TD, which are not exchangable into common at the option of the company (definition refined in May). These issues are analyzed as if their prospectuses included a requirement to redeem at par on or prior to 2022-1-31, in addition to the call schedule explicitly defined. See OSFI Does Not Grandfather Extant Tier 1 Capital, CM.PR.D, CM.PR.E, CM.PR.G: Seeking NVCC Status and the January, February, March and June, 2011, editions of PrefLetter for the rationale behind this analysis.
Yields for September, 2011, to January, 2012, were calculated by imposing a cap of 10% on the yields of YLO issues held, in order to avoid their extremely high calculated yields distorting the calculation and to reflect the uncertainty in the marketplace that these yields will be realized. Commencing February, 2012, yields on these issues have been set to zero.

Significant positions were held in DeemedRetractible and FixedReset issues on May 31; all of these currently have their yields calculated with the presumption that they will be called by the issuers at par prior to 2022-1-31. This presents another complication in the calculation of sustainable yield. The fund also holds a position various SplitShare issues which also have their yields calculated with the expectation of a maturity at par.

I will no longer show calculations that assume the conversion of the entire portfolio into PerpetualDiscounts, as there are currently only eight such issues of investment grade, from only four issuer groups. Additionally, the fund has no holdings of these issues.

Different assumptions lead to different results from the calculation, but the overall positive trend is apparent. I’m very pleased with the long-term results! It will be noted that if there was no trading in the portfolio, one would expect the sustainable yield to be constant (before fees and expenses). The success of the fund’s trading is showing up in

  • the very good performance against the index
  • the long term increases in sustainable income per unit

As has been noted, the fund has maintained a credit quality equal to or better than the index; outperformance is due to constant exploitation of trading anomalies.

Again, there are no predictions for the future! The fund will continue to trade between issues in an attempt to exploit market gaps in liquidity, in an effort to outperform the index and keep the sustainable income per unit – however calculated! – growing.

MAPF Portfolio Composition: May 2012

Saturday, June 2nd, 2012

Turnover picked up in May, to about 11%

Sectoral distribution of the MAPF portfolio on May 31 was as follows:

MAPF Sectoral Analysis 2012-5-31
HIMI Indices Sector Weighting YTW ModDur
Ratchet 0% N/A N/A
FixFloat 0% N/A N/A
Floater 0% N/A N/A
OpRet 0% N/A N/A
SplitShare 9.8% (+0.2) 5.95% 5.66
Interest Rearing 0% N/A N/A
PerpetualPremium 0.0% N/A N/A
PerpetualDiscount 0.0% (-0.3) N/A N/A
Fixed-Reset 18.4% (-0.4) 3.41% 1.88
Deemed-Retractible 61.8% (+0.2) 5.65% 7.46
Scraps (Various) 9.5% (-0.1) 6.65% (see note) 10.24 (see note)
Cash +0.4% (+0.3) 0.00% 0.00
Total 100% 5.34% 6.50
Yields for the YLO preferreds have been set at 0% for calculation purposes, and their durations at 0.00, due to the the company’s decision to suspend preferred dividends.
Totals and changes will not add precisely due to rounding. Bracketted figures represent change from April month-end. Cash is included in totals with duration and yield both equal to zero.
DeemedRetractibles are comprised of all Straight Perpetuals (both PerpetualDiscount and PerpetualPremium) issued by BMO, BNS, CM, ELF, GWO, HSB, IAG, MFC, NA, RY, SLF and TD, which are not exchangable into common at the option of the company. These issues are analyzed as if their prospectuses included a requirement to redeem at par on or prior to 2022-1-31, in addition to the call schedule explicitly defined. See OSFI Does Not Grandfather Extant Tier 1 Capital, CM.PR.D, CM.PR.E, CM.PR.G: NVCC Status Confirmed and the January, February, March and June, 2011, editions of PrefLetter for the rationale behind this analysis.

The “total” reflects the un-leveraged total portfolio (i.e., cash is included in the portfolio calculations and is deemed to have a duration and yield of 0.00.). MAPF will often have relatively large cash balances, both credit and debit, to facilitate trading. Figures presented in the table have been rounded to the indicated precision.

Credit distribution is:

MAPF Credit Analysis 2012-5-31
DBRS Rating Weighting
Pfd-1 0 (0)
Pfd-1(low) 51.6% (-0.3)
Pfd-2(high) 28.6% (+0.2)
Pfd-2 0 (0)
Pfd-2(low) 9.8% (-0.2)
Pfd-3(high) 1.5% (+0.5)
Pfd-3 2.4% (0)
Pfd-4(high) 1.6% (-1.9)
Pfd-4 2.3% (0)
Pfd-4(low) 1.6% (+1.6)
Pfd-5(low) 0.2% (-0.1)
Cash +0.4% (+0.3)
Totals will not add precisely due to rounding. Bracketted figures represent change from April month-end.
A position held in CSE preferreds has been assigned to Pfd-4(high)

Liquidity Distribution is:

MAPF Liquidity Analysis 2012-5-31
Average Daily Trading Weighting
<$50,000 13.4% (+2.9)
$50,000 – $100,000 19.6% (+0.4)
$100,000 – $200,000 27.9% (+0.7)
$200,000 – $300,000 33.2% (+6.1)
>$300,000 5.4% (-10.5)
Cash +0.4% (+0.3)
Totals will not add precisely due to rounding. Bracketted figures represent change from April month-end.

MAPF is, of course, Malachite Aggressive Preferred Fund, a “unit trust” managed by Hymas Investment Management Inc. Further information and links to performance, audited financials and subscription information are available the fund’s web page. The fund may be purchased either directly from Hymas Investment Management or through a brokerage account at Odlum Brown Limited. A “unit trust” is like a regular mutual fund, but is sold by offering memorandum rather than prospectus. This is cheaper, but means subscription is restricted to “accredited investors” (as defined by the Ontario Securities Commission) or those who subscribe for $150,000+. Fund past performances are not a guarantee of future performance. You can lose money investing in MAPF or any other fund.

A similar portfolio composition analysis has been performed on the Claymore Preferred Share ETF (symbol CPD) as of August 31, 2011, and published in the October, 2011, PrefLetter. While direct comparisons are difficult due to the introduction of the DeemedRetractible class of preferred share (see above) it is fair to say:

  • MAPF credit quality is better
  • MAPF liquidity is a lower
  • MAPF Yield is higher
  • Weightings in
    • MAPF is much more exposed to DeemedRetractibles
    • MAPF is much less exposed to Operating Retractibles
    • MAPF is much more exposed to SplitShares
    • MAPF is less exposed to FixFloat / Floater / Ratchet
    • MAPF weighting in FixedResets is much lower

June 1, 2012

Friday, June 1st, 2012

Berlusconi is hardly considered an elder statesman, but he’s indicative of the mood:

Former Premier Silvio Berlusconi said Italy should say “ciao, euro” if the European Central Bank doesn’t start printing money to tackle the debt crisis and Germany should quit the single currency if it won’t back a bolder role for ECB.

“The economic crisis can’t be solved” in Italy, Berlusconi said in comments posted on his party’s website today. He called on Prime Minister Mario Monti to “change his political line” and lobby European leaders to back a money- printing campaign by the Frankfurt-based ECB. If the central bank doesn’t become a “lender of last resort,” Italy should say “ciao, euro,” the former premier said.

The malaise may spread to America:

U.S. stocks tumbled, erasing the 2012 advance in the Dow Jones Industrial Average, as employers added the fewest workers in a year, the unemployment rate rose while manufacturing output shrank in Europe and slowed in China.

Equities slumped as American employers in May added the fewest workers in a year and the unemployment rate unexpectedly increased as job-seekers re-entered the workforce. Payrolls climbed by 69,000 last month, less than the most-pessimistic forecast in a Bloomberg News survey, after a revised 77,000 gain in April that was smaller than initially estimated. The median estimate called for a 150,000 May advance. The jobless rate rose to 8.2 percent from 8.1 percent, while hours worked declined.

The Treasury market was pleased:

The benchmark 10-year yield fell nine basis points, or 0.09 percentage point, to 1.47 percent in New York time, according to Bloomberg Bond Traders prices. Thirty-year bond yields declined nine basis points to 2.55 percent, reaching 2.5089 percent, below the record 2.5090 percent on Dec. 18, 2008, according to Federal Reserve figures beginning in 1953.

Things are going the other way in Spain:

Spain’s campaign to cajole the European Central Bank into buying its bonds is backfiring.

The nation’s 10-year borrowing cost has jumped more than half a point to 6.62 percent since Jaime Garcia-Legaz, the deputy minister for trade, became the country’s first official to urge the ECB to support its bonds on April 13. Yield increases accelerated after May 24 when Prime Minister Mariano Rajoy signalled that Spain’s debt sustainability may be in danger, and peaked at 6.70 percent on May 30, moving closer to the 7 percent level that forced Greece, Portugal and Ireland to seek outside aid.

The morons at the Toronto Water department have given the city another black eye:

Subway service around Toronto’s Union Station remains suspended Friday evening after an apparent sewer back-up or break sent water gushing into Canada’s busiest rail hub.

The flooding has spread to the PATH system, closing the portion of the underground retail concourse south of Wellington Street, Mr. Ross added.

The scene around Union Station Friday was chaotic. Toronto police cars with lights flashing shut down the section of Front Street from York to Yonge streets.

Will wonders never cease? There’s a prominent Republican speaking halfway reasonably:

Former Florida Governor Jeb Bush, in a break with his party, said he could support tax increases to help reduce the federal government’s budget deficit.

The brother of former President George W. Bush told a congressional panel in Washington today that he could back a theoretical deficit-reduction package that would include $1 in tax increases for every $10 in spending cuts.

Fortunately, there are other Republicans maintaining the party’s reputation by supporting Al-Qaeda’s thesis that there’s some kind of religious war going on:

The opponents of the Tennessee mosque have fought for two years to stop construction. During lengthy hearings in 2010, they presented testimony that in effect put Islam on trial. A string of witnesses questioned whether Islam is a legitimate religion and promoted a theory that American Muslims want to replace the Constitution with extremist Islamic law and the mosque was a part of that plot.

The mosque also became an issue in a local congressional race, with Republican candidate Lou Ann Zelenik calling it a threat to the state’s moral and political foundation.

Later, a dump truck on the site was burned in what federal officials determined was arson.

It was a mixed day for the Canadian preferred share market, with PerpetualPremiums gaining 10bp, FixedResets up 3bp and DeemedRetractibles down 14bp. Volatility was good. Volume was light.

HIMIPref™ Preferred Indices
These values reflect the December 2008 revision of the HIMIPref™ Indices

Values are provisional and are finalized monthly
Index Mean
Current
Yield
(at bid)
Median
YTW
Median
Average
Trading
Value
Median
Mod Dur
(YTW)
Issues Day’s Perf. Index Value
Ratchet 0.00 % 0.00 % 0 0.00 0 -1.4095 % 2,436.9
FixedFloater 4.50 % 3.85 % 30,692 17.56 1 -0.5647 % 3,506.4
Floater 2.96 % 2.97 % 74,275 19.74 3 -1.4095 % 2,631.2
OpRet 4.81 % 3.04 % 40,525 1.04 5 -0.2623 % 2,498.5
SplitShare 5.31 % -1.44 % 49,629 0.54 4 -0.1700 % 2,697.0
Interest-Bearing 0.00 % 0.00 % 0 0.00 0 -0.2623 % 2,284.6
Perpetual-Premium 5.46 % 2.95 % 75,295 0.61 25 0.0972 % 2,226.9
Perpetual-Discount 5.07 % 5.09 % 78,300 15.26 8 0.3507 % 2,447.1
FixedReset 5.07 % 3.31 % 192,932 7.83 70 0.0320 % 2,384.3
Deemed-Retractible 5.02 % 3.87 % 158,304 2.99 45 -0.1418 % 2,303.5
Performance Highlights
Issue Index Change Notes
BAM.PR.C Floater -2.35 % YTW SCENARIO
Maturity Type : Limit Maturity
Maturity Date : 2042-06-01
Maturity Price : 17.48
Evaluated at bid price : 17.48
Bid-YTW : 3.03 %
SLF.PR.E Deemed-Retractible -1.39 % YTW SCENARIO
Maturity Type : Hard Maturity
Maturity Date : 2022-01-31
Maturity Price : 25.00
Evaluated at bid price : 22.05
Bid-YTW : 6.12 %
SLF.PR.D Deemed-Retractible -1.17 % YTW SCENARIO
Maturity Type : Hard Maturity
Maturity Date : 2022-01-31
Maturity Price : 25.00
Evaluated at bid price : 22.04
Bid-YTW : 6.07 %
FTS.PR.E OpRet -1.05 % YTW SCENARIO
Maturity Type : Call
Maturity Date : 2013-06-01
Maturity Price : 25.75
Evaluated at bid price : 26.32
Bid-YTW : 2.53 %
BAM.PR.R FixedReset 1.07 % YTW SCENARIO
Maturity Type : Limit Maturity
Maturity Date : 2042-06-01
Maturity Price : 23.65
Evaluated at bid price : 26.48
Bid-YTW : 3.61 %
BAM.PR.M Perpetual-Discount 1.32 % YTW SCENARIO
Maturity Type : Limit Maturity
Maturity Date : 2042-06-01
Maturity Price : 23.37
Evaluated at bid price : 23.77
Bid-YTW : 5.06 %
IAG.PR.A Deemed-Retractible 1.38 % YTW SCENARIO
Maturity Type : Hard Maturity
Maturity Date : 2022-01-31
Maturity Price : 25.00
Evaluated at bid price : 23.57
Bid-YTW : 5.35 %
Volume Highlights
Issue Index Shares
Traded
Notes
IAG.PR.G FixedReset 353,936 New issue settled today.
YTW SCENARIO
Maturity Type : Hard Maturity
Maturity Date : 2022-01-31
Maturity Price : 25.00
Evaluated at bid price : 25.05
Bid-YTW : 4.24 %
RY.PR.F Deemed-Retractible 54,400 RBC crossed 49,700 at 25.65.
YTW SCENARIO
Maturity Type : Call
Maturity Date : 2016-05-24
Maturity Price : 25.00
Evaluated at bid price : 25.61
Bid-YTW : 3.83 %
BMO.PR.N FixedReset 52,700 National crossed 50,000 at 26.45.
YTW SCENARIO
Maturity Type : Call
Maturity Date : 2014-02-25
Maturity Price : 25.00
Evaluated at bid price : 26.46
Bid-YTW : 3.11 %
IFC.PR.A FixedReset 50,000 TD crossed 49,400 at 25.40.
YTW SCENARIO
Maturity Type : Hard Maturity
Maturity Date : 2022-01-31
Maturity Price : 25.00
Evaluated at bid price : 25.41
Bid-YTW : 3.63 %
RY.PR.B Deemed-Retractible 42,615 Desjardins crossed 34,700 at 25.76.
YTW SCENARIO
Maturity Type : Call
Maturity Date : 2015-08-24
Maturity Price : 25.00
Evaluated at bid price : 25.80
Bid-YTW : 3.70 %
CM.PR.L FixedReset 41,935 Nesbitt crossed 40,000 at 26.68.
YTW SCENARIO
Maturity Type : Call
Maturity Date : 2014-04-30
Maturity Price : 25.00
Evaluated at bid price : 26.62
Bid-YTW : 3.30 %
There were 18 other index-included issues trading in excess of 10,000 shares.
Wide Spread Highlights
Issue Index Quote Data and Yield Notes
ENB.PR.A Perpetual-Premium Quote: 25.52 – 25.85
Spot Rate : 0.3300
Average : 0.2195

YTW SCENARIO
Maturity Type : Call
Maturity Date : 2012-07-01
Maturity Price : 25.00
Evaluated at bid price : 25.52
Bid-YTW : -18.65 %

TCA.PR.X Perpetual-Premium Quote: 52.03 – 52.49
Spot Rate : 0.4600
Average : 0.3619

YTW SCENARIO
Maturity Type : Call
Maturity Date : 2013-10-15
Maturity Price : 50.00
Evaluated at bid price : 52.03
Bid-YTW : 2.95 %

FTS.PR.E OpRet Quote: 26.32 – 26.60
Spot Rate : 0.2800
Average : 0.1878

YTW SCENARIO
Maturity Type : Call
Maturity Date : 2013-06-01
Maturity Price : 25.75
Evaluated at bid price : 26.32
Bid-YTW : 2.53 %

BAM.PR.O OpRet Quote: 25.73 – 26.00
Spot Rate : 0.2700
Average : 0.1844

YTW SCENARIO
Maturity Type : Option Certainty
Maturity Date : 2013-06-30
Maturity Price : 25.00
Evaluated at bid price : 25.73
Bid-YTW : 3.04 %

BNA.PR.E SplitShare Quote: 24.52 – 24.90
Spot Rate : 0.3800
Average : 0.2959

YTW SCENARIO
Maturity Type : Hard Maturity
Maturity Date : 2017-12-10
Maturity Price : 25.00
Evaluated at bid price : 24.52
Bid-YTW : 5.27 %

HSB.PR.C Deemed-Retractible Quote: 25.65 – 25.90
Spot Rate : 0.2500
Average : 0.1701

YTW SCENARIO
Maturity Type : Call
Maturity Date : 2013-06-30
Maturity Price : 25.25
Evaluated at bid price : 25.65
Bid-YTW : 4.37 %

IAG.PR.G Firm on Good Volume

Friday, June 1st, 2012

Industrial Alliance Insurance and Financial Services Inc. has announced:

that it has closed its previously announced bought deal public offering of Non-Cumulative 5-Year Rate Reset Class A Preferred Shares Series G (the “Series G Preferred Shares”) at a price of $25.00 per Series G Preferred Share purchased by a syndicate of underwriters co-led by Scotiabank and RBC Capital Markets. The offering results in a total of 6,000,000 Series G Preferred Shares being issued today by Industrial Alliance for gross proceeds of $150,000,000.

The net proceeds of this offering will be used for general corporate purposes and will be added to Industrial Alliance’s capital base.

The Series G Preferred Shares were issued under a prospectus supplement dated May 25, 2012 to the short form base shelf prospectus of Industrial Alliance dated April 29, 2011. Details of the offering are set out in the prospectus supplement which is available on SEDAR at www.sedar.com.

IAG.PR.G is a FixedReset, 4.30%+285, announced May 24. The issue will be tracked by HIMIPref™ and assigned to the FixedReset subindex.

IAG.PR.G traded 353,936 shares today in a range of 24.90-09 before closing at 25.05-08, 6×35. Vital statistics are:

IAG.PR.G FixedReset YTW SCENARIO
Maturity Type : Hard Maturity
Maturity Date : 2022-01-31
Maturity Price : 25.00
Evaluated at bid price : 25.05
Bid-YTW : 4.24 %

May 31, 2012

Friday, June 1st, 2012

It would appear that it is the banks who shave the Spanish barber:

Bankia group risks dragging the rest of Spain into its vortex

As Spain’s third-biggest bank asks Prime Minister Mariano Rajoy’s government for 19 billion euros ($24 billion), international investors are tallying the potential cost for the rest of the industry and betting he won’t be able to foot the bill. With foreign investors shunning Spanish debt, leaving national banks to fund the government, the nation’s 10-year borrowing costs compared with Germany’s are near a record.

Spain needs to bail out lenders still reeling from the collapse of the real-estate boom while its own access to funding increasingly depends on domestic banks being kept afloat by the European Central Bank’s refinancing operations. Rising borrowing costs are putting pressure on Rajoy’s five month-old government to join Greece, Portugal and Ireland in seeking a rescue that would be the European Union’s biggest.

There’s capital flight in Spain:

More than €97-billion in capital fled Spain in the first quarter of the year as the country’s crisis escalated along with the troubles of the euro zone.

That stunning number, published today by the country’s central bank and reported in The Financial Times, represents almost 10 per cent of Spain’s gross domestic product.

I recall William Shirer stressed capital flight as a destabilizing factor of the French Third Republic. But that’s just panic.

There is NO PANIC. Let me repeat that: there is NO PANIC! There is absolutely NO PANIC anywhere and anybody who might panic will be shot, not that anybody would panic:

The International Monetary Fund said it is not preparing financial aid for Spain and the country denied any talks about a bailout even as its borrowing costs approach euro-era records.

“There’s been no request for financial assistance from Spain and the IMF is not making plans for financial assistance to Spain,” Gerry Rice, the IMF’s director of external relations, told reporters in Washington today.

Hate your neighbors? Want to take revenge for that time their cat peed on your lawn? The good folks of the federal government are offering a new way to denounce your neighbors!

The Copyright Board of Canada has, for the first time, decided to charge fees to anyone who uses recorded music as part of a public event. That means anyone who plans on using tunes to get the party started will need to dig a little deeper before hitting play on the iPod.

The new rules include any event in which music is played – weddings, ice shows, street parties, circuses, parades and karaoke bars are all named in the official notice from the country’s copyright board.

Re:Sound does employ inspectors, but would only undertake an inspection if complaints were received.

Denounce your neighbor today and help to bring back Stalinism!

S&P affirmed CSE.PR.A:

  • We are affirming our ratings, including our ‘BB+’ long-term corporate credit rating, on Capstone Infrastructure Corp.
  • In addition, we are removing the ratings from CreditWatch with developing implications.
  • The affirmation and CreditWatch removal reflects our view of the progress that the company has made in regard to the various initiatives to address its liquidity.
  • The stable outlook reflects our view that Capstone benefits from contracted revenue and insulation from electricity demand and price risks
    provided by power purchase agreements with investment-grade off-takers.

We could raise the ratings if the company takes steps to improve its liquidity (for example, through a reduction in its common share dividend) such that it is consistent with our criteria description of “adequate” and demonstrates concrete steps in recontracting the expiring PPAs while maintaining or improving its significant financial risk profile. We expect the company to continue to focus its growth strategy on assets with cash-flow predictability supported by either favorable contracts or regulation.

We could consider lowering the ratings should Capstone’s overall cash flow quality weaken materially from its moderate level of stability. This could come from major operational disruptions in its generation facilities or acquisition of assets with materially higher cash flow variability. In addition, we could consider a negative rating action if we expect the company’s cash-flow coverage measures to weaken materially, with partially consolidated cash flow to interest falling below 2.7x or partially consolidated cash flow to total recourse debt falling below 20% on a sustained basis, in accordance with our criteria for project developers. This could happen if it increases its reliance on debt financing to support its growth initiatives or its distribution. In addition, failure to renew expiring PPAs or replace them with acquisitions of other contracted assets could also lead to a downgrade in the medium term.

DBRS affirmed DGS.PR.A at Pfd-3:

DBRS has today confirmed the rating of the Preferred Shares of Dividend Growth Split Corp. (the Company) at Pfd-3. In December 2007, the Company issued approximately 1.5 million Preferred Shares (at $10 each) and an equal number of Class A Shares (at $15 each). The scheduled redemption date for both classes of shares issued is November 30, 2014.

Since the rating was last confirmed in May 2011, following the completion of a merger of the Company with Brompton Equity Split Corp., the net asset value (NAV) of the Company has remained fairly stable, with downside protection fluctuating between 38% and 47%. The current downside protection (as of April 26, 2012) is approximately 42%. Based on the current yields of the underlying securities in the Portfolio, the dividend coverage ratio is approximately 1.43 times as of April 30, 2012, so the dividends received on the Portfolio fully cover the Preferred Share distributions.

The Canadian preferred share market closed the month with a mildly negative day, with PerpetualPremiums flat, FixedResets off 4bp and DeemedRetractibles down 6bp. Volatility was good. Volume was average.

HIMIPref™ Preferred Indices
These values reflect the December 2008 revision of the HIMIPref™ Indices

Values are provisional and are finalized monthly
Index Mean
Current
Yield
(at bid)
Median
YTW
Median
Average
Trading
Value
Median
Mod Dur
(YTW)
Issues Day’s Perf. Index Value
Ratchet 0.00 % 0.00 % 0 0.00 0 -0.2405 % 2,471.7
FixedFloater 4.47 % 3.85 % 30,929 17.62 1 -1.1628 % 3,526.4
Floater 2.92 % 2.94 % 69,922 19.82 3 -0.2405 % 2,668.8
OpRet 4.79 % 2.18 % 38,998 1.05 5 0.4106 % 2,505.0
SplitShare 5.30 % -3.50 % 51,679 0.55 4 -0.6212 % 2,701.5
Interest-Bearing 0.00 % 0.00 % 0 0.00 0 0.4106 % 2,290.6
Perpetual-Premium 5.46 % 2.87 % 77,772 0.61 25 -0.0024 % 2,224.7
Perpetual-Discount 5.09 % 5.10 % 79,491 15.24 8 0.1705 % 2,438.5
FixedReset 5.08 % 3.33 % 194,827 7.68 69 -0.0359 % 2,383.6
Deemed-Retractible 5.01 % 3.84 % 159,547 2.92 45 -0.0616 % 2,306.8
Performance Highlights
Issue Index Change Notes
FBS.PR.C SplitShare -2.86 % YTW SCENARIO
Maturity Type : Call
Maturity Date : 2012-12-15
Maturity Price : 10.00
Evaluated at bid price : 10.52
Bid-YTW : -4.99 %
GWO.PR.J FixedReset -1.73 % YTW SCENARIO
Maturity Type : Call
Maturity Date : 2013-12-31
Maturity Price : 25.00
Evaluated at bid price : 25.55
Bid-YTW : 4.26 %
MFC.PR.B Deemed-Retractible -1.60 % YTW SCENARIO
Maturity Type : Hard Maturity
Maturity Date : 2022-01-31
Maturity Price : 25.00
Evaluated at bid price : 22.70
Bid-YTW : 5.91 %
BAM.PR.G FixedFloater -1.16 % YTW SCENARIO
Maturity Type : Limit Maturity
Maturity Date : 2042-05-31
Maturity Price : 22.14
Evaluated at bid price : 21.25
Bid-YTW : 3.85 %
PWF.PR.M FixedReset 1.00 % YTW SCENARIO
Maturity Type : Call
Maturity Date : 2014-01-31
Maturity Price : 25.00
Evaluated at bid price : 26.20
Bid-YTW : 3.35 %
IAG.PR.A Deemed-Retractible 1.04 % YTW SCENARIO
Maturity Type : Hard Maturity
Maturity Date : 2022-01-31
Maturity Price : 25.00
Evaluated at bid price : 23.25
Bid-YTW : 5.52 %
BAM.PR.O OpRet 1.09 % YTW SCENARIO
Maturity Type : Option Certainty
Maturity Date : 2013-06-30
Maturity Price : 25.00
Evaluated at bid price : 25.96
Bid-YTW : 2.18 %
FTS.PR.E OpRet 1.10 % YTW SCENARIO
Maturity Type : Call
Maturity Date : 2013-06-01
Maturity Price : 25.75
Evaluated at bid price : 26.60
Bid-YTW : 1.44 %
BAM.PR.N Perpetual-Discount 1.50 % YTW SCENARIO
Maturity Type : Limit Maturity
Maturity Date : 2042-05-31
Maturity Price : 23.19
Evaluated at bid price : 23.65
Bid-YTW : 5.08 %
RY.PR.Y FixedReset 7.36 % Reversing yesterday’s nonsense.
YTW SCENARIO
Maturity Type : Call
Maturity Date : 2014-11-24
Maturity Price : 25.00
Evaluated at bid price : 26.40
Bid-YTW : 3.79 %
Volume Highlights
Issue Index Shares
Traded
Notes
PWF.PR.M FixedReset 184,805 Desjardins crossed 181,000 at 26.10.
YTW SCENARIO
Maturity Type : Call
Maturity Date : 2014-01-31
Maturity Price : 25.00
Evaluated at bid price : 26.20
Bid-YTW : 3.35 %
BMO.PR.N FixedReset 115,282 National crossed 106,100 at 26.45.
YTW SCENARIO
Maturity Type : Call
Maturity Date : 2014-02-25
Maturity Price : 25.00
Evaluated at bid price : 26.47
Bid-YTW : 3.08 %
RY.PR.N FixedReset 97,205 National crossed blocks of 68,600 and 25,000, both at 26.25.
YTW SCENARIO
Maturity Type : Call
Maturity Date : 2014-02-24
Maturity Price : 25.00
Evaluated at bid price : 26.25
Bid-YTW : 3.35 %
PWF.PR.L Perpetual-Premium 85,324 Nesbitt crossed 83,900 at 25.15.
YTW SCENARIO
Maturity Type : Limit Maturity
Maturity Date : 2042-05-31
Maturity Price : 24.75
Evaluated at bid price : 25.08
Bid-YTW : 5.13 %
MFC.PR.A OpRet 65,760 Desjardins crossed 60,000 at 25.20.
YTW SCENARIO
Maturity Type : Soft Maturity
Maturity Date : 2015-12-18
Maturity Price : 25.00
Evaluated at bid price : 25.15
Bid-YTW : 3.87 %
CM.PR.L FixedReset 53,170 TD crossed 40,000 at 26.75.
YTW SCENARIO
Maturity Type : Call
Maturity Date : 2014-04-30
Maturity Price : 25.00
Evaluated at bid price : 26.50
Bid-YTW : 3.55 %
There were 35 other index-included issues trading in excess of 10,000 shares.
Wide Spread Highlights
Issue Index Quote Data and Yield Notes
GWO.PR.J FixedReset Quote: 25.55 – 26.05
Spot Rate : 0.5000
Average : 0.3051

YTW SCENARIO
Maturity Type : Call
Maturity Date : 2013-12-31
Maturity Price : 25.00
Evaluated at bid price : 25.55
Bid-YTW : 4.26 %

MFC.PR.A OpRet Quote: 25.15 – 25.49
Spot Rate : 0.3400
Average : 0.2256

YTW SCENARIO
Maturity Type : Soft Maturity
Maturity Date : 2015-12-18
Maturity Price : 25.00
Evaluated at bid price : 25.15
Bid-YTW : 3.87 %

W.PR.H Perpetual-Premium Quote: 25.53 – 25.87
Spot Rate : 0.3400
Average : 0.2258

YTW SCENARIO
Maturity Type : Call
Maturity Date : 2013-01-15
Maturity Price : 25.00
Evaluated at bid price : 25.53
Bid-YTW : 3.19 %

MFC.PR.D FixedReset Quote: 26.45 – 26.69
Spot Rate : 0.2400
Average : 0.1368

YTW SCENARIO
Maturity Type : Call
Maturity Date : 2014-06-19
Maturity Price : 25.00
Evaluated at bid price : 26.45
Bid-YTW : 3.51 %

MFC.PR.F FixedReset Quote: 24.11 – 24.46
Spot Rate : 0.3500
Average : 0.2494

YTW SCENARIO
Maturity Type : Hard Maturity
Maturity Date : 2022-01-31
Maturity Price : 25.00
Evaluated at bid price : 24.11
Bid-YTW : 3.81 %

GWO.PR.H Deemed-Retractible Quote: 24.30 – 24.57
Spot Rate : 0.2700
Average : 0.1766

YTW SCENARIO
Maturity Type : Hard Maturity
Maturity Date : 2022-01-31
Maturity Price : 25.00
Evaluated at bid price : 24.30
Bid-YTW : 5.20 %