Archive for September, 2014

BK.PR.A: Rights Offering and DBRS Upgrade

Friday, September 5th, 2014

Quadravest has announced:

Canadian Banc Corp. (the “Company”) announces that it will issue Rights to all Class A Shareholders thereby allowing existing shareholders to increase their investment in the Company. Each Class A Shareholder will be entitled to receive one Right for each Class A Share held as of the record date of August 25, 2014. Six Rights will entitle the holder to purchase a Unit consisting of one Class A Share at $14.18 and one Preferred Share at $10.00 for the total subscription price of $24.18. The Rights are exercisable at any time once issued and will expire at 5:00 p.m. (EST) on October 6, 2014.

The net proceeds from the subscription of Units will be used to acquire additional securities in accordance with the Company’s investment objectives. The exercise price is consistent with current trading prices and accretive to the most recently published net asset value per Unit. The offering is expected to increase the trading liquidity of the Company and reduce the management expense ratio.

Both the Preferred Shares and Class A Shares trade on the Toronto Stock Exchange (the “TSX”) under the symbol “BK.PR.A” and “BK” respectively. The Rights will be listed and will trade on the TSX until 12:00 noon (EST) on October 6, 2014. The Rights will be eligible for exercise on and following August 26, 2014.

The Company invests in a portfolio of six publicly traded Canadian Banks as follows: Bank of Montreal, Canadian Imperial Bank of Commerce, National Bank of Canada, Royal Bank of Canada, Bank of Nova Scotia, Toronto-Dominion Bank.

Separately, in a review of the credit of six Split Share Corporations:

Of the six structured Preferred Share ratings updated today by DBRS, one has been upgraded and five have been confirmed. Equity performance has been strong over the past year, with the S&P/TSX Composite Index rising by 22.8% from July 31, 2013, to July 31, 2014. All six Issuers experienced increasing net asset values (NAVs) over that same period. Notwithstanding the positive performance over the past year, the ratings assigned to the many of the Preferred Shares continue to be constrained by distributions paid to holders of the Capital Shares, which depress NAVs and downside protection levels. Other key rating factors include the downside protection volatility in recent months, the credit quality and diversification of each Portfolio and the expected maturity date of the Preferred Shares of each Issuer.

One Preferred Share was upgraded, primarily based on the level and stability of the downside protection over the past year.

The upgrade was for BK.PR.A, which has a Unit Value of 24.16 as of 2014-8-29, implying Asset Coverage of 2.4+:1. It is now rated Pfd-3(high), one notch higher than the confirmation in 2013.

September 4, 2014

Thursday, September 4th, 2014

Interesting article in the Globe about global real estate flows:

In June, Citigroup Inc. paid a record HK$5.4-billion ($697-million) for a Hong Kong office tower that will bring most of its 5,000 employees under one roof. Canada’s Manulife Financial Corp. last year paid HK$4.5-billion for a similar-size tower and development in the city’s Kowloon district.

“Canadians are buying everywhere,” said Ross Moore, director of Canada research at CBRE Group Inc., the biggest commercial broker. “They are shopping the world. What’s happened in the last five to 10 years is the big pension funds pretty well own everything of quality in Canada. They love real estate and have all this money coming in and they have to put it somewhere.”

Toronto-based Brookfield Asset Management Inc. has started investing in European warehouse properties and Indian offices after accumulating the biggest holdings of office buildings in both the U.S. and Canada. The real estate unit of Ontario Teachers’ Pension Plan has been investing in Brazil as well as the U.K. and Australia. Canadian Pension Plan Investment Board has bought London residential, retail and office properties.

Europe’s trying everything to stimulate:

The European Central Bank cut interest rates and will start buying assets, in a bid to boost the flow of funding for the euro-area economy while stopping short of broad-based quantitative easing.

ECB President Mario Draghi’s plan to buy asset-backed securities and covered bonds pushed the euro below $1.30 for the first time since July 2013 as he said the inflation outlook had worsened. Germany’s Jens Weidmann opposed the rate cut and ABS plan, according to two officials.

The ECB “will purchase a broad portfolio of simple and transparent securities,” Draghi said at a press conference in Frankfurt today. “Some of our council were in favor of doing more than presented.”

The European Commission is considering allowing banks to hold a wider range of asset-backed securities to meet liquidity requirements than foreseen by global regulators, according to an EU document obtained by Bloomberg News. Banks will be allowed to use securitizations backed by assets from car loans to small business and consumer debt under the EU rule, whereas the Basel Committee on Banking Supervision sought to limit securitizations to those backed by residential mortgage debt.

… and contagion is important:

Draghi’s stimulus is helping keep a lid on borrowing costs in the U.S. even as the growth outlook continues to improve. The nation’s joblessness fell to 6.2 percent in July from 6.7 percent in December, yet yields on the benchmark 10-year Treasury note have also tumbled from 3.03 percent at year-end. The securities yielded 2.45 percent at 10:59 a.m. in New York, up 0.05 percentage point from yesterday.

Instead of girding for rising interest rates as the economy strengthens, investors have been pouring cash into long-dated U.S. debt.

They’ve funneled $3.9 billion into BlackRock Inc. (BLK)’s iShares 7-10 Year Treasury Bond exchange-traded fund this year, the most among U.S. fixed income ETFs, Bloomberg data show. The fourth-biggest winner has been the iShares 20+ Year Treasury Bond ETF (TLT), with $1.7 billion of deposits.

Analysts keep cutting their predictions for how much borrowing costs will rise, too. They now forecast a 2.89 percent yield on the 10-year Treasury note at year-end, down from a July call of 3 percent, according to a Bloomberg survey.

Today’s mail brought me a wonderful book, Contingent Convertibles [CoCos], by George M. von Furstenberg. I’ve only skimmed it, but it does include a phrase that most of us will have hoped was obvious:

A [Conversion Price] should be part of the cocos covenant so that the number of common shares issued at conversion is known already from the time the cocos are initially offered.

Sadly, that ain’t how they’ll work in Canada.

It was a poor day for the Canadian preferred share market, with PerpetualDiscounts losing 14bp, FixedResets down 10bp and DeemedRetractibles off 6bp. Volatility was high. Volume was low.

HIMIPref™ Preferred Indices
These values reflect the December 2008 revision of the HIMIPref™ Indices

Values are provisional and are finalized monthly
Index Mean
Current
Yield
(at bid)
Median
YTW
Median
Average
Trading
Value
Median
Mod Dur
(YTW)
Issues Day’s Perf. Index Value
Ratchet 0.00 % 0.00 % 0 0.00 0 -0.1107 % 2,635.2
FixedFloater 4.15 % 3.40 % 25,775 18.57 1 0.0437 % 4,180.3
Floater 2.91 % 3.07 % 51,057 19.48 4 -0.1107 % 2,725.0
OpRet 4.05 % -1.82 % 97,510 0.08 1 0.1186 % 2,729.3
SplitShare 4.29 % 3.93 % 118,197 3.95 5 -0.2035 % 3,151.9
Interest-Bearing 0.00 % 0.00 % 0 0.00 0 0.1186 % 2,495.6
Perpetual-Premium 5.46 % 0.13 % 79,676 0.08 20 -0.0177 % 2,438.7
Perpetual-Discount 5.22 % 5.15 % 109,891 15.19 16 -0.1391 % 2,604.2
FixedReset 4.24 % 3.69 % 181,601 6.55 74 -0.0998 % 2,566.3
Deemed-Retractible 5.00 % 1.18 % 107,333 0.16 42 -0.0550 % 2,566.3
FloatingReset 2.62 % 2.00 % 78,653 3.77 6 0.1705 % 2,528.5
Performance Highlights
Issue Index Change Notes
TD.PF.B FixedReset -4.22 % There’s a bid at 25.01 on the consolidated tape, but no bid, not even one, as of the “last” quote on the Toronto Exchange tape. There may have been a closing bid, but the Exchange refuses to sell closing quotes. Rather than “zero”, HIMIPref™ has substituted a bid one dollar below the ask. I thought the TMX was supposed to have market makers! This is just more idiocy brought to you by the morons in charge of the TMX.
YTW SCENARIO
Maturity Type : Limit Maturity
Maturity Date : 2044-09-04
Maturity Price : 22.81
Evaluated at bid price : 24.05
Bid-YTW : 3.94 %
TRP.PR.E FixedReset -1.60 % YTW SCENARIO
Maturity Type : Limit Maturity
Maturity Date : 2044-09-04
Maturity Price : 23.22
Evaluated at bid price : 25.21
Bid-YTW : 3.88 %
FTS.PR.F Perpetual-Discount -1.18 % YTW SCENARIO
Maturity Type : Limit Maturity
Maturity Date : 2044-09-04
Maturity Price : 24.06
Evaluated at bid price : 24.33
Bid-YTW : 5.05 %
GWO.PR.S Deemed-Retractible -1.09 % YTW SCENARIO
Maturity Type : Hard Maturity
Maturity Date : 2025-01-31
Maturity Price : 25.00
Evaluated at bid price : 25.30
Bid-YTW : 5.09 %
BAM.PR.R FixedReset -1.01 % YTW SCENARIO
Maturity Type : Limit Maturity
Maturity Date : 2044-09-04
Maturity Price : 23.84
Evaluated at bid price : 25.61
Bid-YTW : 3.87 %
TRP.PR.C FixedReset 1.03 % YTW SCENARIO
Maturity Type : Limit Maturity
Maturity Date : 2044-09-04
Maturity Price : 22.27
Evaluated at bid price : 22.66
Bid-YTW : 3.54 %
VNR.PR.A FixedReset 1.17 % YTW SCENARIO
Maturity Type : Call
Maturity Date : 2017-10-15
Maturity Price : 25.00
Evaluated at bid price : 25.87
Bid-YTW : 3.39 %
Volume Highlights
Issue Index Shares
Traded
Notes
TD.PR.O Deemed-Retractible 152,443 TD crossed 149,900 at 25.28.
YTW SCENARIO
Maturity Type : Call
Maturity Date : 2014-10-31
Maturity Price : 25.00
Evaluated at bid price : 25.24
Bid-YTW : 1.67 %
BAM.PR.P FixedReset 83,006 Called for redemption September 30.
YTW SCENARIO
Maturity Type : Call
Maturity Date : 2014-10-30
Maturity Price : 25.00
Evaluated at bid price : 25.41
Bid-YTW : 2.88 %
TRP.PR.D FixedReset 57,835 RBC crossed 49,900 at 25.35.
YTW SCENARIO
Maturity Type : Call
Maturity Date : 2019-04-30
Maturity Price : 25.00
Evaluated at bid price : 25.31
Bid-YTW : 3.81 %
MFC.PR.M FixedReset 34,025 Recent new issue.
YTW SCENARIO
Maturity Type : Call
Maturity Date : 2019-12-19
Maturity Price : 25.00
Evaluated at bid price : 25.05
Bid-YTW : 3.92 %
TD.PF.B FixedReset 30,867 YTW SCENARIO
Maturity Type : Limit Maturity
Maturity Date : 2044-09-04
Maturity Price : 22.81
Evaluated at bid price : 24.05
Bid-YTW : 3.94 %
TRP.PR.A FixedReset 29,377 Nesbitt crossed 25,000 at 23.00.
YTW SCENARIO
Maturity Type : Limit Maturity
Maturity Date : 2044-09-04
Maturity Price : 22.22
Evaluated at bid price : 22.93
Bid-YTW : 3.78 %
There were 24 other index-included issues trading in excess of 10,000 shares.
Wide Spread Highlights
Issue Index Quote Data and Yield Notes
TD.PF.B FixedReset Quote: 24.05 – 25.05
Spot Rate : 1.0000
Average : 0.5582

YTW SCENARIO
Maturity Type : Limit Maturity
Maturity Date : 2044-09-04
Maturity Price : 22.81
Evaluated at bid price : 24.05
Bid-YTW : 3.94 %

TD.PR.S FixedReset Quote: 25.50 – 25.92
Spot Rate : 0.4200
Average : 0.2432

YTW SCENARIO
Maturity Type : Call
Maturity Date : 2018-07-31
Maturity Price : 25.00
Evaluated at bid price : 25.50
Bid-YTW : 2.92 %

TRP.PR.E FixedReset Quote: 25.21 – 25.60
Spot Rate : 0.3900
Average : 0.2393

YTW SCENARIO
Maturity Type : Limit Maturity
Maturity Date : 2044-09-04
Maturity Price : 23.22
Evaluated at bid price : 25.21
Bid-YTW : 3.88 %

IAG.PR.A Deemed-Retractible Quote: 23.00 – 23.30
Spot Rate : 0.3000
Average : 0.1959

YTW SCENARIO
Maturity Type : Hard Maturity
Maturity Date : 2025-01-31
Maturity Price : 25.00
Evaluated at bid price : 23.00
Bid-YTW : 5.62 %

BAM.PR.R FixedReset Quote: 25.61 – 25.88
Spot Rate : 0.2700
Average : 0.1685

YTW SCENARIO
Maturity Type : Limit Maturity
Maturity Date : 2044-09-04
Maturity Price : 23.84
Evaluated at bid price : 25.61
Bid-YTW : 3.87 %

GWO.PR.S Deemed-Retractible Quote: 25.30 – 25.58
Spot Rate : 0.2800
Average : 0.1819

YTW SCENARIO
Maturity Type : Hard Maturity
Maturity Date : 2025-01-31
Maturity Price : 25.00
Evaluated at bid price : 25.30
Bid-YTW : 5.09 %

September 3, 2014

Thursday, September 4th, 2014

The CPPIB is spending more on outside managers:

Five years ago, the investment arm of the Canada Pension Plan had total costs of $665-million, according to a new report from the Fraser Institute. In the CPPIB’s most recent fiscal year, overhead had ballooned to $1.4-billion.

To be sure, part of that increase reflected the swelling size of the fund, which is constantly taking in new money, thanks to pension contributions from millions of Canadian workers. But even against the backdrop of its surging assets, the CPPIB is not showing any tendency to rein in its spending. Its costs amounted to 0.58 per cent of its assets back in 2008-09; in the most recent fiscal year, they stood at 0.84 per cent.

The fund likes to focus attention on its relatively modest operating expenses. A more realistic accounting, though, has to encompass other costs, such as hiring external investment managers and the expenses involved in actually implementing the fund’s strategies.

Those costs are now nearly twice as large as the fund’s operating expenses, according to the report’s authors, Philip Cross and Joel Emes. Much of the additional outlay reflects payments to external money managers, which have soared from $25-million six years ago to $782-million last year.

The Fraser Institute’s news release links to the study, titled Accounting for the True Cost of the Canada Pension Plan, which notes that the CPPIB’s assets under management are about $183-billion.

The CPPIB is making a horrible mistake in going to outside managers. Assiduous Readers will remember that I believe that it is possible to outperform benchmarks – any benchmark – over the long term, and that the reason for this is that most investors – including most professionals – are idiots. At least when it comes to actual investing, they’re idiots. They’re really, really good at sales!

In order to outperform, you need a dedicated staff and this staff has to be completely focussed on the nitty-gritty of investment analysis. The organization must have no sales exposure at all if it is to be successfule – which means that the organization must run its own money and only its own money. This necessarily means that consistent outperformance is restricted to organizations with huge amounts of assets, but that’s life. The moronic proposals for an Ontario superfund (discussed on April 21, 2009 and elsewhere on PrefBlog) will lead to a change of culture in the superfund management, from a culture of returns, returns returns! to a culture of clients, clients clients! which are polar opposites with respect to the personalities of the individuals concerned and with respect to the effect on investment performance.

CalPERS is run on the hub and spoke model. Its performance is a disaster. The UofT retirement fund is hub-and-spoke – and it’s a disaster. When you run an investment organization according this model, you are paying for salesmen to have lunch with each other. We are going to pay dearly for the CPPIB’s increasing appetite for good investment stories.

CU Inc. issued long paper today:

CU Inc. announced today that it will issue $1,000,000,000 of 4.085% Debentures maturing on September 2, 2044, at a price of $100.00 to yield 4.085%. This issue was sold by RBC Dominion Securities Inc., BMO Nesbitt Burns Inc., TD Securities Inc., Scotia Capital Inc. and CIBC World Markets Inc. Proceeds from the issue will be used to finance capital expenditures, to repay existing indebtedness, and for other general corporate purposes of ATCO Electric Ltd. and ATCO Gas and Pipelines Ltd.

The company has a PerpetualDiscount outstanding, CIU.PR.A, which has a 4.60% coupon and is bid at 22.96 to yield 5.02%. Call it a round 5% for luck. This implies the interest-equivalent yield for CIU.PR.A is 6.5%, which, given the number on the bond issue, imply a Seniority Spread for this company of about 240bp.

It was a mixed day for the Canadian preferred share market, with PerpetualDiscounts gaining 1bp, FixedResets off 7bp and DeemedRetractibles up 6bp. Volatility was average. Volume was a little low, although Fortis issues got a bit of boost from the new issue announcement.

PerpetualDiscounts now yield 5.13%, equivalent to 6.67% interest at the standard equivalency factor of 1.3x. Long corporates now yield a little under 4.2%, so the pre-tax interest-equivalent spread (in this context, the “Seniority Spread”) is now about 250bp, unchanged from the figure reported August 27.

HIMIPref™ Preferred Indices
These values reflect the December 2008 revision of the HIMIPref™ Indices

Values are provisional and are finalized monthly
Index Mean
Current
Yield
(at bid)
Median
YTW
Median
Average
Trading
Value
Median
Mod Dur
(YTW)
Issues Day’s Perf. Index Value
Ratchet 0.00 % 0.00 % 0 0.00 0 0.2081 % 2,638.2
FixedFloater 4.15 % 3.40 % 26,817 18.57 1 0.0000 % 4,178.5
Floater 2.91 % 3.07 % 49,175 19.49 4 0.2081 % 2,728.1
OpRet 4.05 % -0.52 % 93,749 0.08 1 0.0000 % 2,726.0
SplitShare 4.28 % 3.75 % 117,407 3.95 5 0.3189 % 3,158.4
Interest-Bearing 0.00 % 0.00 % 0 0.00 0 0.0000 % 2,492.7
Perpetual-Premium 5.46 % -0.92 % 78,991 0.08 20 -0.0726 % 2,439.1
Perpetual-Discount 5.22 % 5.13 % 110,281 15.23 16 0.0080 % 2,607.8
FixedReset 4.24 % 3.69 % 181,524 8.56 74 -0.0670 % 2,568.9
Deemed-Retractible 4.99 % 1.89 % 106,877 0.23 42 0.0551 % 2,567.7
FloatingReset 2.63 % 2.03 % 79,370 3.77 6 -0.0590 % 2,524.2
Performance Highlights
Issue Index Change Notes
CIU.PR.C FixedReset -2.05 % YTW SCENARIO
Maturity Type : Limit Maturity
Maturity Date : 2044-09-03
Maturity Price : 20.52
Evaluated at bid price : 20.52
Bid-YTW : 3.68 %
FTS.PR.G FixedReset -1.63 % YTW SCENARIO
Maturity Type : Limit Maturity
Maturity Date : 2044-09-03
Maturity Price : 23.14
Evaluated at bid price : 24.69
Bid-YTW : 3.69 %
IAG.PR.A Deemed-Retractible 1.00 % YTW SCENARIO
Maturity Type : Hard Maturity
Maturity Date : 2025-01-31
Maturity Price : 25.00
Evaluated at bid price : 23.16
Bid-YTW : 5.53 %
Volume Highlights
Issue Index Shares
Traded
Notes
MFC.PR.M FixedReset 170,355 Recent new issue.
YTW SCENARIO
Maturity Type : Call
Maturity Date : 2019-12-19
Maturity Price : 25.00
Evaluated at bid price : 25.11
Bid-YTW : 3.87 %
FTS.PR.J Perpetual-Discount 151,305 Nesbitt crossed 150,000 at 24.18.
YTW SCENARIO
Maturity Type : Limit Maturity
Maturity Date : 2044-09-03
Maturity Price : 23.77
Evaluated at bid price : 24.15
Bid-YTW : 4.93 %
ENB.PR.P FixedReset 103,460 Scotia crossed 50,000 at 24.45; RBC crossed 50,000 at the same price.
YTW SCENARIO
Maturity Type : Limit Maturity
Maturity Date : 2044-09-03
Maturity Price : 22.98
Evaluated at bid price : 24.40
Bid-YTW : 4.08 %
TD.PR.O Deemed-Retractible 102,199 TD crossed 100,000 at 25.28.
YTW SCENARIO
Maturity Type : Call
Maturity Date : 2014-10-31
Maturity Price : 25.00
Evaluated at bid price : 25.23
Bid-YTW : 1.89 %
BAM.PR.P FixedReset 89,425 Indicated for redemption September 30.
YTW SCENARIO
Maturity Type : Call
Maturity Date : 2014-10-30
Maturity Price : 25.00
Evaluated at bid price : 25.40
Bid-YTW : 3.08 %
FTS.PR.K FixedReset 60,570 RBC crossed 25,000 at 24.95.
YTW SCENARIO
Maturity Type : Limit Maturity
Maturity Date : 2044-09-03
Maturity Price : 23.16
Evaluated at bid price : 24.88
Bid-YTW : 3.62 %
There were 27 other index-included issues trading in excess of 10,000 shares.
Wide Spread Highlights
Issue Index Quote Data and Yield Notes
RY.PR.F Deemed-Retractible Quote: 25.65 – 26.15
Spot Rate : 0.5000
Average : 0.3186

YTW SCENARIO
Maturity Type : Call
Maturity Date : 2014-10-03
Maturity Price : 25.50
Evaluated at bid price : 25.65
Bid-YTW : -1.33 %

PWF.PR.A Floater Quote: 20.52 – 20.99
Spot Rate : 0.4700
Average : 0.3711

YTW SCENARIO
Maturity Type : Limit Maturity
Maturity Date : 2044-09-03
Maturity Price : 20.52
Evaluated at bid price : 20.52
Bid-YTW : 2.57 %

BAM.PR.T FixedReset Quote: 25.41 – 25.65
Spot Rate : 0.2400
Average : 0.1713

YTW SCENARIO
Maturity Type : Limit Maturity
Maturity Date : 2044-09-03
Maturity Price : 23.59
Evaluated at bid price : 25.41
Bid-YTW : 3.85 %

GWO.PR.H Deemed-Retractible Quote: 24.23 – 24.45
Spot Rate : 0.2200
Average : 0.1604

YTW SCENARIO
Maturity Type : Hard Maturity
Maturity Date : 2025-01-31
Maturity Price : 25.00
Evaluated at bid price : 24.23
Bid-YTW : 5.22 %

GWO.PR.I Deemed-Retractible Quote: 22.67 – 22.89
Spot Rate : 0.2200
Average : 0.1642

YTW SCENARIO
Maturity Type : Hard Maturity
Maturity Date : 2025-01-31
Maturity Price : 25.00
Evaluated at bid price : 22.67
Bid-YTW : 5.69 %

BNS.PR.N Deemed-Retractible Quote: 26.05 – 26.32
Spot Rate : 0.2700
Average : 0.2167

YTW SCENARIO
Maturity Type : Call
Maturity Date : 2014-10-03
Maturity Price : 25.75
Evaluated at bid price : 26.05
Bid-YTW : -3.25 %

BPO.PR.L To Be Redeemed

Wednesday, September 3rd, 2014

Brookfield Office Properties has announced:

that it intends to redeem all 11,500,000 of its outstanding Class AAA Preference Shares, Series L (TSX: BPO.PR.L), all of which are beneficially held by CDS & Co., as nominee of CDS Clearing and Depositary Services Inc., for cash on September 30, 2014. The redemption price for each such share is C$25.00. Holders of Series L shares on the record date of September 15, 2014 are entitled to receive the regular quarterly dividend of $0.42188 per share.

Notice of Redemption has been sent to CDS & Co. Payment of the redemption price will be made to all beneficial holders of the Series L Shares on or after September 30, 2014 through the facilities of CDS & Co.

This news comes after, but not necessarily due to, my post What’s Up With BPO.PR.L? and my eMail to Investor Relations. That eMail was answered, by the way:

Hello James,

Please see the press release issued today:

[LINK]

Regards,

As noted by Assiduous Reader and New Commenter adriandunn in the comments to my earlier post, trading was halted in the morning:

Sep 3, 2014

TORONTO, Sept. 3, 2014 /CNW/ – The following issues have been halted by IIROC:

Company: Brookfield Office Property Inc. PR series ‘L’

TSX Symbol: BPO.PR.L

Reason: Pending News

Halt Time (ET): 10:50 AM ET

IIROC can make a decision to impose a temporary suspension (halt) of trading in a security of a publicly-listed company. Trading halts are implemented to ensure a fair and orderly market. IIROC is the national self-regulatory organization which oversees all investment dealers and trading activity on debt and equity marketplaces in Canada.

SOURCE Investment Industry Regulatory Organization of Canada (IIROC)

Trading was resumed at 11:30am:

TORONTO, Sept. 3, 2014 /CNW/ – Trading resumes in:

Company: Brookfield Office Property Inc. PR series ‘L’

TSX Symbol: BPO.PR.L

Resumption: 11:30 AM ET

IIROC can make a decision to impose a temporary suspension (halt) of trading in a security of a publicly-listed company. Trading halts are implemented to ensure a fair and orderly market. IIROC is the national self-regulatory organization which oversees all investment dealers and trading activity on debt and equity marketplaces in Canada.

SOURCE Investment Industry Regulatory Organization of Canada (IIROC)

Assiduous Reader prefQC makes an interesting suggestion later in the comments to my earlier post:

Seems that if yesterday’s big purchaser fights it, he would definitely win (after all, the prospectus is legally binding). In that case, BPO may be forced to offer a “voluntary” redemption and keep the issue alive for another 5 years for those who want to keep it (my guess that would be most everybody). Given the low downside risk and (relatively) high upside reward, maybe this would be a good time to load up on BPO.PR.L??

Well … I dunno. If we go strictly by the timing of the press release, they missed both the redemption window and the reset window, so a judge would have to determine the ‘fairest’ way to resolve the problem. The market clearly expected redemption, so I suspect that would be the decision.

Another consideration is an unusual line in their press release:

Notice of Redemption has been sent to CDS & Co.

According to the prospectus:

A book entry only certificate representing the Series L Shares distributed hereunder will be issued in registered form only to CDS Clearing and Depository Services Inc. (“CDS”) or its nominee and will be deposited with CDS on the Closing Date. The Corporation understands that a purchaser of Series L Shares will receive only a customer confirmation from the registered dealer who is a CDS participant and from or through whom the Series L Shares are purchased. See “Book Entry Only System”.

So according to the official transfer agent, there is only one owner of shares, and BPO claims that this holder received a Notice of Redemption, although they don’t spell out exactly when. If it was before the thirty-day minimum notice, then presumably complainers will find themselves without a leg to stand on.

It is highly regrettable that Brookfield and its various subsidiaries have such a culture of contempt for their ultimate shareholders – much like the culture of contempt that the TSX has for its ultimate users – in that they take a very strict definition of Clients = CDS, full stop, (or in the case of the TSX, Clients = Brokerages, full stop). Remember the ticker change from BNA to PVS? I will bet a nickel that the attitude was and is … ‘We’ve notified our client – and that’s all we need to do’; the client being in this case CDS and in the ticker-change case, the Exchange. It is also very tempting to speculate that the officers of the various firms are useless drecks who refuse to take any initiative and don’t understand why they don’t get paid as much as Brookfield’s dealmakers. But that’s just speculation, of course.

New Issue: FTS FixedReset, 4.10%+248

Wednesday, September 3rd, 2014

Fortis Inc. has announced:

that it has entered into an agreement with a syndicate of underwriters led by Scotiabank and RBC Capital Markets (collectively, the “Underwriters”), pursuant to which the Underwriters have agreed to purchase, on a bought deal basis, from Fortis and sell to the public (the “Offering”) 12,000,000 Cumulative Redeemable Fixed Rate Reset First Preference Shares, Series M of the Corporation (the “Series M First Preference Shares”). The purchase price of $25.00 per Series M First Preference Share will result in gross proceeds for Fortis of $300,000,000.

Fortis has granted the Underwriters the option to purchase up to an additional 1,800,000 Series M First Preference Shares to cover over-allotments, if any, and for market stabilization purposes, during the 30 days following the closing of the Offering (the “Over-Allotment Option”). If the Over-Allotment Option is exercised in full, the Offering will result in gross proceeds to the Corporation of $345,000,000.

The net proceeds of the Offering will be used to repay a portion of the amounts borrowed by Fortis under its acquisition credit facility in connection with the acquisition of UNS Energy Corporation completed on August 15, 2014.

The holders of Series M First Preference Shares will be entitled to receive fixed cumulative preferential cash dividends, if, as and when declared by the Board of Directors of the Corporation (the “Board of Directors”), for the initial period commencing on the date of issue and ending on but excluding December 1, 2019 (the “Initial Period”) at a rate of 4.10%, in an amount equal to $1.0250 per Series M First Preference Share per annum paid in equal quarterly instalments. The first of such dividends, if declared, will be payable on December 1, 2014 for the period commencing on the date of issue in the amount of $0.2050 per Series M First Preference Share. The dividend rate will be reset on December 1, 2019 and thereafter every five years at a level of 2.48% above the five‑year Government of Canada Bond yield.

At the end of the Initial Period and every five years thereafter, the holders of Series M First Preference Shares will, subject to certain conditions and the right of the Corporation to redeem those shares, have the option to convert any or all of their Series M First Preference Shares into an equal number of Cumulative Redeemable Floating Rate First Preference Shares, Series N of the Corporation (the “Series N First Preference Shares”). The holders of Series N First Preference Shares will be entitled to receive floating rate cumulative preferential cash dividends, if, as and when declared by the Board of Directors, at the rate of the three-month Government of Canada Treasury Bill average yield plus 2.48%, reset on a quarterly basis.

The Offering is subject to the receipt of all necessary regulatory and stock exchange approvals. Closing is expected to occur on or about September 19, 2014 but not later than October 24, 2014.

They announced later:

that due to strong investor demand it has agreed to increase the aggregate size of its previously announced bought deal offering of Cumulative Redeemable Fixed Rate Reset First Preference Shares, Series M (the “Series M First Preference Shares”) from $300,000,000 to $600,000,000 (the “Offering”). The Offering is being made pursuant to an agreement with a syndicate of underwriters led by Scotiabank and RBC Capital Markets (collectively, the “Underwriters”) who have agreed to purchase 24,000,000 Series M First Preference Shares at a price of $25.00 per share.

The Offering will result in gross proceeds to the Corporation of $600,000,000. There will be no over-allotment option on the Offering. All other terms of the Offering are as set forth in the press release relating to the Offering issued by Fortis earlier today.

That’s a whopper! This issue will join FTS’ other three FixedResets:

FTS FixedResets
Ticker Initial Rate Issue Reset Spread Bid Price 2014-9-2 Bid YTW 2014-9-3 YTW Scenario 2014-9-3
FTS.PR.G 3.883% 213bp 24.69 3.69% Perpetuity
FTS.PR.H 4.25% 145bp 20.96 3.67% Perpetuity
FTS.PR.K 4.00% 205bp 24.88 3.62% Perpetuity
FTS.PR.? 4.10% 248bp 25.00
Issue
Price
3.95% Perpetuity

And according to Implied Volatility analysis, it is cheap relative to the other FTS issues:

ImpVol_FTS_140903
Click for big

Update, 2014-9-12: Rated Pfd-2(low) [Review Developing] by DBRS.

What’s Up With BPO.PR.L?

Wednesday, September 3rd, 2014

What’s up with BPO.PR.L? This issue commenced trading 2009-9-24 after being announced 2009-8-21 and is a FixedReset, 6.75%+417, with many market participants believing that it will be called at the first opportunity, 2014-9-30.

But I don’t see anything happening! According to the prospectus (emphasis added):

The Series L Shares will not be redeemable by the Corporation prior to September 30, 2014. On September 30, 2014 and on September 30 every five years thereafter (or, if such date is not a business day, the immediately following business day), and subject to certain other restrictions set out in “Description of the Series L Shares — Restrictions on Dividends and Retirement and Issue of Shares”, the Corporation may, at its option, on at least 30 days and not more than 60 days prior written notice, redeem all or from time to time any part of the outstanding Series L Shares by payment in cash of a per share sum equal to $25.00, in each case plus an amount equal to the Accrued Amount (less any tax required to be deducted and withheld by the Corporation).

OK, 30 days’ notice required. What about if they let it reset?

“Fixed Rate Calculation Date” means, for any Subsequent Fixed Rate Period, the 30th day prior to the first day of
such Subsequent Fixed Rate Period.

“Subsequent Fixed Rate Period” means for the initial Subsequent Fixed Rate Period, the period commencing on October 1, 2014 and ending on and including September 30, 2019 and for each succeeding Subsequent Fixed Rate Period, the period commencing on the day immediately following the end of the immediately preceding Subsequent Fixed Rate Period and ending on and including September 30 in the fifth year thereafter.

The Annual Fixed Dividend Rate applicable to a Subsequent Fixed Rate Period will be determined by the Corporation on the Fixed Rate Calculation Date. Such determination will, in the absence of manifest error, be final and binding upon the Corporation and upon all holders of Series L Shares. The Corporation will, on the Fixed Rate Calculation Date, give written notice of the Annual Fixed Dividend Rate for the ensuing Subsequent Fixed Rate Period to the registered holders of the then outstanding Series L Shares.

OK, 30 days’ notice required.

But, according to my calculations, there are now less than 30 days left until September 30 or October 1 (as the case may be) and there has not been a press release issued by BPO on their press release page. There was only an incidental reference in the Plan of Arrangement Proxy Circular:

Treatment of BPO Preferred Shares and BPO Senior Notes

Except for the redemption of the BPO Class A Preferred Shares and the treatment of the BPO Convertible Preferred Shares described above, there are no changes being made to the BPO Preferred Shares, which will not be affected by the Arrangement and will continue to be listed on the TSX.

In addition, as of December 31, 2013, BPO had $187 million principal amount of BPO 4.30% Notes outstanding and $140 million principal amount of BPO 4.00% Notes outstanding. The BPO Senior Notes will remain outstanding following the consummation of the Arrangement and will not be affected.

There’s no dedicated press release on the Brookfield Property Partners press release page.

Preferred shares are not mentioned in the Brookfield Property Partners earnings release.

There’s a note in the Brookfield Office Properties financial statements (available on SEDAR) that:

On August 12, 2014, the Board of Directors of the company declared dividends payable for the Class A, Class AA Series E and Class AAA Series L, N, P, R, T, V, W, X, Y and Z preferred shares.

… but nothing about a redemption. A very promising entry on SEDAR regarding “Security Holders Documents – English” dated August 27, 2014 turns out to be simply a “Restated Certificate of Incorporation”, which describes Series L in loving detail, but makes no mention of an actual call for redemption.

I have sent the following eMail to the official investor inquiries guy:

Dear Mr. Cherry,

It is my understanding that the captioned series of shares is due to either reset or be redeemed on September 30, 2014, but that in either case notices will be made regarding the disposition of these shares thirty days prior to the applicable date.

I have been unable to find any such notices on your website.

Can you please tell me whether the captioned series will be redeemed or reset?

Sincerely,

So we shall see what we shall see! Implied Volatility theory suggests that there will be a very nice jump in price should the BPO.PR.L shares be reset:

ImpVol_BPO_140902
Click for Big

DC.PR.B To Reset At 5.688%

Wednesday, September 3rd, 2014

Dundee Corporation has announced:

Further to Dundee Corporation’s (TSX: DC.A and DC.PR.B) (“Dundee” or the “Company”) news release dated August 26, 2014, the Company announces today the applicable dividend rates for its Cumulative 5‐Year Rate Reset First Preference Shares, Series 2 (“Series 2 Shares”) and its Cumulative Floating Rate First Preference Shares, Series 3
(“Series 3 Shares”).

With respect to any Series 2 Shares that remain outstanding on September 30, 2014, holders thereof will be entitled to receive fixed rate cumulative preferential cash dividends on a quarterly basis, as and when declared by the Board of Directors of Dundee and subject to the provisions of the Business Corporations Act (Ontario). The dividend rate for the five‐year period commencing on September 30, 2014 to, but excluding September 30, 2019, will be 5.688%, being equal to the sum of the five‐year Government of Canada bond yield as at September 2, 2014, plus 4.10%, as determined in accordance with the terms of the Series 2 Shares.

With respect to any Series 3 Shares that may be issued on September 30, 2014, holders thereof will be entitled to receive floating rate cumulative preferential cash dividends on a quarterly basis, calculated on the basis of actual number of days elapsed in each quarterly floating rate period divided by 365, as and when declared by the Board of Directors of the Company and subject to the provisions of the Business Corporations Act (Ontario). The dividend rate for the three‐month period commencing on September 30, 2014 to, but excluding, December 31, 2014, will be 5.04%, being equal to the sum of the three‐month Government of Canada Treasury bill yield as at September 2, 2014, plus 4.10%, as determined in accordance with the terms of the Series 3 Shares.

Beneficial owners of Series 2 Shares who wish to exercise their right of conversion should instruct their broker or other nominee to exercise such right before 5:00 p.m. (EDT) on September 15, 2014. Instructions of conversion are irrevocable.

Beneficial owners should direct any conversion inquiries to their broker or Dundee’s Registrar and Transfer Agent, Computershare Investor Services Inc., at 1‐800‐564‐6253.

It is difficult to formulate a recommendation regarding whether holders of DC.PR.B should convert. The two issues resulting after partial conversion will, of course, form a Strong Pair and may be analyzed with the Pairs Equivalency Calculator. Performing an analysis of all current FixedReset/FloatingReset pairs results in the following chart:

FRPairs_140902
Click for Big

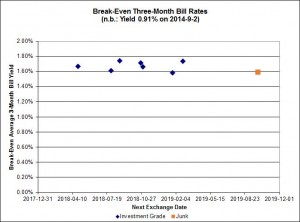
This chart was created with the assumed price of the new DC FloatingReset set to 25.22, the same as the price of DC.PR.B. According to this, the DC FloatingReset looks a little bit cheap … but not much. To get to the average Breakeven 3-Month Bill Yield of 1.67%, the price would only need to increase by $0.08, to 25.30.

One may, of course, make the argument that the time until the next Exchange Date is greater for DC.PR.B, therefore (given a projection of increasing policy rates) the breakeven rate should be higher, therefore the current price should be somewhat higher than 25.30 and therefore conversion should be favoured … but that’s a matter of opinion, informed or otherwise. I take no position on that – you’re on your own!

Another consideration is the fact that this will be the first Junk Floating Reset. In a logical world this shouldn’t make any difference, since the analysis rests on the idea that the credit quality of each element of the Strong Pair is precisely equal, but since when has the preferred share market been logical? If we look at the other pool of Strong Pairs, the pool that depends upon the prime rate and is predominantly junk (if you believe DBRS) or investment grade (if you believe S&P), one gets a set of break-even rates that implies a much faster increase in Prime, which one may sort-of assume will move in sort-of lockstep with three-month bill rates:

FFPairs_140902br>Click for Big

The average breakeven prime rate is 5.38%, a huge increase over the current 3% and much more than the increase in short-rates implied by extant FloatingResets. Looking at things very simply, if we say that the FixedFloater/Ratchet series of strong pairs implies a rate of 5.38%, 238bp over current, then adding 238bp to the 0.91% current three month bill rate means requiring a break-even 3-month-bill rate of 3.29%, which in turn implies a whopping price of 26.90 for the new DC FloatingReset.

I find none of this particularly convincing and think that holders should either convert or hold according to what makes sense for their own portfolios. Those with a taste for speculation, however, will find the conversion to the FloatingReset attractive, since there’s not much downside and potentially quite a bit of upside.

New Issue: PPL FixedReset, 4.50%+294

Tuesday, September 2nd, 2014

Pembina Corporation has announced:

that it has entered into an agreement with a syndicate of underwriters co-led by CIBC and Scotiabank (together, the “Underwriters”) pursuant to which the Underwriters have agreed to purchase from Pembina 6,000,000 cumulative redeemable rate reset class A preferred shares, Series 7 (the “Series 7 Preferred Shares”) at a price of $25.00 per share for distribution to the public.

The holders of Series 7 Preferred Shares will be entitled to receive fixed cumulative dividends at an annual rate of $1.125 per share, payable quarterly on the 1st day of March, June, September and December, as and when declared by the Board of Directors of Pembina, yielding 4.50 per cent per annum, for the initial fixed rate period to but excluding December 1, 2019. The first quarterly dividend payment date is scheduled for December 1, 2014. The dividend rate will reset on December 1, 2019 and every five years thereafter at a rate equal to the sum of the then five-year Government of Canada bond yield plus 2.94 per cent. The Series 7 Preferred Shares are redeemable by Pembina, at its option, on December 1, 2019 and on December 1 of every fifth year thereafter at a price of $25.00 per share plus accrued and unpaid dividends.

The holders of Series 7 Preferred Shares will have the right to convert their shares into cumulative redeemable floating rate class A preferred shares, Series 8 (the “Series 8 Preferred Shares”), subject to certain conditions, on December 1, 2019 and on December 1 of every fifth year thereafter. The holders of Series 8 Preferred Shares will be entitled to receive quarterly floating rate cumulative dividends, as and when declared by the Board of Directors of Pembina, at a rate equal to the sum of the then 90-day Government of Canada treasury bill rate plus 2.94 per cent.

Pembina has granted to the underwriters an option, exercisable at any time up to 48 hours prior to the closing of the offering, to purchase up to an additional 2,000,000 Series 7 Preferred Shares at a price of $25.00 per share.

Closing of the offering is expected on September 11, 2014, subject to customary closing conditions.

The proceeds from the offering will be used to help fund a portion of Pembina’s proposed purchase of the Vantage pipeline system and the Saskatchewan Ethane Extraction Plant from Mistral Midstream Inc. and other entities controlled by Riverstone Holdings LLC (the “Transaction”), as well as to fund a portion of the remainder of the Company’s 2014 capital expenditure program and for general corporate purposes. The Transaction is subject to regulatory approvals including approval of the National Energy Board and under the Competition Act (Canada) and the Canada Transportation Act, required consents and other customary closing conditions. Further details about the Transaction are set out in a separate press release from Pembina dated today’s date, and which may be found on Pembina’s SEDAR profile atwww.sedar.com. The closing of the offering of the Series 7 Preferred Shares is not conditional on the closing of the Transaction. If the Transaction does not close, the portion of proceeds to be allocated to the Transaction will be reallocated to fund a portion of the remainder of the Company’s 2014 capital expenditure program, and for general corporate purposes.

The offering is being made by means of a prospectus supplement under the short form base shelf prospectus filed by the Company on February 22, 2013 in each of the provinces of Canada.

They later announced:

that as a result of strong investor demand for its previously announced offering of cumulative redeemable rate reset class A preferred shares, Series 7 (the “Series 7 Preferred Shares”), the size of the offering has been increased to 10 million shares. The offering no longer includes the previously granted underwriters’ option. The aggregate gross proceeds will be $250 million.

The acquisition of the Vantage Pipeline System was discussed in the Globe:

Pembina said in a separate news release Tuesday that the Vantage ethane pipeline being acquired from Riverstone Holdings LLC provides long-term, fee-for-service cash flow and strategic access to the expanding North Dakota Bakken play.

“We have watched the development of these assets with great interest as they represent an excellent opportunity to expand our footprint into one of the most promising hydrocarbon plays in North America and, as such, the Transaction is a low-risk, logical step-out for Pembina,” company president and chief executive officer Mike Dilger said.

As part of the Vantage transaction, Pembina is also acquirinig Mistral Midstream Inc.’s interest in the Saskatchewan Ethane Extraction Plant, a development-stage, 60-million-cubic-feet-per-day deep cut gas processing facility, as well as pipeline infrastructure currently under construction.

The plant has a long-term ethane sales agreement and a long-term, fee-for-service processing agreement, Pembina said; the facility is expected to produce about 4,500 barrels per day and will connect into Vantage.

Additional capital expenditures of about $100-million are anticipated before the end of 2015 in order to complete construction of the ethane extraction plant and the associated gathering and delivery infrastructure, Pembina said.

DBRS comments:

DBRS notes today that Pembina Pipeline Corporation (Pembina or the Company; rated BBB with a Stable trend by DBRS) has announced that it has entered into an agreement to acquire the Vantage pipeline system (Vantage) and Mistral Midstream Inc.’s interest in the Saskatchewan Ethane Extraction Plant (SEEP) for total consideration of USD 650 million (the Acquisition). DBRS views that the proposed Acquisition is not expected to have a material impact on Pembina’s credit profile in the short term. However, it could have a modestly positive impact on the business risk profile over the long term, reflecting the geographical diversification benefit and relatively stable cash flow from long-term take-or-pay transportation contracts and fee-for-service processing contracts associated with the Acquisition. The proposed Acquisition is subject to regulatory approvals and other customary closing conditions, including the approval of the Toronto Stock Exchange.

Based on DBRS’s view of Pembina’s long-term corporate financing strategy and its Acquisition financing plan, DBRS believes that the impact on the financial risk profile is expected to be neutral. Pembina intends to finance the Acquisition with a mix of equity (40%), preferred shares (20%) and debt (40%). This financing plan should not have a material impact on the current debt leverage, cash flow and interest coverage metrics, which improved in the last 12 months ended June 2014, compared with 2013 and previous years’ metrics due to much stronger EBIT and cash flow and marginally lower net debt. In the long term, Pembina is committed to maintaining its debt-to-capital ratio around the 40% range. Overall, DBRS does not consider the financing of the proposed Acquisition to have a material impact on the Company’s financial risk profile.

This issue will join PPL’s other three FixedResets:

PPL FixedResets
Ticker Initial Rate Issue Reset Spread Bid Price 2014-9-2 Bid YTW 2014-9-2 YTW Scenario 2014-9-2
PPL.PR.A 4.25% 247bp 24.40 4.12% Perpetuity
PPL.PR.C 4.70% 260bp 25.10 4.18% Perpetuity
PPL.PR.E 5.00% 300bp 25.90 4.19% Call
2019-6-1
PPL.PR.? 4.50% 294bp 25.00
Issue
Price
4.41% Perpetuity

This illustrates an important point about FixedReset analysis with respect to the interactions between Current Rate, Issue Reset Spread and Price. PPL.PR.E will pay 0.5% more than the new issue until its reset date, despite having a roughly identical Issue Reset Spread. Fifty bp more per annum over the five year term comes to about sixty cents; therefore one would expect PPL.PR.E to be priced roughly $0.60 more than the new issue, since the rates after reset (assuming, of course, that they both do get reset) will be almost identical.

The yields to worst, however, are greatly different, since the premium on PPL.PR.E is enough to make the yield-to-call less than the yield-to-perpetuity, even though the projected yields to perpetuity (4.39% for PPL.PR.E when priced at 25.90; 4.41% for the new issue when priced at 25.00) are almost identical.

It will be most interesting to see how they trade relative to each other once the new issue closes.

Update, 2014-9-4: Pfd-3 from DBRS.

September 2, 2014

Tuesday, September 2nd, 2014

Auto dealers in Georgia are competing with new technology using tried and true methods:

Tesla Motors Inc. (TSLA), which has fought U.S. dealers over its direct sales of electric cars, faces a new challenge in Georgia where auto retailers want the Peach State to bar distribution of sedans from the company’s store.

Tesla sells vehicles in violation of the state’s rules limiting the annual volume of cars it can sell directly to the public, the Georgia Automobile Dealers Association said in a petition filed with the Georgia Department of Revenue.

The group, which represents 500 dealerships, asked that Tesla’s license be revoked and the agency block sales of Tesla’s Model S sedan at its shop in Marietta, near Atlanta.

The carmaker’s license in Georgia allows it only to sell vehicles made “in accordance with custom design specifications of the customer” and retail fewer than 150 a year, the group said in the petition. Tesla sold 173 sedans at its suburban Atlanta outlet, its only store in the state, from October to June, according to the petition, a copy of which was obtained by Bloomberg News from the revenue department.

It was a good day for economic news:

The dollar climbed 0.7 percent to 105.10 yen at 4 p.m. in New York and gained 0.8 percent to $1.6472 per British pound. Yields on 10-year Treasury notes increased seven basis points, the most in more than a month, to 2.42 percent. The Standard & Poor’s 500 Index lost less than 0.1 percent after the biggest monthly rally since February, as energy companies tumbled 1.3 percent. Gold slid 1.7 percent and Brent crude slumped to a 16-month low.

U.S. manufacturing expanded in August at the fastest pace in three years as orders grew by the most in a decade, bolstering the case for the Federal Reserve to raise interest rates sooner than anticipated. Gauges of factory output in Europe and China signal slower growth, boosting speculation that policy makers will need to boost stimulus measures. European money markets are pricing in about a 50 percent probability that the European Central Bank will cut interest rates by 10 basis points this week, according to BNP Paribas SA.

There’s about a 44 percent chance Fed policy makers will raise the benchmark interest-rate target by June 2015, futures data compiled by Bloomberg showed today. A 36 percent likelihood was seen on Aug. 18.

Bond yields across the euro area have tumbled, enhancing the appeal of payments available from Treasuries, since ECB President Mario Draghi said at the Federal Reserve Bank of Kansas City’s annual conference in Jackson Hole, Wyoming, on Aug. 22 that the central bank will use “all the available instruments needed to ensure price stability.”

And, with the 75th anniversary of Canada’s declaration of war on Germany almost upon us, we are getting a flavour of what it was like to live through the Munich Crisis:

[Outgoing president of the European commission, José Manuel] Barroso told the closed meeting that Putin had told him Kiev would be an easy conquest for Russia, according to the Italian newspaper, La Repubblica. According to the account, Barroso asked Putin about the presence of Russian troops in eastern Ukraine. Nato says there are at least 1,000 Russian forces on the wrong side of the border. The Ukrainians put the figure at 1,600.

“The problem is not this, but that if I want I’ll take Kiev in two weeks,” Putin said, according to La Repubblica.

The Kremlin did not deny Putin had spoken of taking Kiev, but instead complained about the leak of the Barroso remarks.

Petro Poroshenko, the Ukrainian president, attended the EU summit and painted an apocalyptic picture of the conflict, with EU leaders dropping their usual public poise in a heated debate.

Dalia Grybauskaite, the Lithuanian president, declared Russia was “at war with Europe”. The German chancellor, Angela Merkel, the main mediator with Putin, was said to be furious with the Russian leader, warning that he was “irrational and unpredictable”, while David Cameron was said to have raised the issue of Britain discussing policy options regarding Putin.

Cameron likened the west’s dilemma with Putin to relations between the then British prime minister, Neville Chamberlain, with Adolf Hitler in Munich in 1938, when Anglo-French appeasement encouraged the Nazi leader to launch the second world war the following year.

“We run the risk of repeating the mistakes made in Munich in 1938. We cannot know what will happen next,” Cameron was reported as saying. “This time we cannot meet Putin’s demands. He has already taken Crimea and we cannot allow him to take the whole country.”

DBRS confirmed Aimia, proud issuer of AIM.PR.A and AIM.PR.C:

DBRS has today confirmed Aimia Inc.’s (Aimia or the Company) Issuer Rating at BBB and the ratings of its Senior Secured Debt and Preferred Shares at BBB and Pfd-3, respectively, all with Stable trends. The confirmation of the ratings is based on the Company’s relatively stable operating performance and credit metrics through 2013 and progress made to date with the Aeroplan program transformation and financial cards agreement with TD Bank Group (TD; rated AA with a Stable trend by DBRS) and Canadian Imperial Bank of Commerce (CIBC; rated AA with a Stable trend by DBRS). The ratings continue to be based on the strength of Aimia’s brands and its strong relationship with key commercial partners. The ratings also reflect the Company’s high exposure to consumer spending and redemption patterns, as well as the significant but moderating degree of revenue concentration.

DBRS expects Aimia’s financial profile to remain commensurate with the current rating category, based on strong and stable free cash flow-generating capacity and steady leverage. DBRS believes free cash flow will decline modestly due to slightly higher capex requirements and continued growth in the Company’s dividend payments. Free cash flow is expected to continue to be applied primarily toward small tuck-in acquisitions, most likely in the data analytics business. DBRS anticipates that Aimia will use cash on hand to repay approximately $150 million of debt maturing in 2014. As such, when combined with the expected decline in adjusted EBITDA, key credit metrics should remain appropriate for the current rating category (i.e., gross debt-to-adjusted EBITDA before distributions of approximately 1.75x to 2.25x and adjusted EBITDA coverage around 7.0x).

The Canadian preferred share market opened the month on a sour note, with PerpetualDiscounts losing 17bp, FixedResets down 6bp and DeemedRetractibles off 2bp. Volatility was low. Volume was practically non-existent.

HIMIPref™ Preferred Indices
These values reflect the December 2008 revision of the HIMIPref™ Indices

Values are provisional and are finalized monthly
Index Mean
Current
Yield
(at bid)
Median
YTW
Median
Average
Trading
Value
Median
Mod Dur
(YTW)
Issues Day’s Perf. Index Value
Ratchet 0.00 % 0.00 % 0 0.00 0 -0.1524 % 2,632.7
FixedFloater 4.15 % 3.40 % 26,891 18.57 1 0.1313 % 4,178.5
Floater 2.91 % 3.07 % 48,980 19.48 4 -0.1524 % 2,722.4
OpRet 4.05 % -0.65 % 95,144 0.08 1 -0.1184 % 2,726.0
SplitShare 4.29 % 3.95 % 117,934 3.95 5 -0.0997 % 3,148.3
Interest-Bearing 0.00 % 0.00 % 0 0.00 0 -0.1184 % 2,492.7
Perpetual-Premium 5.46 % -1.10 % 81,960 0.08 20 0.0118 % 2,440.9
Perpetual-Discount 5.22 % 5.14 % 111,574 15.20 16 -0.1709 % 2,607.6
FixedReset 4.23 % 3.69 % 182,792 6.63 74 -0.0588 % 2,570.6
Deemed-Retractible 5.00 % 1.44 % 107,607 0.17 42 -0.0228 % 2,566.3
FloatingReset 2.63 % 2.05 % 79,920 3.71 6 -0.2289 % 2,525.7
Performance Highlights
Issue Index Change Notes
PWF.PR.P FixedReset -1.20 % YTW SCENARIO
Maturity Type : Limit Maturity
Maturity Date : 2044-09-02
Maturity Price : 22.57
Evaluated at bid price : 23.00
Bid-YTW : 3.54 %
CIU.PR.C FixedReset 2.15 % YTW SCENARIO
Maturity Type : Limit Maturity
Maturity Date : 2044-09-02
Maturity Price : 20.95
Evaluated at bid price : 20.95
Bid-YTW : 3.61 %
Volume Highlights
Issue Index Shares
Traded
Notes
MFC.PR.M FixedReset 84,340 Recent new issue.
YTW SCENARIO
Maturity Type : Call
Maturity Date : 2019-12-19
Maturity Price : 25.00
Evaluated at bid price : 25.11
Bid-YTW : 3.87 %
RY.PR.B Deemed-Retractible 61,720 RBC crossed 50,000 at 25.51.
YTW SCENARIO
Maturity Type : Call
Maturity Date : 2014-10-02
Maturity Price : 25.25
Evaluated at bid price : 25.47
Bid-YTW : -4.48 %
MFC.PR.K FixedReset 52,050 Desjardins crossed 50,000 at 25.14.
YTW SCENARIO
Maturity Type : Call
Maturity Date : 2018-09-19
Maturity Price : 25.00
Evaluated at bid price : 25.07
Bid-YTW : 3.70 %
POW.PR.G Perpetual-Premium 31,307 Desjardins crossed 30,000 at 26.23.
YTW SCENARIO
Maturity Type : Call
Maturity Date : 2021-04-15
Maturity Price : 25.00
Evaluated at bid price : 26.18
Bid-YTW : 4.92 %
PWF.PR.T FixedReset 28,957 Desjardins crossed 26,200 at 26.05.
YTW SCENARIO
Maturity Type : Call
Maturity Date : 2019-01-31
Maturity Price : 25.00
Evaluated at bid price : 25.99
Bid-YTW : 3.33 %
TD.PF.B FixedReset 23,244 YTW SCENARIO
Maturity Type : Limit Maturity
Maturity Date : 2044-09-02
Maturity Price : 23.22
Evaluated at bid price : 25.16
Bid-YTW : 3.71 %
There were 6 other index-included issues trading in excess of 10,000 shares.
Wide Spread Highlights
Issue Index Quote Data and Yield Notes
MFC.PR.B Deemed-Retractible Quote: 23.22 – 23.48
Spot Rate : 0.2600
Average : 0.1704

YTW SCENARIO
Maturity Type : Hard Maturity
Maturity Date : 2025-01-31
Maturity Price : 25.00
Evaluated at bid price : 23.22
Bid-YTW : 5.56 %

BAM.PR.X FixedReset Quote: 22.43 – 22.70
Spot Rate : 0.2700
Average : 0.1880

YTW SCENARIO
Maturity Type : Limit Maturity
Maturity Date : 2044-09-02
Maturity Price : 22.08
Evaluated at bid price : 22.43
Bid-YTW : 4.00 %

PWF.PR.O Perpetual-Premium Quote: 26.21 – 26.48
Spot Rate : 0.2700
Average : 0.1926

YTW SCENARIO
Maturity Type : Call
Maturity Date : 2014-10-31
Maturity Price : 26.00
Evaluated at bid price : 26.21
Bid-YTW : 3.69 %

BAM.PR.M Perpetual-Discount Quote: 21.45 – 21.65
Spot Rate : 0.2000
Average : 0.1302

YTW SCENARIO
Maturity Type : Limit Maturity
Maturity Date : 2044-09-02
Maturity Price : 21.45
Evaluated at bid price : 21.45
Bid-YTW : 5.64 %

HSB.PR.C Deemed-Retractible Quote: 25.31 – 25.50
Spot Rate : 0.1900
Average : 0.1280

YTW SCENARIO
Maturity Type : Call
Maturity Date : 2014-10-02
Maturity Price : 25.00
Evaluated at bid price : 25.31
Bid-YTW : 0.76 %

BAM.PR.Z FixedReset Quote: 26.07 – 26.32
Spot Rate : 0.2500
Average : 0.1904

YTW SCENARIO
Maturity Type : Call
Maturity Date : 2017-12-31
Maturity Price : 25.00
Evaluated at bid price : 26.07
Bid-YTW : 3.71 %

MAPF Performance: August 2014

Monday, September 1st, 2014

The fund outperformed in August, assisted by its overweight positions in low-coupon insurance DeemedRetractibles, which outperformed.
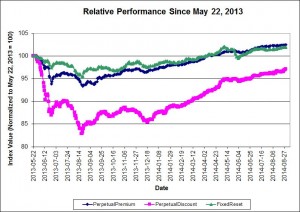
relPerf_140829
Click for Big

relYield_140829
Click for Big

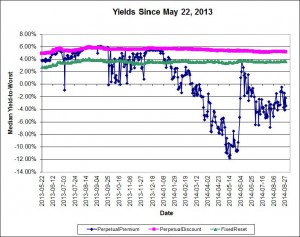
I continue to believe that the decline in the preferred share market remains overdone; the following table shows the increase in yields since May 22, 2013, of some fixed income sectors:

Yield Changes
May 22, 2013
to
August 29, 2014
Sector Yield
May 22
2013
Yield
August 29
2014
Change
Five-Year Canadas 1.38% 1.51% +13bp
Long Canadas 2.57% 2.56% -1bp
Long Corporates 4.15% 4.1% -5bp
FixedResets
Investment Grade
(Interest Equivalent)
3.51% 4.73% +122bp
Perpetual-Discounts
Investment Grade
(Interest Equivalent)
6.34% 6.67% +33bp
The change in yield of PerpetualDiscounts is understated due a massive influx of issues from the PerpetualPremium sub-index over the period, which improved credit quality. When the four issues that comprised the PerpetualDiscount sub-index as of May 22, 2013 are evaluated as of August 29, 2014, the interest-equivalent yield is 7.22% and thus the change is +88bp.

ZPR, is an ETF comprised of FixedResets and Floating Rate issues and a very high proportion of junk issues, returned +%, +% and +% over the past one-, three- and twelve-month periods, respectively (according to the fund’s data), versus returns for the TXPL index of +0.74%, +2.73% and +5.51% respectively. The fund has been able to attract assets of about $1,055-million since inception in November 2012; AUM increased by $15-million in August; given an index return of +0.74% an increase of $7.8-million was expected, indicating that money is still flowing into the fund. I feel that the flows into and out of this fund are very important in determining the performance of its constituents.

TXPR had returns over one- and three-months of +0.69% and +2.41%, respectively with CPD performance within expectations.

Returns for the HIMIPref™ investment grade sub-indices for August were as follows:

HIMIPref™ Indices
Performance to August 29, 2014
Sub-Index 1-Month 3-month
Ratchet N/A N/A
FixFloat +0.22% +9.94%
Floater +1.12% +1.23%
OpRet +0.46% +0.71%
SplitShare +0.93% +1.07%
Interest N/A N/A
PerpetualPremium +0.35% +1.49%
PerpetualDiscount +0.99% +2.40%
FixedReset +0.50% +2.17%
DeemedRetractible +0.45% +1.89%
FloatingReset +0.66% +2.02%

Malachite Aggressive Preferred Fund’s Net Asset Value per Unit as of the close August 29, 2014, was $10.6606.

Returns to August 29, 2014
Period MAPF BMO-CM “50” Index TXPR
Total Return
CPD – according to Blackrock
One Month +0.92% +0.63% +0.69% N/A
Three Months +2.09% +2.22% +2.41% N/A
One Year +11.34% +5.48% +6.65% +6.10%
Two Years (annualized) +4.98% +2.90% +2.75% N/A
Three Years (annualized) +4.73% +3.84% +3.57% +3.08%
Four Years (annualized) +7.15% +5.55% +4.77% N/A
Five Years (annualized) +7.61% +5.69% +5.02% +4.38%
Six Years (annualized) +14.79% +6.15% +5.26%  
Seven Years (annualized) +12.34% +4.40% +3.50%  
Eight Years (annualized) +11.18% +3.89%    
Nine Years (annualized) +10.58% +3.87%    
Ten Years (annualized) +10.17% +3.98%    
Eleven Years (annualized) +10.86% +4.15%    
Twelve Years (annualized) +11.47% +4.34%    
Thirteen Years (annualized) +11.13% +4.25%    
MAPF returns assume reinvestment of distributions, and are shown after expenses but before fees.
CPD Returns are for the NAV and are after all fees and expenses.
* CPD does not directly report its two- or four-year returns.
Figures for National Bank Preferred Equity Income Fund (formerly Omega Preferred Equity) (which are after all fees and expenses) for 1-, 3- and 12-months are +0.60%, +1.97% and +6.79%, respectively, according to Morningstar after all fees & expenses. Three year performance is +3.90%; five year is +5.24%
Figures for Jov Leon Frazer Preferred Equity Fund Class I Units (which are after all fees and expenses) for 1-, 3- and 12-months are +0.39%, +1.47% and +3.07% respectively, according to Morningstar. Three Year performance is +1.35%; five-year is +2.60%
Figures for Manulife Preferred Income Fund (formerly AIC Preferred Income Fund) (which are after all fees and expenses) for 1-, 3- and 12-months are +0.86%, +2.40% & +4.40%, respectively. Three Year performance is +1.74%; five-year is +2.92%
Figures for Horizons AlphaPro Preferred Share ETF (which are after all fees and expenses) for 1-, 3- and 12-months are +0.60%, +2.15% & +6.75%, respectively. Three year performance is +4.50%
Figures for National Bank Preferred Equity Fund (formerly Altamira Preferred Equity Fund) are +0.62%, +2.08% and +4.86% for one-, three- and twelve months, respectively.
The figure for BMO S&P/TSX Laddered Preferred Share Index ETF is +0.64%, +2.51% and +5.47% for one-, three- and twelve-months, respectively.
Figures for NexGen Canadian Preferred Share Tax Managed Fund are not available although I believe the first year black-out period has expired.
Figures for BMO Preferred Share Fund are +1.80% and +3.89% for the past three- and twelve-months, respectively.

MAPF returns assume reinvestment of dividends, and are shown after expenses but before fees. Past performance is not a guarantee of future performance. You can lose money investing in Malachite Aggressive Preferred Fund or any other fund. For more information, see the fund’s main page. The fund is available either directly from Hymas Investment Management or through a brokerage account at Odlum Brown Limited.

A problem that has bedevilled the market over the past two years has been the OSFI decision not to grandfather Straight Perpetuals as Tier 1 bank capital, and their continued foot-dragging regarding a decision on insurer Straight Perpetuals has segmented the market to the point where trading has become much more difficult. The fund occasionally finds an attractive opportunity to trade between GWO issues, which have a good range of annual coupons (but in which trading is now hampered by the fact that the low-coupon issues are trading near par and are callable at par in the near term), but is “stuck” in the MFC and SLF issues, which have a much narrower range of coupon, while the IAG DeemedRetractibles are quite illiquid. Until the market became so grossly segmented, this was not so much of a problem – but now banks are not available to swap into (because they are so expensive) and non-regulated companies are likewise deprecated (because they are not DeemedRetractibles; they should not participate in the increase in value that will follow the OSFI decision I anticipate and, in addition, are analyzed as perpetuals). The fund’s portfolio is, in effect ‘locked in’ to the MFC & SLF issues due to projected gains from a future OSFI decision, to the detriment of trading gains particularly in May, 2013, when the three lowest-coupon SLF DeemedRetractibles (SLF.PR.C, SLF.PR.D and SLF.PR.E) were the worst performing DeemedRetractibles in the sub-index, and in June, 2013, when the insurance-issued DeemedRetractibles behaved like PerpetualDiscounts in a sharply negative market.

However, it will be noted, as discussed in the August report on Portfolio Composition that the month saw some swaps from the low-coupon SLF Straights to a low-spread SLF FixedReset … so there are some opportunities to trade, although they don’t happen often! There were similar swaps executed in June and July.

At this point, the composition of the BMO-CM “50” index should be discussed; it has greatly outperformed TXPR over the year to May 30, and MAPF holders will have noticed that the fund only just returned to a positive differential against BMO-CM “50” on a year-over-year basis to May 30. While I have not done a thorough analysis of the difference, I’ve done some approximations – note that the numbers in this section are approximations, but are close enough for government work.

I believe that BMO-CM “50” has benefitted greatly over the past year by being over-weight in bank Straight Perpetuals relative to other Straight Perpetuals:

Sampling Error in BMO-CM “50”
Class of
Straight
Perpetual
BMO-CM “50”
Weight
May 2013
Proportion of BMO-CM “50” Straights Shares
Outstanding
May 2014
Proportion
Shares
Outstanding
Performance
May 2013
to
May 2014
Bank DeemedRetractible 17.7% 59.8% 240.5-million 34.9% +4.81%
Insurance DeemedRetractible 6.5% 22.0% 183.5-million 26.6% -0.86%
Bank Straight 1.8% 6.1% 47.2-million 6.8% +4.88%
Straight 3.6% 12.2% 218.6-million 31.7% +0.51%

Thus we see that at the beginning of the downdraft, the BMO-CM “50” was highly overweighted in Bank DeemedRetractibles, which performed quite well over the year, and highly underweighted in Straight Perpetuals, which underperformed. Weightings in the other two sectors were about right. It’s no wonder the fund struggled to outperform the BMO-CM “50” index in the period May, 2013, to May, 2014, and no wonder BMO-CM “50” outperformed TXPR!

In August, insurance DeemedRetractibles outperformed bank DeemedRetractibles:
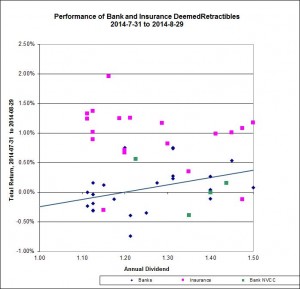
bankInsDRPerf_140829Click for Big

… and slightly outperformed Unregulated Straight Perpetuals, although that looks like it could be a “coupon distribution thing” rather than a “sectoral preference thing”.
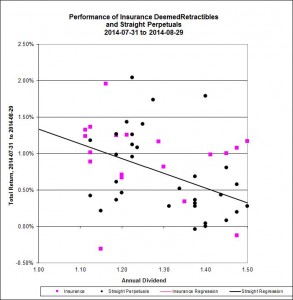
straightInsDRPerf_140829
Click for Big

Of the regressions shown in the above two charts, the Adjusted Correlation of the Bank DeemedRetractible performance is a mere 12%, Straight Perpetuals come in at 14% and Insurance DeemedRetractibles (not shown because it’s so lousy) are at a big fat 0%. Average performance are:

  • Bank Deemed Retractibles: +0.05%
  • Insurance DeemedRetractibles: +0.93%
  • Unregulated Straight Perpetuals: +0.72%

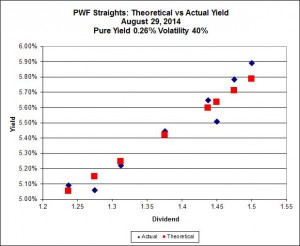
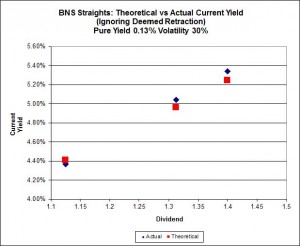
A lingering effect of the downdraft of 2013 has been the return of measurable Implied Volatility (all Implied Volatility calculations use bids from August 29):

ImpVol_GWO_140829
Click for Big

ImpVol_PWF_140829
Click for Big

ImpVol_BNS_140829
Click for Big

Implied Volatility of
Three Series of Straight Perpetuals
August 29, 2014
Issuer Pure Yield Implied Volatility
GWO 3.80% (-0.40) 22% (+4)
PWF 0.26% (-0.57) 40% (+1)
BNS 0.13% (+0.04) 30% (0)
Bracketted figures are changes since July month-end

It is disconcerting to see the difference between GWO and PWF; if anything, we would expect the implied volatility for GWO to be higher, given that the DeemedRetraction – not yet given significant credence by the market – implies a directionality in prices. The GWO data with the best fit derived for PWF is distinguishable from the best fit; the best fit has a lower Sum of Squared Errors (1.01 vs 1.49):
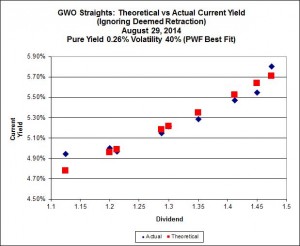
ImpVol_GWO_PWF_140829
Click for Big

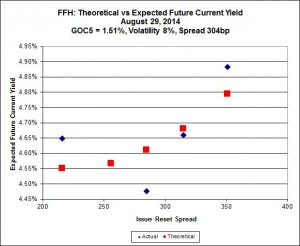
In the September, 2013, edition of PrefLetter, I extended the theory of Implied Volatility to FixedResets – relating the option feature of the Issue Reset Spreads to a theoretical non-callable Market Spread.
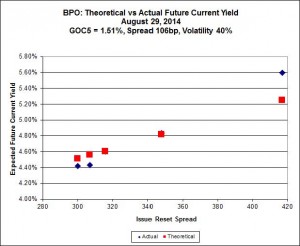
ImpVol_BPO_140829
Click for Big

ImpVol_FFH_140829Click for Big

Implied Volatility of
Two Series of FixedResets
August 29, 2014
Issuer Market Reset Spread
(Non-Callable)
Implied Volatility
BPO 106bp (-5) 40% (0)
FFH 304bp (-3) 8% (-1)
Bracketted figures are changes since July month-end

These are very interesting results: The BPO issues are trading as if calls are a certainty, while FFH issues are trading as if calls are much less likely. The FFH series continues to be perplexing, this time with the four lower-coupon issues showing virtually no implied volatility – with the highest coupon issue (FFH.PR.K) being well off the mark … all I can think of is that the market has decided that FFH.PR.K, with an Issue Reset Spread of 351bp, is sure to be called in 2017, while the other four (highest spread is FFH.PR.C, +315) are not at all likely to be called.

Those of you who have been paying attention will remember that in a “normal” market (which we have not seen in well over a year) the slope of this line is related to the implied volatility of yields in Black-Scholes theory, as discussed in the January, 2010, edition of PrefLetter. As has been previously noted, very high levels of Implied Volatility (in the 40% range, at which point the calculation may be considered virtually meaningless) imply a very strong expectation of directionality in future prices – i.e, an expectation that all issues will be redeemed at par.

It is significant that the preferred share market knows no moderation. I suggest that a good baseline estimate for Volatility over a three year period is 15% but the observed figure is generally higher in a rising market and lower in a declining one … with, of course, a period of adjustment in between, which I suspect we are currently experiencing.

Sometimes everything works … sometimes it’s 50-50 … sometimes nothing works. The fund seeks to earn incremental return by selling liquidity (that is, taking the other side of trades that other market participants are strongly motivated to execute), which can also be referred to as ‘trading noise’ – although for quite some time, noise trading has taken a distant second place to the sectoral play on insurance DeemedRetractibles; something that dismays me, particularly given that the market does not yet agree with me regarding the insurance issues! There were a lot of strongly motivated market participants during the Panic of 2007, generating a lot of noise! Unfortunately, the conditions of the Panic may never be repeated in my lifetime … but the fund will simply attempt to make trades when swaps seem profitable, without worrying about the level of monthly turnover.

There’s plenty of room for new money left in the fund. I have shown in PrefLetter that market pricing for FixedResets is very often irrational and I have lots of confidence – backed up by my bond portfolio management experience in the markets for Canadas and Treasuries, and equity trading on the NYSE & TSX – that there is enough demand for liquidity in any market to make the effort of providing it worthwhile (although the definition of “worthwhile” in terms of basis points of outperformance changes considerably from market to market!) I will continue to exert utmost efforts to outperform but it should be borne in mind that there will almost inevitably be periods of underperformance in the future.

The yields available on high quality preferred shares remain elevated, which is reflected in the current estimate of sustainable income.

Calculation of MAPF Sustainable Income Per Unit
Month NAVPU Portfolio
Average
YTW
Leverage
Divisor
Securities
Average
YTW
Capital
Gains
Multiplier
Sustainable
Income
per
current
Unit
June, 2007 9.3114 5.16% 1.03 5.01% 1.3240 0.3524
September 9.1489 5.35% 0.98 5.46% 1.3240 0.3773
December, 2007 9.0070 5.53% 0.942 5.87% 1.3240 0.3993
March, 2008 8.8512 6.17% 1.047 5.89% 1.3240 0.3938
June 8.3419 6.034% 0.952 6.338% 1.3240 $0.3993
September 8.1886 7.108% 0.969 7.335% 1.3240 $0.4537
December, 2008 8.0464 9.24% 1.008 9.166% 1.3240 $0.5571
March 2009 $8.8317 8.60% 0.995 8.802% 1.3240 $0.5872
June 10.9846 7.05% 0.999 7.057% 1.3240 $0.5855
September 12.3462 6.03% 0.998 6.042% 1.3240 $0.5634
December 2009 10.5662 5.74% 0.981 5.851% 1.1141 $0.5549
March 2010 10.2497 6.03% 0.992 6.079% 1.1141 $0.5593
June 10.5770 5.96% 0.996 5.984% 1.1141 $0.5681
September 11.3901 5.43% 0.980 5.540% 1.1141 $0.5664
December 2010 10.7659 5.37% 0.993 5.408% 1.0298 $0.5654
March, 2011 11.0560 6.00% 0.994 5.964% 1.0298 $0.6403
June 11.1194 5.87% 1.018 5.976% 1.0298 $0.6453
September 10.2709 6.10%
Note
1.001 6.106% 1.0298 $0.6090
December, 2011 10.0793 5.63%
Note
1.031 5.805% 1.0000 $0.5851
March, 2012 10.3944 5.13%
Note
0.996 5.109% 1.0000 $0.5310
June 10.2151 5.32%
Note
1.012 5.384% 1.0000 $0.5500
September 10.6703 4.61%
Note
0.997 4.624% 1.0000 $0.4934
December, 2012 10.8307 4.24% 0.989 4.287% 1.0000 $0.4643
March, 2013 10.9033 3.87% 0.996 3.886% 1.0000 $0.4237
June 10.3261 4.81% 0.998 4.80% 1.0000 $0.4957
September 10.0296 5.62% 0.996 5.643% 1.0000 $0.5660
December, 2013 9.8717 6.02% 1.008 5.972% 1.0000 $0.5895
March, 2014 10.2233 5.55% 0.998 5.561% 1.0000 $0.5685
June 10.5877 5.09% 0.998 5.100% 1.0000 $0.5395
August, 2014 10.6606 5.01% 1.016 5.090% 1.0000 $0.5426
NAVPU is shown after quarterly distributions of dividend income and annual distribution of capital gains.
Portfolio YTW includes cash (or margin borrowing), with an assumed interest rate of 0.00%
The Leverage Divisor indicates the level of cash in the account: if the portfolio is 1% in cash, the Leverage Divisor will be 0.99
Securities YTW divides “Portfolio YTW” by the “Leverage Divisor” to show the average YTW on the securities held; this assumes that the cash is invested in (or raised from) all securities held, in proportion to their holdings.
The Capital Gains Multiplier adjusts for the effects of Capital Gains Dividends. On 2009-12-31, there was a capital gains distribution of $1.989262 which is assumed for this purpose to have been reinvested at the final price of $10.5662. Thus, a holder of one unit pre-distribution would have held 1.1883 units post-distribution; the CG Multiplier reflects this to make the time-series comparable. Note that Dividend Distributions are not assumed to be reinvested.
Sustainable Income is the resultant estimate of the fund’s dividend income per current unit, before fees and expenses. Note that a “current unit” includes reinvestment of prior capital gains; a unitholder would have had the calculated sustainable income with only, say, 0.9 units in the past which, with reinvestment of capital gains, would become 1.0 current units.
DeemedRetractibles are comprised of all Straight Perpetuals (both PerpetualDiscount and PerpetualPremium) issued by BMO, BNS, CM, ELF, GWO, HSB, IAG, MFC, NA, RY, SLF and TD, which are not exchangable into common at the option of the company (definition refined in May, 2011). These issues are analyzed as if their prospectuses included a requirement to redeem at par on or prior to 2022-1-31 (banks) or 2025-1-31 (insurers and insurance holding companies), in addition to the call schedule explicitly defined. See OSFI Does Not Grandfather Extant Tier 1 Capital, CM.PR.D, CM.PR.E, CM.PR.G: Seeking NVCC Status and the January, February, March and June, 2011, editions of PrefLetter for the rationale behind this analysis.
Yields for September, 2011, to January, 2012, were calculated by imposing a cap of 10% on the yields of YLO issues held, in order to avoid their extremely high calculated yields distorting the calculation and to reflect the uncertainty in the marketplace that these yields will be realized. From February to September 2012, yields on these issues have been set to zero. All YLO issues held were sold in October 2012.

Significant positions were held in DeemedRetractible, SplitShare and FixedReset issues on August 29; all of these currently have their yields calculated with the presumption that they will be called by the issuers at par prior to 2022-1-31 (banks) or 2025-1-31 (insurers and insurance holding companies) or on a different date (SplitShares). This presents another complication in the calculation of sustainable yield. The fund also holds positions in various SplitShare issues which also have their yields calculated with the expectation of a maturity at par.

I no longer show calculations that assume the conversion of the entire portfolio into PerpetualDiscounts, as the fund has only a small position in these issues.

I will also note that the sustainable yield calculated above is not directly comparable with any yield calculation currently reported by any other preferred share fund as far as I am aware. The Sustainable Yield depends on:
i) Calculating Yield-to-Worst for each instrument and using this yield for reporting purposes;
ii) Using the contemporary value of Five-Year Canadas (set at 1.51% for the August 29 calculation) to estimate dividends after reset for FixedResets.

Most funds report Current Yield. For instance, ZPR reports a “Dividend Yield” of 4.6% as of July 31, 2014, but this is the Current Yield, a meaningless number. The Current Yield of MAPF was 4.90% as of July 30, but I will neither report that with any degree of prominence nor take any great pleasure in the fact that it’s a little higher than the ZPR number. It’s meaningless; to discuss it in the context of portfolio reporting is misleading.

However, BMO has taken a significant step forward in that they are no longer reporting the “Portfolio Yield” directly on their website; the information is taken from the “Enhanced Fund Profile” which is available only as a PDF link. CPD doesn’t report this metric on the CPD fact sheet or on their website. I may have one less thing to mock the fundcos about!

It should be noted that the concept of this Sustainable Income calculation was developed when the fund’s holdings were overwhelmingly PerpetualDiscounts – see, for instance, the bottom of the market in November 2008. It is easy to understand that for a PerpetualDiscount, the technique of multiplying yield by price will indeed result in the coupon – a PerpetualDiscount paying $1 annually will show a Sustainable Income of $1, regardless of whether the price is $24 or $17.

Things are not quite so neat when maturity dates and maturity prices that are different from the current price are thrown into the mix. If we take a notional Straight Perpetual paying $5 annually, the price is $100 when the yield is 5% (all this ignores option effects). As the yield increases to 6%, the price declines to 83.33; and 83.33 x 6% is the same $5. Good enough.

But a ten year bond, priced at 100 when the yield is equal to its coupon of 5%, will decline in price to 92.56; and 92.56 x 6% is 5.55; thus, the calculated Sustainable Income has increased as the price has declined as shown in the graph:
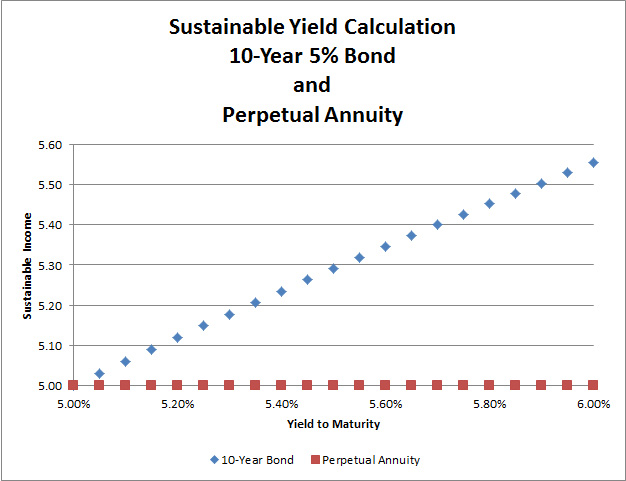

Click for Big

The difference is because the bond’s yield calculation includes the amortization of the discount; therefore, so does the Sustainable Income estimate.

Different assumptions lead to different results from the calculation, but the overall positive trend is apparent. I’m very pleased with the long-term results! It will be noted that if there was no trading in the portfolio, one would expect the sustainable yield to be constant (before fees and expenses). The success of the fund’s trading is showing up in

  • the very good performance against the index
  • the long term increases in sustainable income per unit

As has been noted, the fund has maintained a credit quality equal to or better than the index; outperformance has generally been due to exploitation of trading anomalies.

Again, there are no predictions for the future! The fund will continue to trade between issues in an attempt to exploit market gaps in liquidity, in an effort to outperform the index and keep the sustainable income per unit – however calculated! – growing.