There is a lot of confusion about Bombardier valuation:
On Monday, Mr. Tyerman cut his rating on the beleaguered stock to “sell” from “hold” and slashed his one-year price target on the company’s subordinated voting Class B shares to $1.10 from $1.35.
…
On Tuesday, Mr. Tyerman grounded his previous call. His new target has soared to $1.40, with a restored, turbulence-free rating of “hold.” He’s still got a downside target on the stock should Canada invest, but it is now $1.20, not 60 cents.
…
The reason for his change of course? Mr. Tyerman credits a “revised view of how a possible Canadian federal government investment in the C Series could play out,” apparently based on subsequent discussions with Bombardier. The analyst’s previously published view was that if Canada matched Quebec, the two governments would own a combined 99 per cent of the airliner project, leaving just 1 per cent of the economics of the plane for existing investors to share, and missing out on most of the upside if the poor selling plane actually becomes popular. That was based on Quebec securing 49.5 per cent ownership of the C Series program as part of its investment.But Mr. Tyerman’s revised view is that the company “will retain more of the C Series economics than in our previous target,” or a one-third economic interest even if Canada were to put in a full $1-billion.
Huh. So the valuation of the common has been improved because of some feeling that the feds are going to get taken to the cleaners. Well, I suppose that’s even better than simply bailing them out in the first place, eh? Still, trouble with the C Series has returned Bombardier to its core competency:
Bombardier Inc. has increased lobbying of Canada’s federal government to an eight-year high, reinforcing its Ottawa connections as officials there prepare to review whether to join Quebec in helping bail out the struggling CSeries jet.
Canada’s largest aerospace company communicated 50 times with federal officials since Jan. 1, more than any full year in records dating to 2007, according to the government’s lobbyist registry. The total for 2014 was 48.
…
“Government relations have historically been at the heart of what Bombardier does,” Louis Hebert, a management strategy professor at the HEC Montreal business school, said in a telephone interview. “They are returning to their traditional competitive advantage.”Industry Minister James Moore and staff of the industry department were the most frequent points of contact for Bombardier representatives, with at least 21 reported communications this year, the data show. Bombardier officials also met International Trade Minister Ed Fast and Finance Minister Joe Oliver.
Bombardier also spent more time lobbying Prime Minister Stephen Harper’s office this year, the records show. The company communicated with officials from Harper’s office seven times this year, compared with three times in 2014 and once in 2013.
Meanwhile, all the other piggies at the trough are jostling for position as the slops come into view:
Before the first dime of public money is spent, a strong made-in-Canada supply policy needs to be firmly in place. Without that, new jobs will not be created and existing ones will not be preserved. That policy needs to be paired with a review of a domestic playing field that leaves many Canadian companies at a disadvantage to cheap, subsidized imports.
At the same time, the government needs to reinvigorate the federal steel caucus, including MPs from all ridings where steel is manufactured.
It should also introduce a mechanism that adjusts import levels based on domestic capacity utilization. When Canadian steel production falls below a certain threshold, companies would be stabilized by the trigger of variable duties.
The BCSC has announced a new way to spend money:
The British Columbia Securities Commission (BCSC) today released the Smarter Investor Study, national research that examines client-advisor relationships in Canada, and introduces a new lens for understanding how personality affects Canadians’ investment decisions.
“Our Smarter Investor Study identifies five personality types within our sample group – confident, diligent, impulsive, reserved, and tumultuous,” said Brenda Leong, Chair and CEO of the BCSC. “What we found is that your personality plays a role when it comes to how you invest, particularly when you work with an advisor,”
Investors can find out their own personality and how it impacts their investing decisions by taking the Smarter Investor Quiz.
…
One key finding reveals that while Canadians in general-investors and non-investors alike-index at 62 on the 100-point scale. Those who work with an advisor are at 70 out of 100.Other key findings include:
- •While 30% of Canadians 35 and older invest with an advisor, more than half are not sure what they pay and less than one in five knows how their advisor is paid or have never asked about compensation.
- •Six in 10 Canadians (61%) who invest with an advisor say that they always read the statements they received.
- •Less than half (46%) of Canadians who invest with an advisor report having checked into the advisor’s background before they began working with them.
- •Of those who say they did a background check, slightly more than half (53%) checked their advisor’s registration.
- •30% of Canadians 35 and older invest with an advisor. Of the 70% who do not, 19% are DIY investors (those who invest but do not work with an advisor). A further 52% do not have any investments.
- •Investors recognize that they have responsibilities. The study asked which of various responsibilities investors believed were either wholly or partially theirs when working with an advisor. The highest agreement for any one item was 76% (asking questions), while only 40% agreed that doing independent research was a part of their responsibility.
Accoording to the full report, the research was undertaken by Innovative Research Group Inc. I looked at their website; they are very shy about identifying themselves:
Who we are
We come from the client’s side. We came to research because we needed it to help us achieve our goals and we remain focused on serving our clients’ needs first.
We’re team players. We build successful, long-term partnerships with our clients and guide them through the intricacies of research, strategy and problem solving.
The core INNOVATIVE team is composed of seasoned practitioners with a proven track record over a wide array of challenges, and dedicated specialists with a unique command of critical skills.
INNOVATIVE complements its core team through relationships with leading research academics and professionals, connecting our staff to the latest in research techniques.
That’s it. No names, no pack-drill, nothing. It is also of interest to learn that the Canada 2020 Panel important in the preparation of the paper is self-selected, at least in part.
I don’t see the point of this research, frankly, but I suppose it helps get rid of a little excess money.
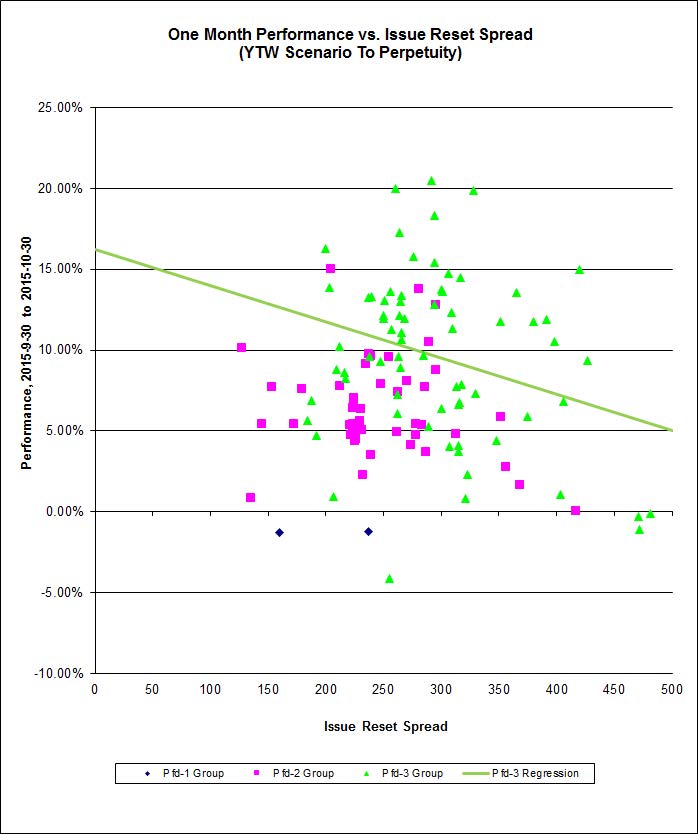
It was another mixed day for the Canadian preferred share market, with PerpetualDiscounts up 25bp, FixedResets gaining 16bp and DeemedRetractibles off 5bp. The Performance Highlights table is again lengthy, indicating continued churn in the market. Volume was above average.
For as long as the FixedReset market is so violently unsettled, I’ll keep publishing updates of the more interesting and meaningful series of FixedResets’ Implied Volatilities. This doesn’t include Enbridge because although Enbridge has a large number of issues outstanding, all of which are quite liquid, the range of Issue Reset Spreads is too small for decent conclusions. The low is 212bp (ENB.PR.H; second-lowest is ENB.PR.D at 237bp) and the high is a mere 268 for ENB.PF.G.
Remember that all rich /cheap assessments are:
» based on Implied Volatility Theory only
» are relative only to other FixedResets from the same issuer
» assume constant GOC-5 yield
» assume constant Implied Volatility
» assume constant spread
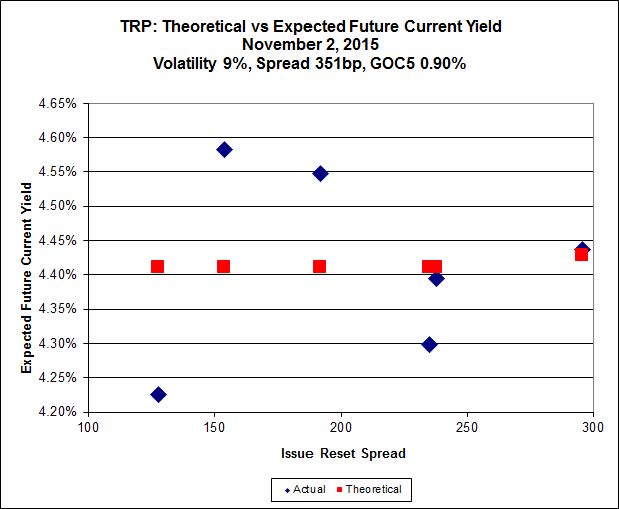
Here’s TRP:

Click for Big
TRP.PR.E, which resets 2019-10-30 at +235, is bid at 19.16 to be $0.57 rich, while TRP.PR.C, resetting 2016-1-30 at +154, is $0.80 cheap at its bid price of 13.20.

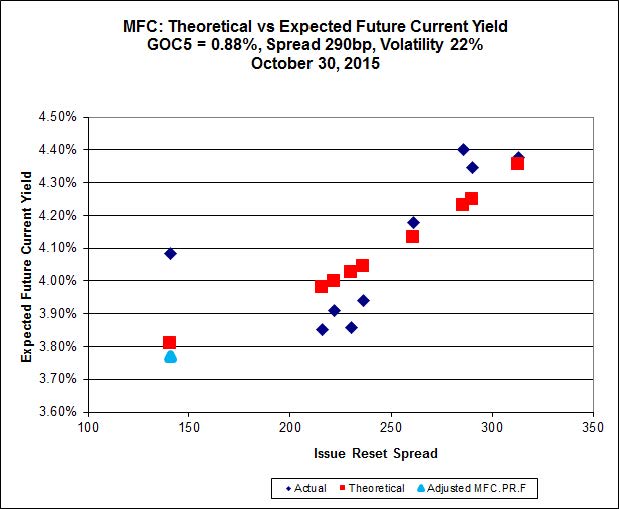
Click for Big
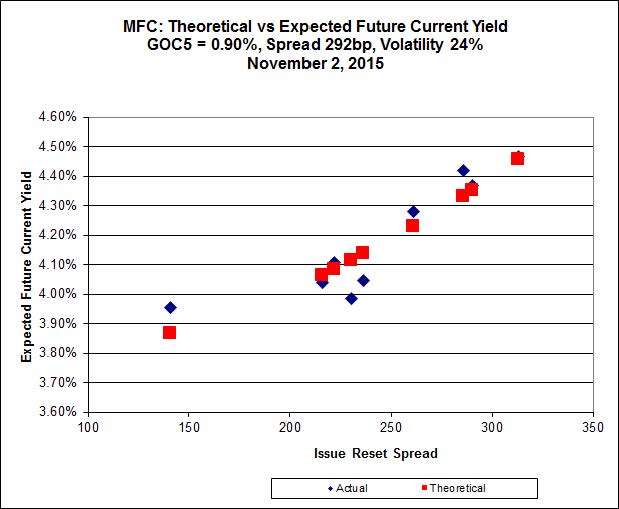
Most expensive is MFC.PR.N, resetting at +230bp on 2020-3-19, bid at 20.35 to be 0.96 rich, while MFC.PR.F resetting at +141bp on 2016-6-19, is bid at 14.35 to be 0.69 cheap.

Click for Big
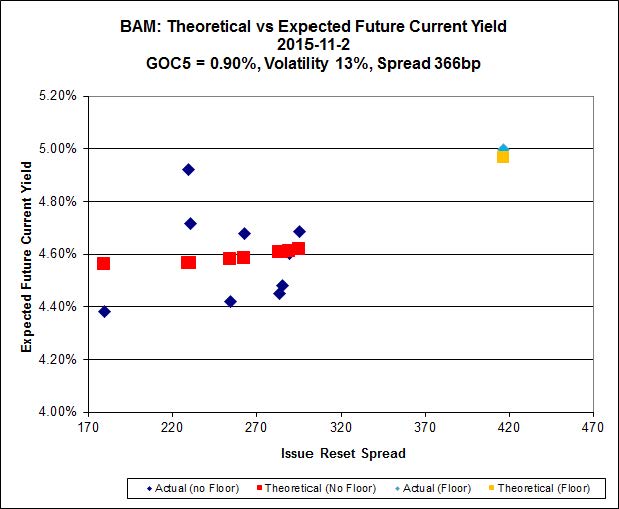
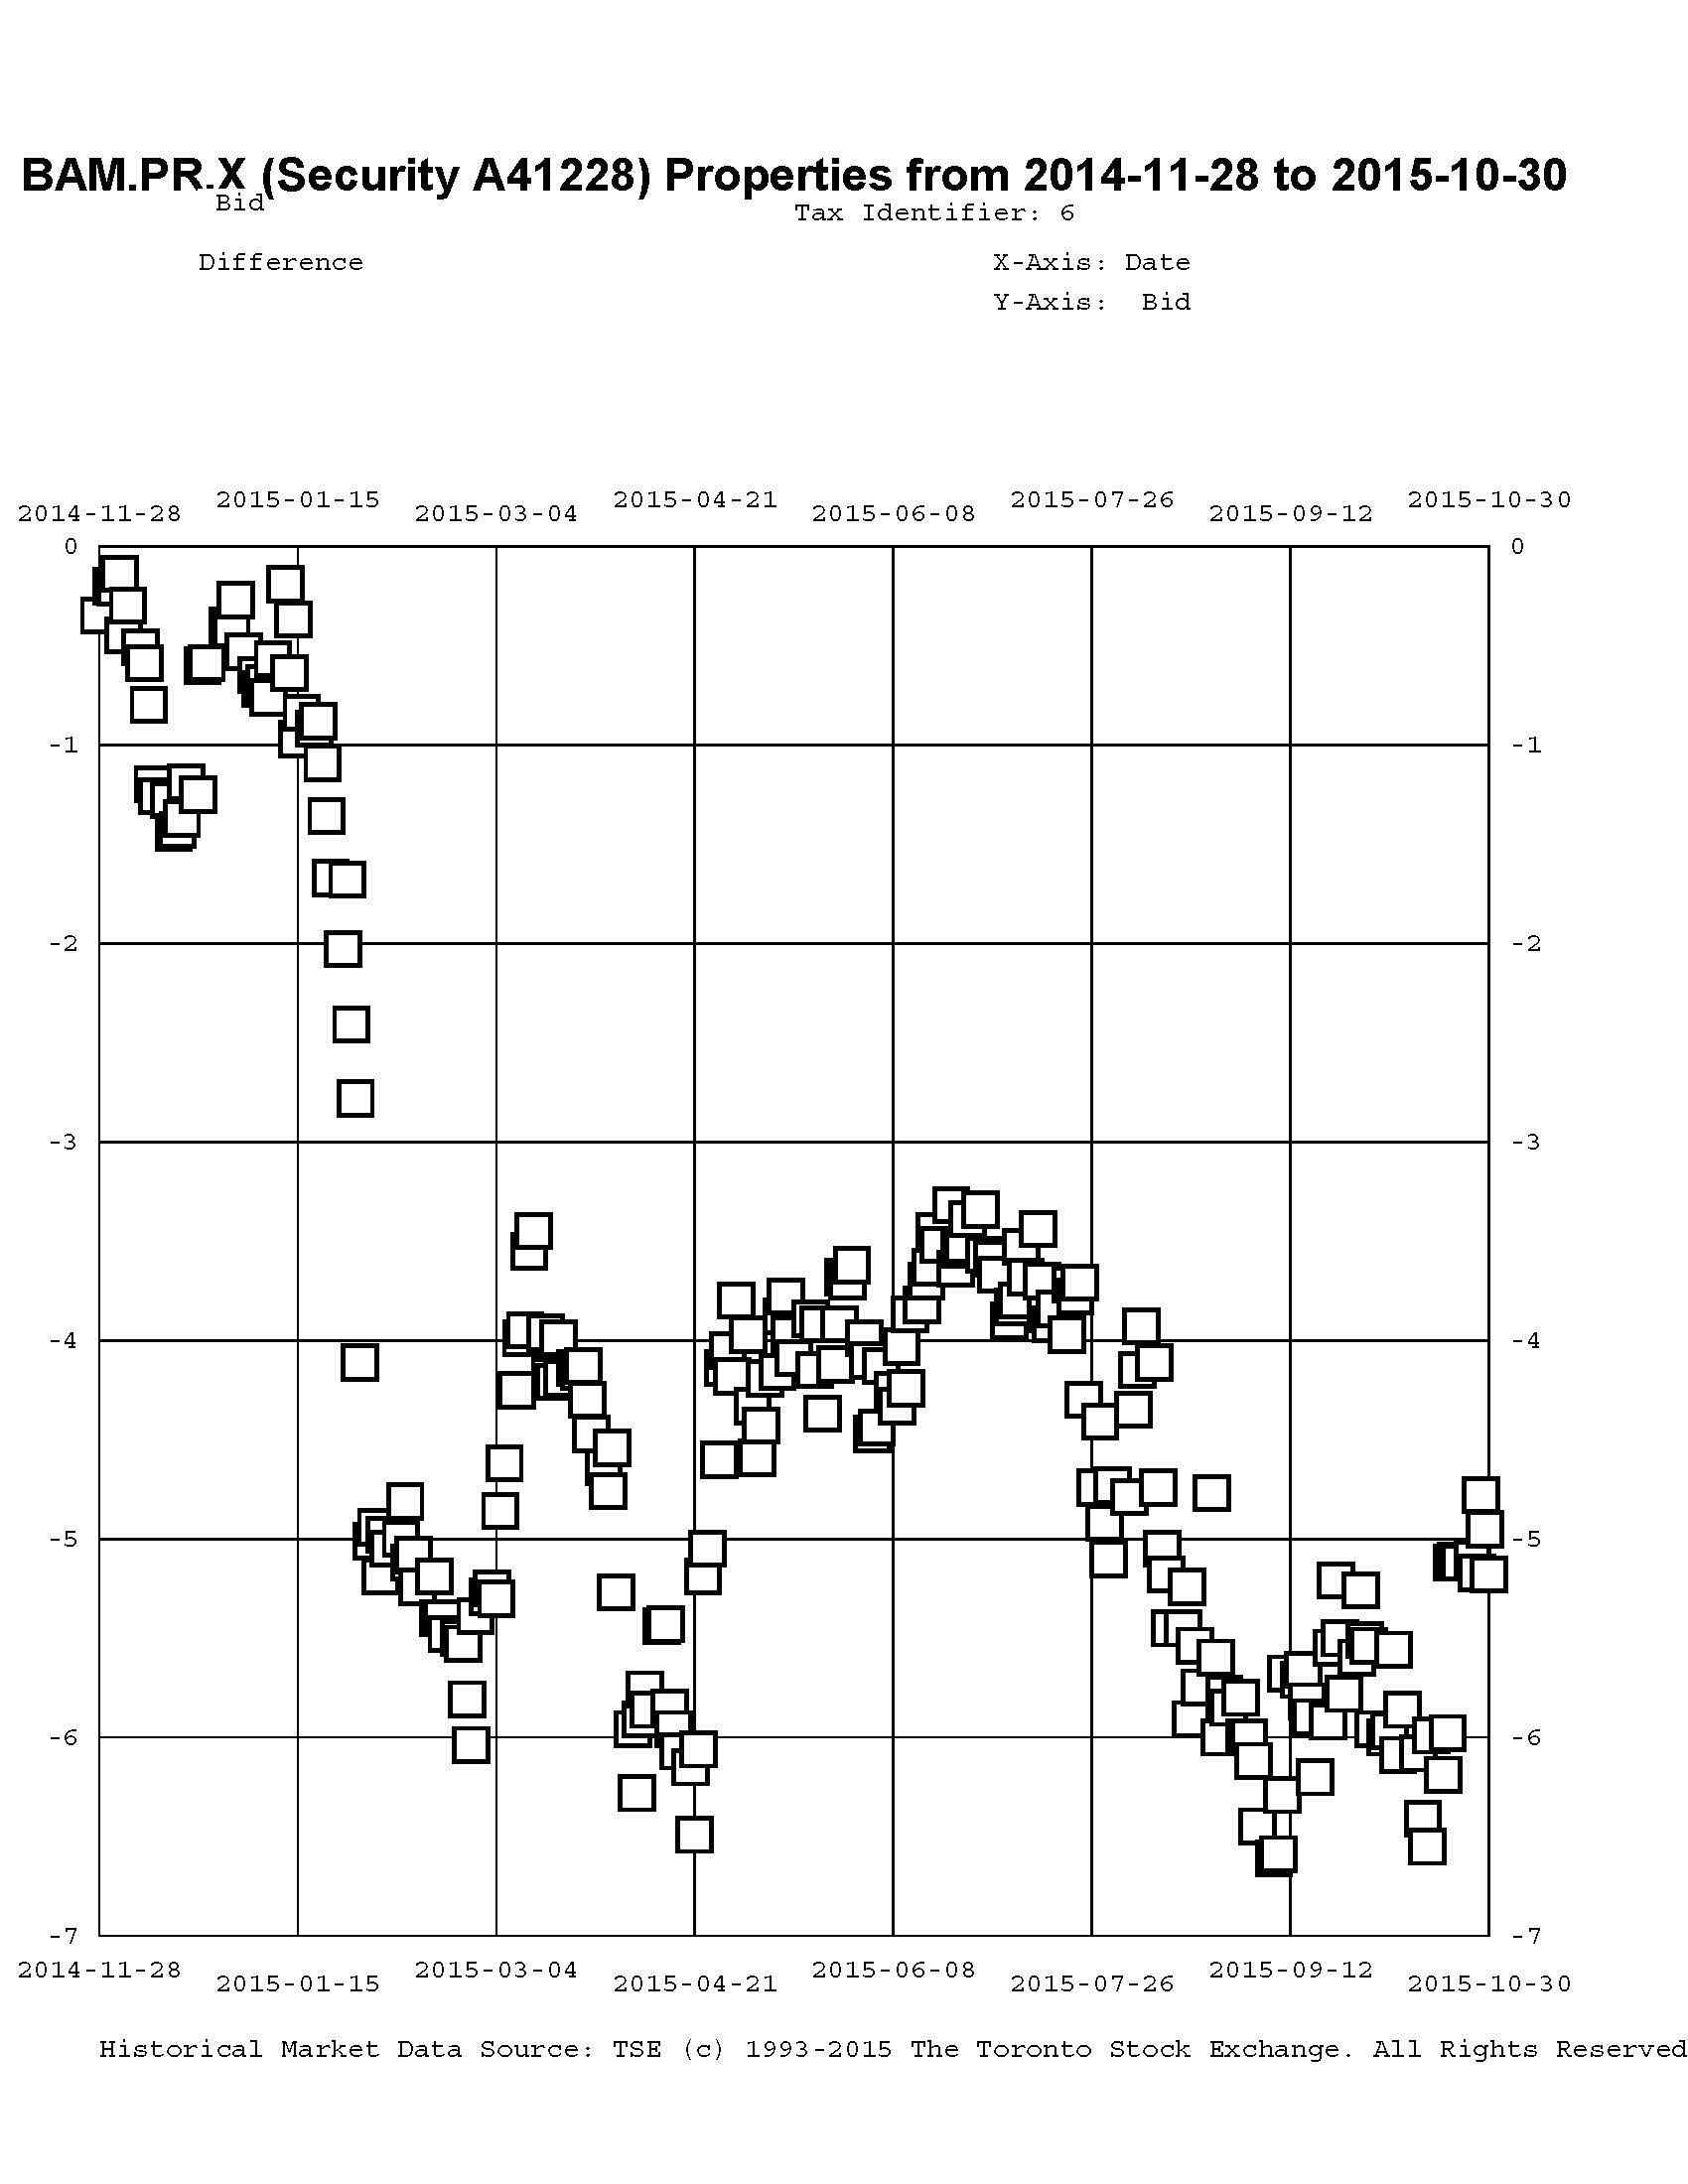
The cheapest issue relative to its peers is BAM.PR.R, resetting at +230bp on 2016-6-30, bid at 16.30 to be $1.40 cheap. BAM.PF.E, resetting at +255bp on 2020-3-31 is bid at 20.65 and appears to be $1.62 rich.

Click for Big
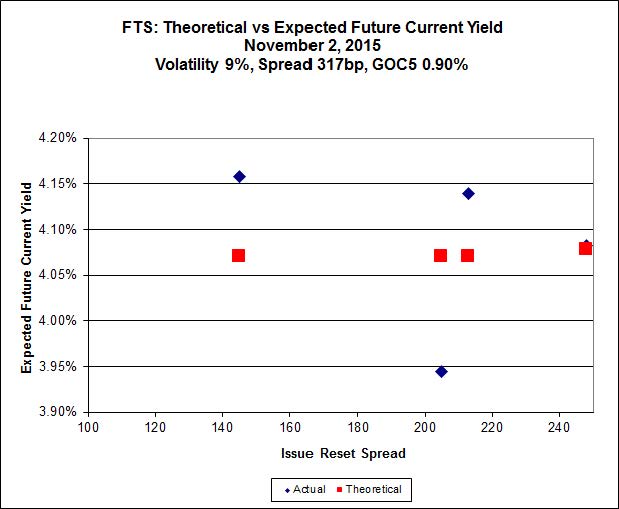
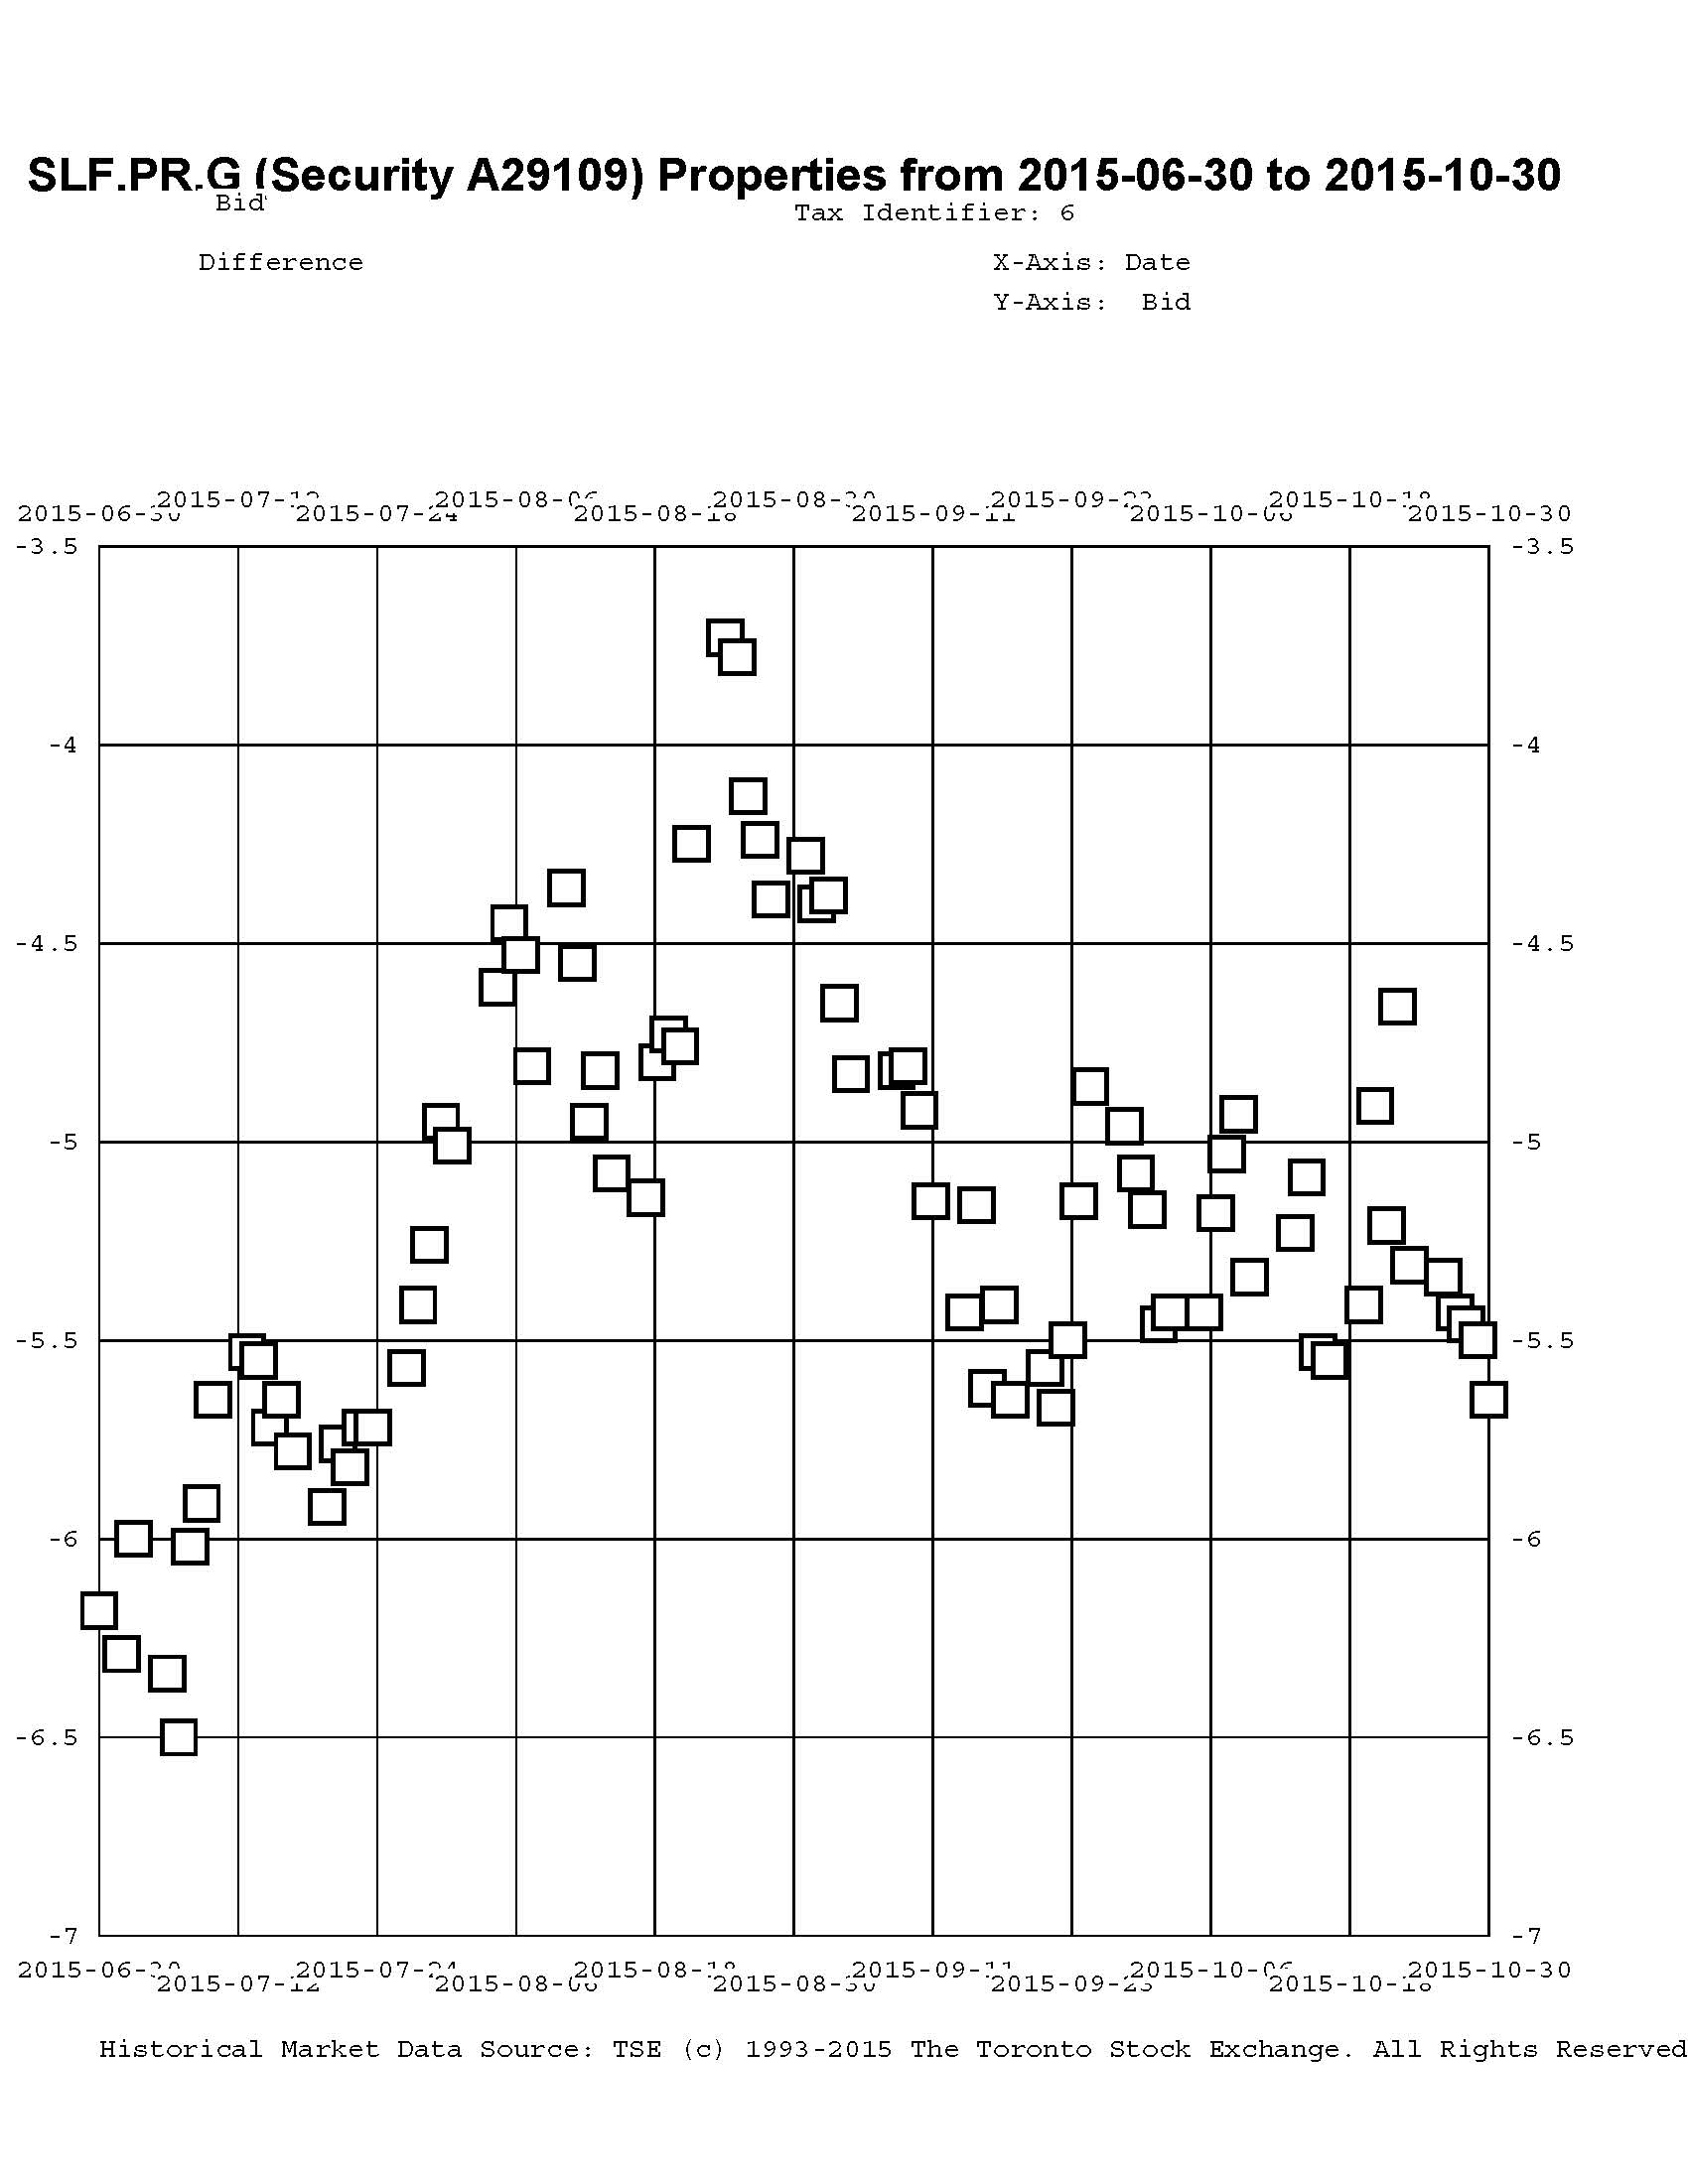
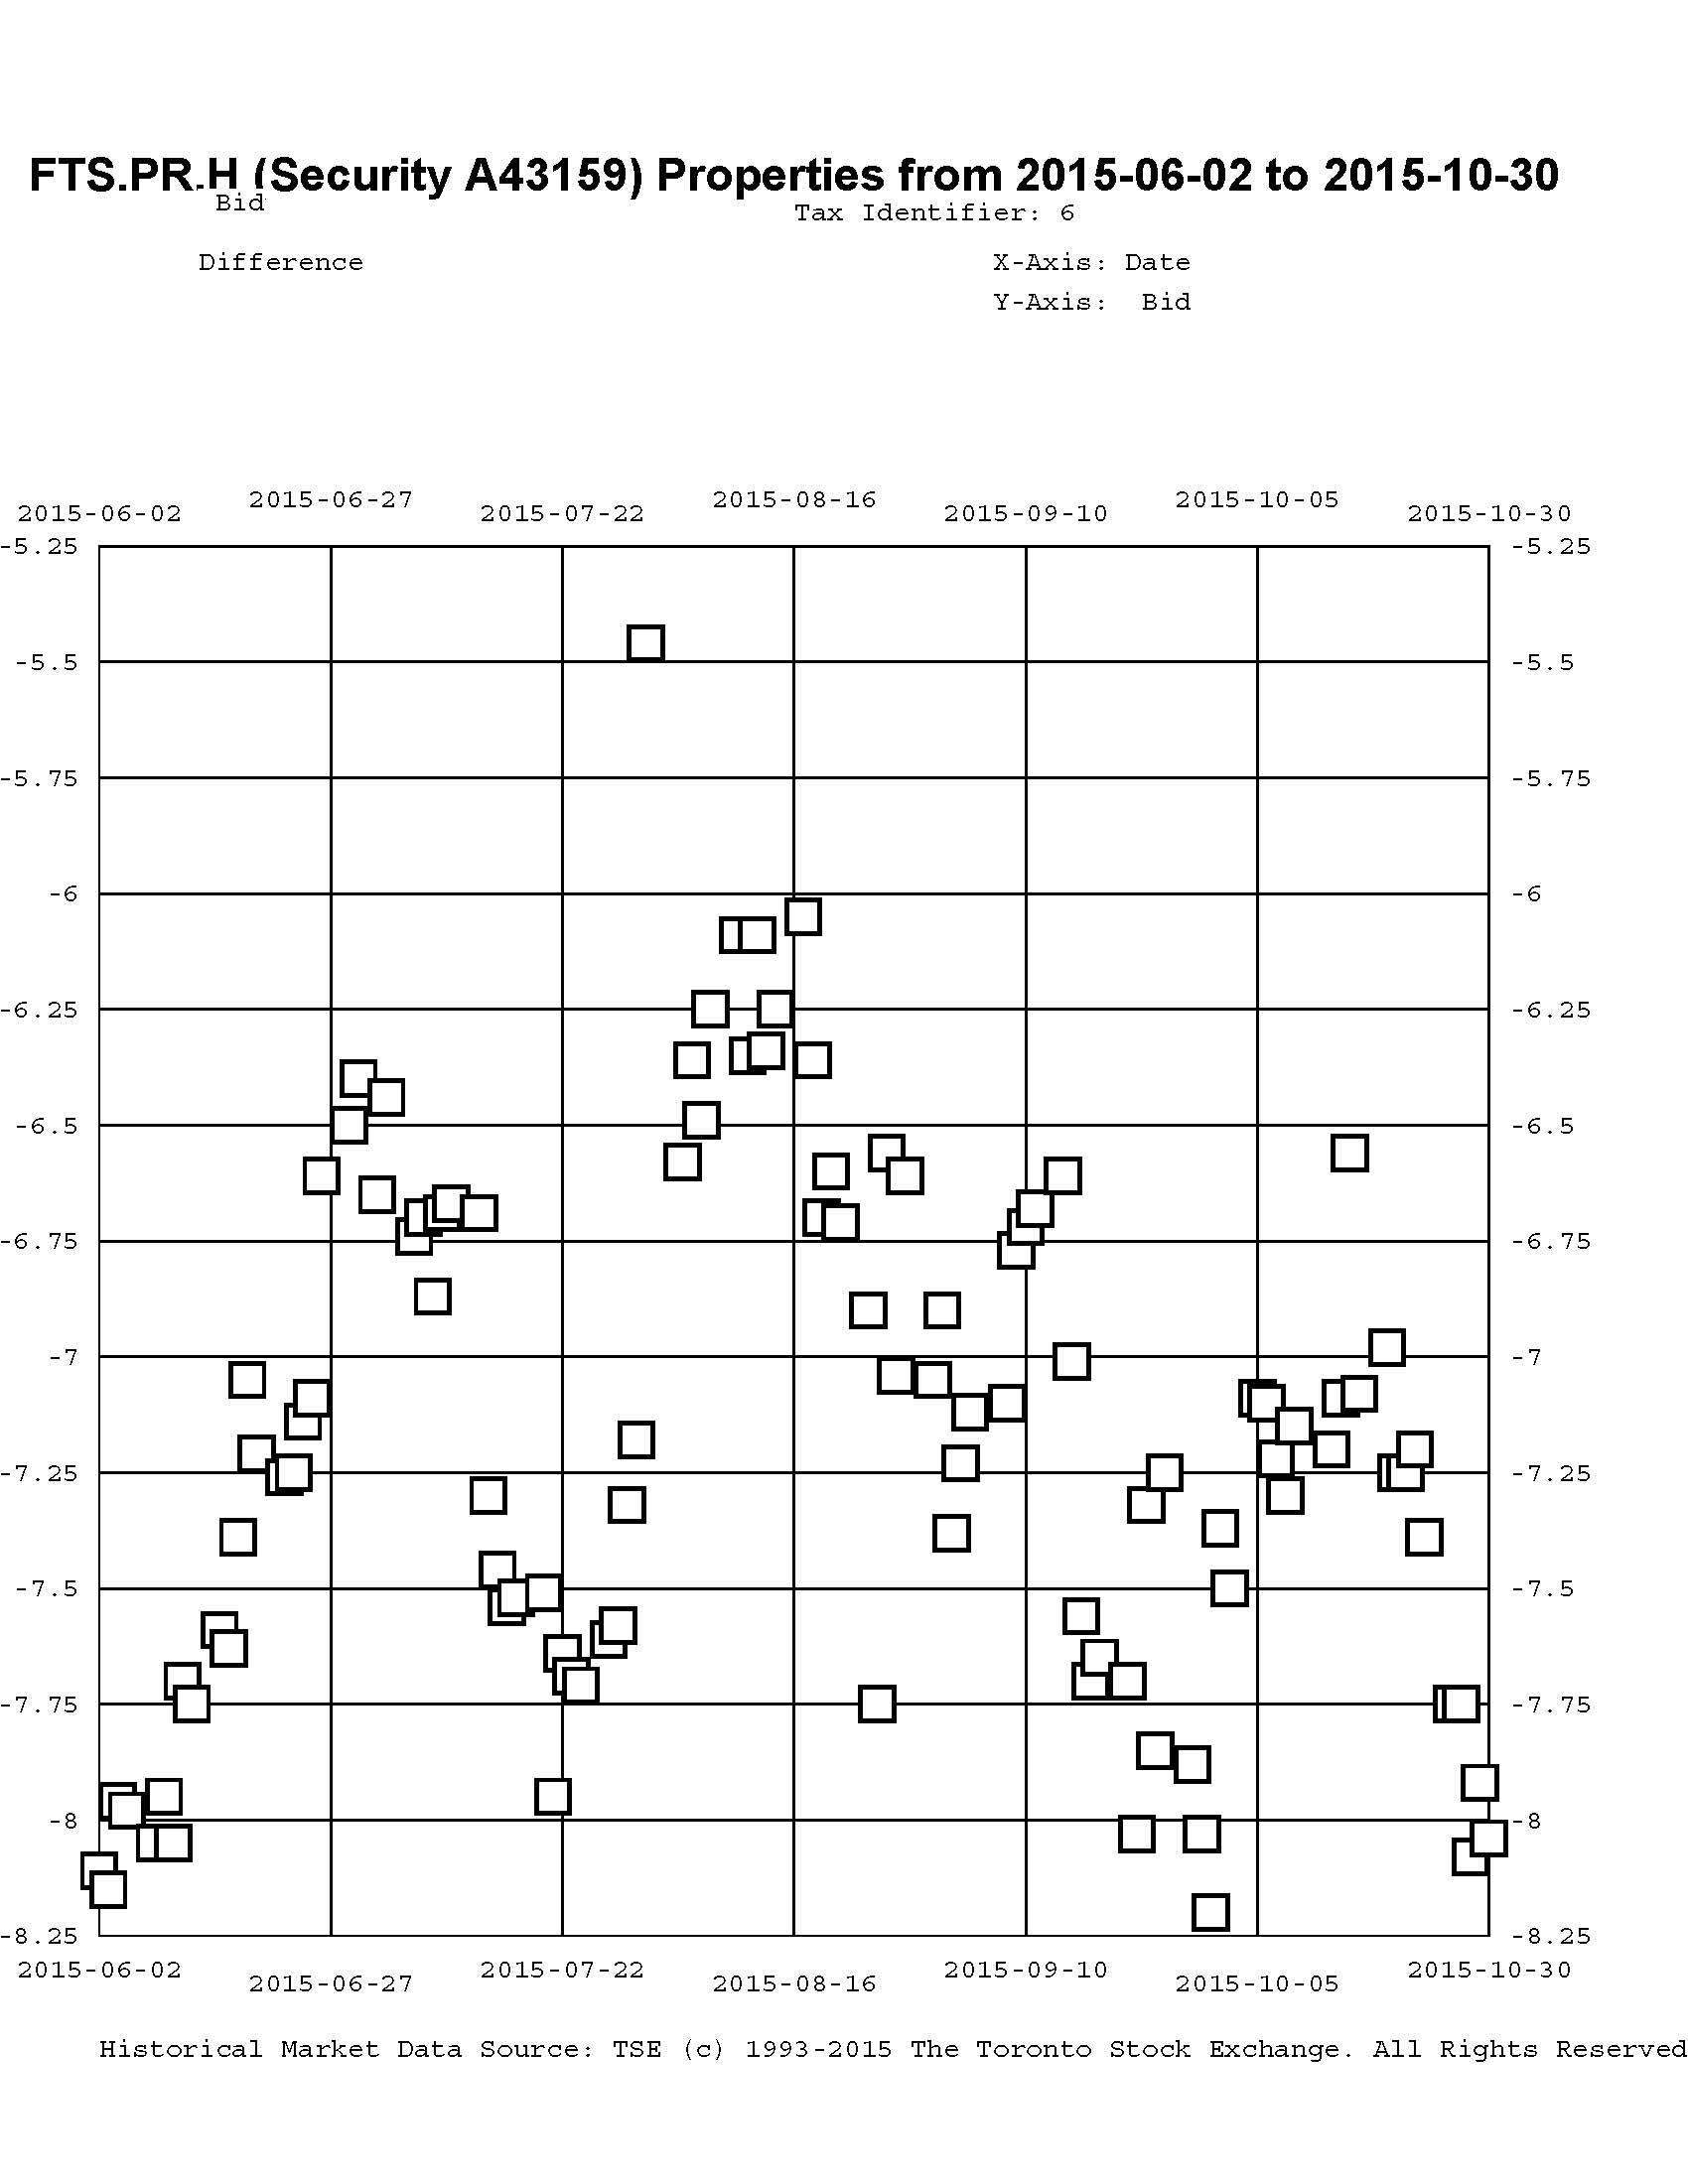
FTS.PR.K, with a spread of +205bp, and bid at 18.90, looks $0.73 expensive and resets 2019-3-1. FTS.PR.G, with a spread of +213bp and resetting 2018-9-1, is bid at 18.20 and is $0.46 cheap.

Click for Big
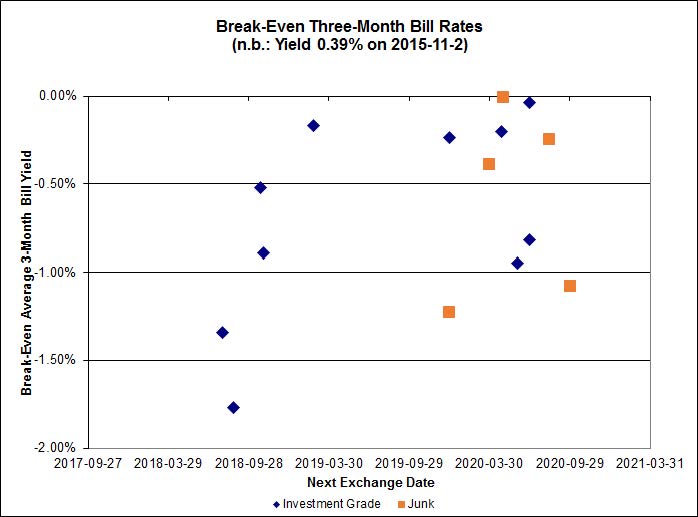
Investment-grade pairs predict an average three-month bill yield over the next five-odd years of -0.72%, with two outliers above 0.00% and none below -2.00%. The distribution is just barely bimodal, with bank NVCC non-compliant pairs averaging -0.53% and other issues averaging -0.71%; note that the relative values have reversed today! There are four junk outliers above 0.00% and one below -2.00%.

Click for Big
Shall we just say that this exhibits a high level of confidence in the continued rapacity of Canadian banks?
| HIMIPref™ Preferred Indices These values reflect the December 2008 revision of the HIMIPref™ Indices Values are provisional and are finalized monthly |
|||||||
| Index | Mean Current Yield (at bid) |
Median YTW |
Median Average Trading Value |
Median Mod Dur (YTW) |
Issues | Day’s Perf. | Index Value |
| Ratchet | 4.41 % | 5.30 % | 31,707 | 17.47 | 1 | 0.0000 % | 1,762.3 |
| FixedFloater | 6.42 % | 5.65 % | 31,046 | 16.75 | 1 | -1.3333 % | 3,040.3 |
| Floater | 4.20 % | 4.24 % | 62,324 | 16.91 | 3 | 0.3568 % | 1,880.2 |
| OpRet | 4.84 % | 4.33 % | 31,717 | 0.80 | 1 | 0.0000 % | 2,719.7 |
| SplitShare | 4.76 % | 5.87 % | 160,811 | 2.92 | 5 | 0.2302 % | 3,194.6 |
| Interest-Bearing | 0.00 % | 0.00 % | 0 | 0.00 | 0 | 0.2302 % | 2,492.6 |
| Perpetual-Premium | 5.83 % | 4.13 % | 81,629 | 0.08 | 6 | 0.1729 % | 2,491.0 |
| Perpetual-Discount | 5.56 % | 5.66 % | 82,551 | 14.40 | 33 | 0.2498 % | 2,573.5 |
| FixedReset | 4.97 % | 4.51 % | 215,789 | 15.48 | 76 | 0.1624 % | 2,058.2 |
| Deemed-Retractible | 5.19 % | 5.18 % | 110,591 | 5.44 | 34 | -0.0544 % | 2,574.6 |
| FloatingReset | 2.57 % | 3.72 % | 55,729 | 5.81 | 10 | 0.3601 % | 2,176.3 |
| Performance Highlights | |||
| Issue | Index | Change | Notes |
| PWF.PR.P | FixedReset | -2.62 % | YTW SCENARIO Maturity Type : Limit Maturity Maturity Date : 2045-11-03 Maturity Price : 13.75 Evaluated at bid price : 13.75 Bid-YTW : 4.57 % |
| BAM.PR.X | FixedReset | -2.34 % | YTW SCENARIO Maturity Type : Limit Maturity Maturity Date : 2045-11-03 Maturity Price : 15.05 Evaluated at bid price : 15.05 Bid-YTW : 4.83 % |
| SLF.PR.I | FixedReset | -1.99 % | YTW SCENARIO Maturity Type : Hard Maturity Maturity Date : 2025-01-31 Maturity Price : 25.00 Evaluated at bid price : 20.71 Bid-YTW : 6.30 % |
| MFC.PR.F | FixedReset | -1.71 % | YTW SCENARIO Maturity Type : Hard Maturity Maturity Date : 2025-01-31 Maturity Price : 25.00 Evaluated at bid price : 14.35 Bid-YTW : 9.61 % |
| MFC.PR.G | FixedReset | -1.61 % | YTW SCENARIO Maturity Type : Hard Maturity Maturity Date : 2025-01-31 Maturity Price : 25.00 Evaluated at bid price : 21.40 Bid-YTW : 6.04 % |
| GWO.PR.Q | Deemed-Retractible | -1.53 % | YTW SCENARIO Maturity Type : Hard Maturity Maturity Date : 2025-01-31 Maturity Price : 25.00 Evaluated at bid price : 23.16 Bid-YTW : 6.32 % |
| SLF.PR.J | FloatingReset | -1.47 % | YTW SCENARIO Maturity Type : Hard Maturity Maturity Date : 2025-01-31 Maturity Price : 25.00 Evaluated at bid price : 13.40 Bid-YTW : 9.49 % |
| SLF.PR.H | FixedReset | -1.40 % | YTW SCENARIO Maturity Type : Hard Maturity Maturity Date : 2025-01-31 Maturity Price : 25.00 Evaluated at bid price : 17.55 Bid-YTW : 7.83 % |
| IAG.PR.A | Deemed-Retractible | -1.39 % | YTW SCENARIO Maturity Type : Hard Maturity Maturity Date : 2025-01-31 Maturity Price : 25.00 Evaluated at bid price : 21.95 Bid-YTW : 6.47 % |
| BMO.PR.S | FixedReset | -1.34 % | YTW SCENARIO Maturity Type : Limit Maturity Maturity Date : 2045-11-03 Maturity Price : 19.10 Evaluated at bid price : 19.10 Bid-YTW : 4.42 % |
| BAM.PR.G | FixedFloater | -1.33 % | YTW SCENARIO Maturity Type : Limit Maturity Maturity Date : 2045-11-03 Maturity Price : 25.00 Evaluated at bid price : 14.80 Bid-YTW : 5.65 % |
| BMO.PR.T | FixedReset | -1.32 % | YTW SCENARIO Maturity Type : Limit Maturity Maturity Date : 2045-11-03 Maturity Price : 18.76 Evaluated at bid price : 18.76 Bid-YTW : 4.39 % |
| TD.PR.Y | FixedReset | -1.24 % | YTW SCENARIO Maturity Type : Hard Maturity Maturity Date : 2022-01-31 Maturity Price : 25.00 Evaluated at bid price : 23.90 Bid-YTW : 3.89 % |
| BAM.PR.B | Floater | -1.23 % | YTW SCENARIO Maturity Type : Limit Maturity Maturity Date : 2045-11-03 Maturity Price : 11.27 Evaluated at bid price : 11.27 Bid-YTW : 4.23 % |
| W.PR.J | Perpetual-Discount | -1.12 % | YTW SCENARIO Maturity Type : Limit Maturity Maturity Date : 2045-11-03 Maturity Price : 23.66 Evaluated at bid price : 23.93 Bid-YTW : 5.90 % |
| MFC.PR.J | FixedReset | -1.07 % | YTW SCENARIO Maturity Type : Hard Maturity Maturity Date : 2025-01-31 Maturity Price : 25.00 Evaluated at bid price : 20.28 Bid-YTW : 6.50 % |
| MFC.PR.H | FixedReset | -1.06 % | YTW SCENARIO Maturity Type : Hard Maturity Maturity Date : 2025-01-31 Maturity Price : 25.00 Evaluated at bid price : 22.32 Bid-YTW : 5.74 % |
| TD.PR.S | FixedReset | -1.03 % | YTW SCENARIO Maturity Type : Hard Maturity Maturity Date : 2022-01-31 Maturity Price : 25.00 Evaluated at bid price : 24.04 Bid-YTW : 3.61 % |
| SLF.PR.A | Deemed-Retractible | 1.01 % | YTW SCENARIO Maturity Type : Hard Maturity Maturity Date : 2025-01-31 Maturity Price : 25.00 Evaluated at bid price : 22.04 Bid-YTW : 6.58 % |
| FTS.PR.K | FixedReset | 1.07 % | YTW SCENARIO Maturity Type : Limit Maturity Maturity Date : 2045-11-03 Maturity Price : 18.90 Evaluated at bid price : 18.90 Bid-YTW : 4.22 % |
| BNS.PR.B | FloatingReset | 1.07 % | YTW SCENARIO Maturity Type : Hard Maturity Maturity Date : 2022-01-31 Maturity Price : 25.00 Evaluated at bid price : 22.62 Bid-YTW : 3.75 % |
| RY.PR.J | FixedReset | 1.16 % | YTW SCENARIO Maturity Type : Limit Maturity Maturity Date : 2045-11-03 Maturity Price : 20.95 Evaluated at bid price : 20.95 Bid-YTW : 4.34 % |
| BIP.PR.A | FixedReset | 1.18 % | YTW SCENARIO Maturity Type : Limit Maturity Maturity Date : 2045-11-03 Maturity Price : 21.50 Evaluated at bid price : 21.50 Bid-YTW : 5.26 % |
| CU.PR.I | FixedReset | 1.23 % | YTW SCENARIO Maturity Type : Call Maturity Date : 2020-12-01 Maturity Price : 25.00 Evaluated at bid price : 25.35 Bid-YTW : 4.14 % |
| TRP.PR.E | FixedReset | 1.38 % | YTW SCENARIO Maturity Type : Limit Maturity Maturity Date : 2045-11-03 Maturity Price : 19.16 Evaluated at bid price : 19.16 Bid-YTW : 4.54 % |
| MFC.PR.N | FixedReset | 1.40 % | YTW SCENARIO Maturity Type : Hard Maturity Maturity Date : 2025-01-31 Maturity Price : 25.00 Evaluated at bid price : 20.35 Bid-YTW : 6.30 % |
| BAM.PR.K | Floater | 1.54 % | YTW SCENARIO Maturity Type : Limit Maturity Maturity Date : 2045-11-03 Maturity Price : 11.23 Evaluated at bid price : 11.23 Bid-YTW : 4.25 % |
| TRP.PR.A | FixedReset | 1.61 % | YTW SCENARIO Maturity Type : Limit Maturity Maturity Date : 2045-11-03 Maturity Price : 15.75 Evaluated at bid price : 15.75 Bid-YTW : 4.70 % |
| VNR.PR.A | FixedReset | 1.63 % | YTW SCENARIO Maturity Type : Limit Maturity Maturity Date : 2045-11-03 Maturity Price : 20.60 Evaluated at bid price : 20.60 Bid-YTW : 4.62 % |
| HSE.PR.E | FixedReset | 1.72 % | YTW SCENARIO Maturity Type : Limit Maturity Maturity Date : 2045-11-03 Maturity Price : 21.99 Evaluated at bid price : 22.48 Bid-YTW : 5.01 % |
| BAM.PF.B | FixedReset | 1.80 % | YTW SCENARIO Maturity Type : Limit Maturity Maturity Date : 2045-11-03 Maturity Price : 19.20 Evaluated at bid price : 19.20 Bid-YTW : 4.83 % |
| TRP.PR.D | FixedReset | 1.82 % | YTW SCENARIO Maturity Type : Limit Maturity Maturity Date : 2045-11-03 Maturity Price : 19.00 Evaluated at bid price : 19.00 Bid-YTW : 4.52 % |
| RY.PR.M | FixedReset | 1.82 % | YTW SCENARIO Maturity Type : Limit Maturity Maturity Date : 2045-11-03 Maturity Price : 20.67 Evaluated at bid price : 20.67 Bid-YTW : 4.29 % |
| CU.PR.H | Perpetual-Discount | 1.96 % | YTW SCENARIO Maturity Type : Limit Maturity Maturity Date : 2045-11-03 Maturity Price : 23.52 Evaluated at bid price : 23.84 Bid-YTW : 5.50 % |
| MFC.PR.L | FixedReset | 2.16 % | YTW SCENARIO Maturity Type : Hard Maturity Maturity Date : 2025-01-31 Maturity Price : 25.00 Evaluated at bid price : 19.35 Bid-YTW : 6.88 % |
| BAM.PR.T | FixedReset | 2.23 % | YTW SCENARIO Maturity Type : Limit Maturity Maturity Date : 2045-11-03 Maturity Price : 17.40 Evaluated at bid price : 17.40 Bid-YTW : 4.84 % |
| BAM.PF.E | FixedReset | 5.84 % | YTW SCENARIO Maturity Type : Limit Maturity Maturity Date : 2045-11-03 Maturity Price : 20.65 Evaluated at bid price : 20.65 Bid-YTW : 4.51 % |
| Volume Highlights | |||
| Issue | Index | Shares Traded |
Notes |
| RY.PR.Z | FixedReset | 81,211 | Scotia crossed 25,000 at 19.63. YTW SCENARIO Maturity Type : Limit Maturity Maturity Date : 2045-11-03 Maturity Price : 19.69 Evaluated at bid price : 19.69 Bid-YTW : 4.16 % |
| RY.PR.J | FixedReset | 64,933 | TD crossed 33,500 at 20.95. YTW SCENARIO Maturity Type : Limit Maturity Maturity Date : 2045-11-03 Maturity Price : 20.95 Evaluated at bid price : 20.95 Bid-YTW : 4.34 % |
| BMO.PR.Y | FixedReset | 63,845 | TD crossed 35,000 at 21.70. YTW SCENARIO Maturity Type : Limit Maturity Maturity Date : 2045-11-03 Maturity Price : 21.50 Evaluated at bid price : 21.80 Bid-YTW : 4.18 % |
| TRP.PR.E | FixedReset | 60,840 | Desjardins crossed 50,000 at 19.20. YTW SCENARIO Maturity Type : Limit Maturity Maturity Date : 2045-11-03 Maturity Price : 19.16 Evaluated at bid price : 19.16 Bid-YTW : 4.54 % |
| BNS.PR.Z | FixedReset | 51,230 | TD crossed 39,400 at 20.40. YTW SCENARIO Maturity Type : Hard Maturity Maturity Date : 2022-01-31 Maturity Price : 25.00 Evaluated at bid price : 20.50 Bid-YTW : 5.86 % |
| RY.PR.H | FixedReset | 39,735 | YTW SCENARIO Maturity Type : Limit Maturity Maturity Date : 2045-11-03 Maturity Price : 19.32 Evaluated at bid price : 19.32 Bid-YTW : 4.28 % |
| There were 42 other index-included issues trading in excess of 10,000 shares. | |||
| Wide Spread Highlights | ||
| Issue | Index | Quote Data and Yield Notes |
| PWF.PR.T | FixedReset | Quote: 21.19 – 21.84 Spot Rate : 0.6500 Average : 0.4132 YTW SCENARIO |
| GWO.PR.Q | Deemed-Retractible | Quote: 23.16 – 23.83 Spot Rate : 0.6700 Average : 0.4602 YTW SCENARIO |
| MFC.PR.M | FixedReset | Quote: 20.13 – 20.98 Spot Rate : 0.8500 Average : 0.6448 YTW SCENARIO |
| CU.PR.D | Perpetual-Discount | Quote: 22.33 – 22.80 Spot Rate : 0.4700 Average : 0.2846 YTW SCENARIO |
| FTS.PR.F | Perpetual-Discount | Quote: 22.40 – 22.95 Spot Rate : 0.5500 Average : 0.3653 YTW SCENARIO |
| BMO.PR.Q | FixedReset | Quote: 20.55 – 20.90 Spot Rate : 0.3500 Average : 0.2240 YTW SCENARIO |