Archive for the ‘Regulatory Capital’ Category

RY Capitalization : 2Q08

Thursday, May 29th, 2008

RY has released its Second Quarter 2008 Report and Supplementary Package, so it’s time to recalculate how much room they have to issue new preferred shares – assuming they want to!

Step One is to analyze their Tier 1 Capital, reproducing the prior format:

RY Capital Structure
October, 2007
& April, 2008
  4Q07 2Q08
Total Tier 1 Capital 23,383 23,708
Common Shareholders’ Equity 95.2% 99.8%
Preferred Shares 10.0% 10.8%
Innovative Tier 1 Capital Instruments 14.9% 15.3%
Non-Controlling Interests in Subsidiaries 0.1% 0.1%
Goodwill -20.3% -26.0%

Next, the issuance capacity (from Part 3 of the introductory series):

RY
Tier 1 Issuance Capacity
October 2007
& April 2008
  4Q07 2Q08
Equity Capital (A) 17,545 17,527
Non-Equity Tier 1 Limit (B=A/3), 4Q07
(B=0.428*A), 2Q08
5,848 7,502
Innovative Tier 1 Capital (C) 3,494 3,626
Preferred Limit (D=B-C) 2,354 3,876
Preferred Actual (E) 2,344 2,555
New Issuance Capacity (F=D-E) 10 1,321
Items A, C & E are taken from the table
“Regulatory Capital”
of the supplementary information;
Note that Item A includes everything except preferred shares and innovative capital instruments


Item B is as per OSFI Guidelines; the limit was recently increased.
Items D & F are my calculations

and the all important Risk-Weighted Asset Ratios!

RY
Risk-Weighted Asset Ratios
October 2007
& April 2008
  Note 2007 2Q08
Equity Capital A 17,545 17,527
Risk-Weighted Assets B 247,635 249,242
Equity/RWA C=A/B 7.09% 7.03%
Tier 1 Ratio D 9.4% 9.5%
Capital Ratio E 11.5% 11.5%
Assets to Capital Multiple F 19.8x 20.1x
A is taken from the table “Issuance Capacity”, above
B, D, E & F are taken from RY’s Supplementary Report
C is my calculation.

I am pleased to see that RY has commenced disclosing their Assets-to-Capital multiple – the undisclosed-but-high figure for 1Q08 made me very curious! They note that “Effective Q2/08, the OSFI amended the treatment of the general allowance in the calculation of Basel II Asset-to-capital multiple. Comparative ratios have not been revised.”

This amendment is available in an Advisory dated April 2008 … which I will now have to puzzle over.

CM Capitalization : 2Q08

Thursday, May 29th, 2008

CIBC (Stock symbol CM … I can never quite decide how to present it!) has released its Second Quarter 2008 Report and Supplementary Package, so it’s time to recalculate how much room they have to issue new preferred shares – assuming they want to!

Step One is to analyze their Tier 1 Capital, reproducing the prior format:

CM Capital Structure
October, 2007
& April, 2008
  4Q07 2Q08
Total Tier 1 Capital 12,379 12,009
Common Shareholders’ Equity 90.1% 90.3%
Preferred Shares 23.7% 24.4%
Innovative Tier 1 Capital Instruments 0% 0%
Non-Controlling Interests in Subsidiaries 1.1% 1.2%
Goodwill -14.9% -16.0%

Next, the issuance capacity (from Part 3 of the introductory series):

CM
Tier 1 Issuance Capacity
October 2007
& April 2008
  4Q07 2Q08
Equity Capital (A) 9,448 9,078
Non-Equity Tier 1 Limit (B=A/3), 4Q07
(B=0.428*A), 2Q08
3,149 3,885
Innovative Tier 1 Capital (C) 0 0
Preferred Limit (D=B-C) 3,149 3,885
Preferred Actual (E) 2,931 2,931
New Issuance Capacity (F=D-E) 218 954
Items A, C & E are taken from the table
“Regulatory Capital”
of the supplementary information;
Note that Item A includes Goodwill, FX losses, non-controlling interest, Gains on sale of securitizations and 50/50 deductions


Item B is as per OSFI Guidelines; the limit was recently increased.
Items D & F are my calculations

and the all important Risk-Weighted Asset Ratios!

CM
Risk-Weighted Asset Ratios
October 2007
& April 2008
  Note 2007 2Q08
Equity Capital A 9,448 9,078
Risk-Weighted Assets B 127,424 114,767
Equity/RWA C=A/B 7.41% 7.91%
Tier 1 Ratio D 9.7% 10.5%
Capital Ratio E 13.9% 14.4%
Assets to Capital Multiple F 19.0x 19.3x
A is taken from the table “Issuance Capacity”, above
B, D & E are taken from CM’s Supplementary Report
C is my calculation.
F is from Page 26 of the quarterly report

TD Capitalization: 2Q08

Wednesday, May 28th, 2008

TD has released its Second Quarter 2008 Report and Supplementary Package, so it’s time to recalculate how much room they have to issue new preferred shares – assuming they want to!

Step One is to analyze their Tier 1 Capital, reproducing the prior format:

TD Capital Structure
October, 2007
& April, 2008
  4Q07 2Q08
Total Tier 1 Capital 15,645 16,646
Common Shareholders’ Equity 131.5% 169.6%
Preferred Shares 6.2% 10.1%
Innovative Tier 1 Capital Instruments 11.1% 10.4%
Non-Controlling Interests in Subsidiaries 0.1% 0.1%
Goodwill -49.0% -90.2%

Next, the issuance capacity (from Part 3 of the introductory series):

TD
Tier 1 Issuance Capacity
October 2007
& April 2008
  4Q07 2Q08
Equity Capital (A) 12,931 15,069
Non-Equity Tier 1 Limit (B=A/3), 4Q07
(B=0.428*A), 2Q08
4,310 6,450
Innovative Tier 1 Capital (C) 1,740 1,736
Preferred Limit (D=B-C) 2,570 4,714
Preferred Actual (E) 974 1,675
New Issuance Capacity (F=D-E) 1,346 3,039
Items A, C & E are taken from the table
“Regulatory Capital”
of the supplementary information;
Note that Item A includes Goodwill, FX losses, “Other Capital Deductions” and non-controlling interest


Item B is as per OSFI Guidelines; the limit was recently increased.
Items D & F are my calculations

and the all important Risk-Weighted Asset Ratios!

TD
Risk-Weighted Asset Ratios
October 2007
& April 2008
  Note 2007 2Q08
Equity Capital A 12,931 15,069
Risk-Weighted Assets B 152,519 178,635
Equity/RWA C=A/B 8.48% 8.43%
Tier 1 Ratio D 10.3% 9.1%
Capital Ratio E 13.0% 12.7%
Assets to Capital Multiple F 19.7x 19.2x
A is taken from the table “Issuance Capacity”, above
B, D & E are taken from TD’s Supplementary Report
C is my calculation.
F is from Note 9 of the quarterly report

The reported Assets-to-capital multiple reflects that goodwill is deducted from total capital (the denominator) AND FROM TOTAL ASSETS (the numerator); given TD’s huge goodwill, this makes rather a difference!

BNS Capitalization : 2Q08

Tuesday, May 27th, 2008

BNS has released its Second Quarter 2008 Report and Supplementary Package, so it’s time to recalculate how much room they have to issue new preferred shares – assuming they want to!

Step One is to analyze their Tier 1 Capital, reproducing the prior format:

BNS Capital Structure
October, 2007
& April, 2008
  4Q07 2Q08
Total Tier 1 Capital 20,225 21,073
Common Shareholders’ Equity 81.5% 83.9%
Preferred Shares 8.1% 10.5%
Innovative Tier 1 Capital Instruments 13.6% 13.0%
Non-Controlling Interests in Subsidiaries 2.5% 2.8%
Goodwill -5.6% -10.3%

Next, the issuance capacity (from Part 3 of the introductory series):

BNS
Tier 1 Issuance Capacity
October 2007
& April 2008
  4Q07 2Q08
Equity Capital (A) 15,840 16,113
Non-Equity Tier 1 Limit (B=A/3), 4Q07
(B=0.428*A), 2Q08
5,280 6,896
Innovative Tier 1 Capital (C) 2,750 2,750
Preferred Limit (D=B-C) 2,530 4,146
Preferred Actual (E) 1,635 2,210
New Issuance Capacity (F=D-E) 895 1,936
Items A, C & E are taken from the table
“Regulatory Capital”
of the supplementary information;
Note that Item A includes Goodwill, FX losses, “Other Capital Deductions” and non-controlling interest


Item B is as per OSFI Guidelines; the limit was recently increased.
Items D & F are my calculations

and the all important Risk-Weighted Asset Ratios!

BNS
Risk-Weighted Asset Ratios
October 2007
& April 2008
  Note 2007 2Q08
Equity Capital A 15,840 16,113
Risk-Weighted Assets B 218,300 218,900
Equity/RWA C=A/B 7.26% 7.36%
Tier 1 Ratio D 9.3% 9.6%
Capital Ratio E 10.5% 11.7%
Assets to Capital Multiple F 18.22x 17.68x
A is taken from the table “Issuance Capacity”, above
B, D & E are taken from BNS’s Supplementary Report
C is my calculation.
F is from OSFI (4Q07) and BNS’s Supplementary Report (2Q08) of total assets ($452.6-billion) divided by total capital ($25.588-billion)

BMO Capitalization : 2Q08

Tuesday, May 27th, 2008

BMO has released its Second Quarter 2008 Report and Supplementary Package, so it’s time to recalculate how much room they have to issue new preferred shares – assuming they want to, in this environment!

Step One is to analyze their Tier 1 Capital, reproducing the prior format:

BMO Capital Structure
October, 2007
& April, 2008
  4Q07 2Q08
Total Tier 1 Capital 16,994 17,633
Common Shareholders’ Equity 83.8% 84.3%
Preferred Shares 8.5% 9.6%
Innovative Tier 1 Capital Instruments 14.3% 13.8%
Non-Controlling Interests in Subsidiaries 0.2% 0.2%
Goodwill -6.7% -7.9%

Next, the issuance capacity (from Part 3 of the introductory series):

BMO
Tier 1 Issuance Capacity
October 2007
& April 2008
  4Q07 2Q08
Equity Capital (A) 13,126 13,499
Non-Equity Tier 1 Limit (B=A/3), 4Q07
(B=0.428*A), 2Q08
4,375 5,778
Innovative Tier 1 Capital (C) 2,422 2,438
Preferred Limit (D=B-C) 1,953 3,340
Preferred Actual (E) 1,446 1,696
New Issuance Capacity (F=D-E) 507 1,644
Items A, C & E are taken from the table
“Capital and Risk Weighted Assets”
of the supplementary information;
Note that Item A includes Goodwill and non-controlling interest


Item B is as per OSFI Guidelines; the limit was recently increased.
Items D & F are my calculations

and the all important Risk-Weighted Asset Ratios!

BMO
Risk-Weighted Asset Ratios
October 2007
& April 2008
  Note 2007 2Q08
Equity Capital A 13,126 13,499
Risk-Weighted Assets B 178,687 186,252
Equity/RWA C=A/B 7.35% 7.24%
Tier 1 Ratio D 9.51% 9.42%
Capital Ratio E 11.74% 11.64%
Assets to Capital Multiple F 17.17x 16.22x
A is taken from the table “Issuance Capacity”, above
B, D & E are taken from BMO’s Supplementary Report
C is my calculation.
F is from OSFI (4Q07) and BMO’s Supplementary Report (2Q08)

RY : Assets-to-Capital Multiple of 22.05 for 1Q08

Monday, May 26th, 2008

Assiduous Readers will recall the post on the Assets to Capital Multiple and my correspondence with Royal Bank’s Investor Relations department:

Well! This is interesting! According to these very, very rough calculations, RBC has an Assets-to-Capital multiple of 23.3:1, which is both over the limit and well above its competitors. This may be a transient thing … there was a jump in assets in the first quarter:

RBC: Change in Assets
From 4Q07 to 1Q08
Item Change ($-billion)
Securities +6
Repos +12
Loans +8
Derivatives +7
Total +33

I have sent the following message to RBC via their Investor Relations Page:

I would appreciate learning your Assets-to-Capital multiple (as defined by OSFI) as of the end of the first quarter, 2008, and any detail you can provide regarding its calculation.

I have derived a very rough estimate of 23.3:1, based on total assets of 632,761 and total regulatory capital of 27,113

Update, 2008-04-17: RBC has responded:

Thank you for your question about our assets to capital multiple (ACM). In keeping with prior quarter-end practice, we did not disclose our ACM in Q1/08 but were well within the OSFI minimum requirement. Our ACM is disclosed on a quarterly basis (with a 6-7 week lag) on OSFI’s website. We understand this should be available over the next few days. Below is an excerpt from the OSFI guidelines outlining the calculation of the ACM. We hope this helps.

The supplied excerpt from the guidelines was:

From OSFI Capital Adequacy Requirements (No. A-1)

1.2. The assets to capital multiple

Institutions are expected to meet an assets to capital multiple test. The assets to capital multiple is calculated by dividing the institution’s total assets, including specified off-balance sheet items, by the sum of its adjusted net tier 1 capital and adjusted tier 2 capital as defined in section 2.5 of this guideline. All items that are deducted from capital are excluded from total assets. Tier 3 capital is excluded from the test.

Off-balance sheet items for this test are direct credit substitutes1, including letters of credit and guarantees, transaction-related contingencies, trade-related contingencies and sale and repurchase agreements, as described in chapter 3. These are included at their notional principal amount. In the case of derivative contracts, where institutions have legally binding netting agreements (meeting the criteria established in chapter 3, Netting of Forwards, Swaps, Purchased Options and Other Similar Derivatives) the resulting on-balance sheet amounts can be netted for the purpose of calculating the assets to capital multiple.

Under this test, total assets should be no greater than 20 times capital, although this multiple can be exceeded with the Superintendent’s prior approval to an amount no greater than 23 times. Alternatively, the Superintendent may prescribe a lower multiple. In setting the assets to capital multiple for individual institutions, the Superintendent will consider such factors as operating and management experience, strength of parent, earnings, diversification of assets, type of assets and appetite for risk.

1. When an institution, acting as an agent in a securities lending transaction, provides a guarantee to its client, the guarantee does not have to be included as a direct credit substitute for the assets to capital multiple if the agent complies with the collateral requirements of Guideline B-4, Securities Lending.

I’ve been checking the OSFI disclosures page fairly regularly and today was rewarded with the actual data. As of 1Q08, Royal Bank had:

RY Capital Adequacy, 1Q08
Tier 1 Ratio 9.77%
Total Ratio 11.24%
Assets to Capital Multiple 22.05

Well! Here’s a howdy-do! I’ve been puzzling for some time as to how my approximate calculation could be so different from the sub-20 multiple that I assumed was actually reported! I’m glad to see that backs of envelopes still serve some purpose.

I have sent the following query to Royal’s Investor Relations department:

Sirs,

I am most interested to learn that your ACM was 22.05 as of 1Q08.

When did you seek approval from OSFI to exceed 20.0, and what was the rationale for exceeding the normal guideline?

Sincerely,

Incidentally … PrefBlog’s Scary Number Department recommends a glance at the “BCAR Derivative Components” figure. RY has nearly 3.4-trillion in interest-rate swaps outstanding and nearly 414-billion in credit swaps. The total notional for all derivatives is about 5.3-trillion.

Given that RY’s Total Capital Ratio (based on Risk Weighted Assets) is close to that of the other banks, the implication is that RY has greater total exposure with a small average risk weight. I’ll try to have a look at this shortly.

Update: I have also sent an inquiry to OSFI:

I was most interested to learn that Royal Bank had an Assets-to-Capital ratio of 22.05 as of the 1Q08 filing.

It is my understanding that the general maximum allowed by OSFI for this ratio is 20.0, which may be increased to 23.0 upon prior application to the Superintendant.

Is this correct? If so, then:

(a) When did Royal Bank apply to have the maximum increased?

(b) On what grounds did the Superintendant allow the increase?

(c) Were any terms, conditions, or time limits attached to the approval?

Sincerely,

Update, 2008-6-5: I have not received a response from RY Investor Relations. I have received a reply from OSFI:

Thank you for your e-mail of May 26, 2008, concerning the assets to capital ratio for banks.

You are correct that under the assets to capital test, total assets should be no greater than 20 times capital, although this multiple can be exceeded with the Superintendent’s prior approval to an amount no greater than 23 times. Further information on this ratio can be found in Section 1.2 of the Capital Adequacy Guideline (http://www.osfi-bsif.gc.ca/app/DocRepository/1/eng/guidelines/
capital/guidelines/CAR_A_e.pdf).

In response to the second part of your enquiry, you may wish to note that pursuant to section 22 of the Office of the Superintendent of Financial Institutions Act, any information that is obtained by the Superintendent regarding the business or affairs of a federally regulated financial institution (FRFI), or regarding persons dealing with the FRFI, or any person acting under the direction of the Superintendent, is to be treated as confidential and may not be disclosed to a third party.

Thank you for taking the time to write to this Office with your questions.
Common and Preferred Dividend Cuts: How Well Correlated?

Thursday, May 22nd, 2008

I was reminded of this topic recently … and reminded some time ago of the perception of relative risks when investing in preferred stock. A stockbroker type was explaining to me that he would never buy bank preferreds due to the risk of default … I pointed out that, while always possible, the banks would surely cut or eliminate their common dividend well in advance of their preferred dividend.

He was flabbergasted … “Do you really think they would cut their dividend? That would be terrible!”

In other words, he very calmly accepted the idea of a default on the perpetuals, but could not conceive of a situation in which a bank would cut its common dividend.

Recently, the poster-boy for credit excesses, Citigroup, cut its common dividend 41% while the preferred dividends just kept on chugging along – even increased in total, as they have raised a lot of capital via preferred offerings … presumably to investors who figured they wanted their interim dividends for the next five-years-odd to be preferred!

So anyway, I was thinking about this a little more and did a little digging … through the RBC Annual Report for 2007:

During 2007, we continued to return capital to our shareholders through dividend increases and share buybacks, delivering a total shareholder return of 16 per cent.

For several years, we have made it a management priority to ensure current success was reinvested to fund future growth. This approach allowed us to deliver relatively solid shareholder returns in 2007 while returning capital through increased dividends and share buybacks. We raised dividends twice in 2007 for a total increase of 26 per cent, and we repurchased 11.8 million common shares. Our capital position is strong with a Tier 1 capital ratio of 9.4 per cent, comfortably above our target of greater than 8 per cent.

Share Buybacks are analytically equivalent to dividends – and buyback-suspensions are the easiest way to halt a decline in capital ratios. But what sort of proportion do they make? I’ve had a preliminary look at this via RBC’s Annual Reports for 2001, 2004 and 2007:

RBC Data
Year Income Preferred
Dividends
Common
Dividends
Common
Buy-Backs
1999 1,725 157 588 333
2000 2,208 134 689 660
2001 2,435 135 897 509
2002 2,898 98 1,022 764
2003 3,036 68 1,137 852
2004 2,839 45 1,303 892
2005 3,387 42 1,512 226
2006 4,728 60 1,847 844
2007 5,492 88 2,321 646
Total 11,316 5,726

So, this is all pretty rough, it’s only one bank (a strong one!) and it’s taken over a period in which the bank examined hasn’t had anything particularly horrible happen to it. Still, it’s interesting to find that about 1/3 of the total capital returned to common shareholders has been in the form of buybacks rather than dividends … and, as the experience of 2005 shows, the buybacks can be cut quite easily.

Regulatory Capital Data from OSFI

Friday, April 18th, 2008

Assiduous Readers will remember that in the post Bank Regulation: The Assets to Capital Multiple, I performed some very rough calculations for Royal Bank and got a somewhat surprising result – a figure in excess of the OSFI standard limit.

These Assiduous Readers will also remember that I got put in my place pretty smartly by the Royal Bank Investor Relations Department:

Thank you for your question about our assets to capital multiple (ACM). In keeping with prior quarter-end practice, we did not disclose our ACM in Q1/08 but were well within the OSFI minimum requirement. Our ACM is disclosed on a quarterly basis (with a 6-7 week lag) on OSFI’s website. We understand this should be available over the next few days. Below is an excerpt from the OSFI guidelines outlining the calculation of the ACM. We hope this helps.

I hadn’t been aware that OSFI reported data … but they do! There is an excellent bank data resource page on the site that I found through the banks section of the sitemap.

According to OSFI, the assets-to-capital multiple for Royal Bank as of Q4-2007 was 19.94. It’s a good thing nobody sneezed at the time, or they would have been over-limit! I am all agog for the Q1-2008 data to be published so I can determine what Royal Bank’s standards for “well within the OSFI minimum requirement” mean. In the meantime, I have added a link to the reporting page to the blogroll, under the heading “Online Resources”.

Bank Regulation: The Assets to Capital Multiple

Tuesday, April 15th, 2008

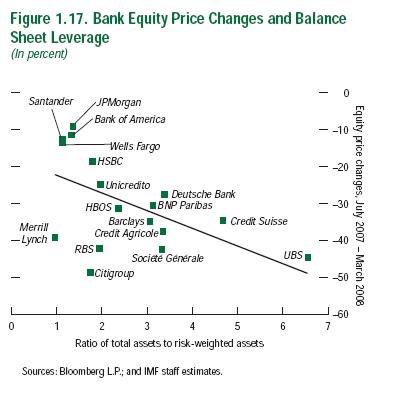
I have been fascinated with the IMF Global Financial Stability Report that was recently reviewed on PrefBlog … particularly Figure 1.17:

imf_117.jpg

The IMF comments:

Some banks have rapidly expanded their balance sheets in recent years, largely by increasing their holdings of highly rated securities that carry low risk weightings for regulatory capital purposes (see Box 1.3 on page 31). Part of the increase in assets reflects banks’ trading and investment activities. Investments grew as a share of total assets, and wholesale markets, including securitizations used to finance such assets, grew as a share of total funding (Figure 1.16). Banks that adopted this strategy aggressively became more vulnerable to illiquidity in the wholesale money markets, earnings volatility from marked-to-market assets, and illiquidity in structured finance markets. Equity markets appear to be penalizing those banks that adopted this strategy most aggressively (Figure 1.17).

The variation in multiple for the banks listed is ENORMOUS. The new derisive nickname for UBS is Union Bank of Singapore … but what are the implications for Canadian banks?

First, let’s gather up the ratios for these banks:

Assets to Risk-Weighted-Assets Ratios for Canadian Banks
  RBC BNS TD BMO CIBC
Risk-Weighted Assets 241,206 234,900 163,230 179,487 128,267
Total Assets 632,761 449,422 435,200 376,825 347,734
Assets:RWA 2.6 1.9 2.7 2.1 2.7

All the numbers are within the range for most banks – as reported by the IMF – but there are some fascinating differences that I might write about at another time.

Clearly, however, these differences can be significant and there is a clear indication that UBS was “gaming the system” by loading up with AAA assets that had no risk weight but – regardless of their investment merit – had, shall we say, considerable mark-to-market risk.

OSFI attempts to control such gaming by the imposition of an Assets-to-Capital multiple:

Institutions are expected to meet an assets to capital multiple test on a continuous basis. The assets to capital multiple is calculated by dividing the institution’s total assets, including specified off-balance sheet items, by the sum of its adjusted net tier 1 capital and adjusted tier 2 capital as defined in section 2.5 of this guideline. All items that are deducted from capital are excluded from total assets. Tier 3 capital is excluded from the test.

Off-balance sheet items for this test are direct credit substitutes1, including letters of credit and guarantees, transaction-related contingencies, trade-related contingencies and sale and repurchase agreements, as described in chapter 3. These are included at their notional principal amount. In the case of derivative contracts, where institutions have legally binding netting agreements (meeting the criteria established in chapter 3, Netting of Forwards, Swaps, Purchased Options and Other Similar Derivatives) the resulting on-balance sheet amounts can be netted for the purpose of calculating the assets to capital multiple.

Under this test, total assets should be no greater than 20 times capital, although this multiple can be exceeded with the Superintendent’s prior approval to an amount no greater than 23 times. Alternatively, the Superintendent may prescribe a lower multiple. In setting the assets to capital multiple for individual institutions, the Superintendent will consider such factors as operating and management experience, strength of parent, earnings, diversification of assets, type of assets and appetite for risk.

BMO is to be commended for disclosing its Asset-to-Capital multiple of 18.39, but I don’t see this number disclosed for any of the others. So … it will have to be done roughly, using the total assets from the table above, over the total regulatory capital:

Assets to Risk-Weighted-Assets Ratios for Canadian Banks
  RBC BNS TD BMO CIBC
Total Assets 632,761 449,422 435,200 376,825 347,734
Total Regulatory Capital
Tier 1 + Tier 2
27,113 23,874 23,117 20,203 18,713
Very Rough
Assets-to-Capital
Multiple
(internal check)
23.3
(23.3)
18.8
(18.6)
18.8
(19.0)
18.7
(18.6)
18.6
(18.5)
Reported
Total Capital
Ratio
11.2% 10.2% 14.2% 11.3% 14.6%
The internal check on the Assets-to-Capital multiple is the Assets-to-RWA multiple divided by the Total Capital Ratio. Variance will be due to rounding.

Well! This is interesting! According to these very, very rough calculations, RBC has an Assets-to-Capital multiple of 23.3:1, which is both over the limit and well above its competitors. This may be a transient thing … there was a jump in assets in the first quarter:

RBC: Change in Assets
From 4Q07 to 1Q08
Item Change ($-billion)
Securities +6
Repos +12
Loans +8
Derivatives +7
Total +33

I have sent the following message to RBC via their Investor Relations Page:

I would appreciate learning your Assets-to-Capital multiple (as defined by OSFI) as of the end of the first quarter, 2008, and any detail you can provide regarding its calculation.

I have derived a very rough estimate of 23.3:1, based on total assets of 632,761 and total regulatory capital of 27,113

Update, 2008-04-17: RBC has responded:

Thank you for your question about our assets to capital multiple (ACM). In keeping with prior quarter-end practice, we did not disclose our ACM in Q1/08 but were well within the OSFI minimum requirement. Our ACM is disclosed on a quarterly basis (with a 6-7 week lag) on OSFI’s website. We understand this should be available over the next few days. Below is an excerpt from the OSFI guidelines outlining the calculation of the ACM. We hope this helps.

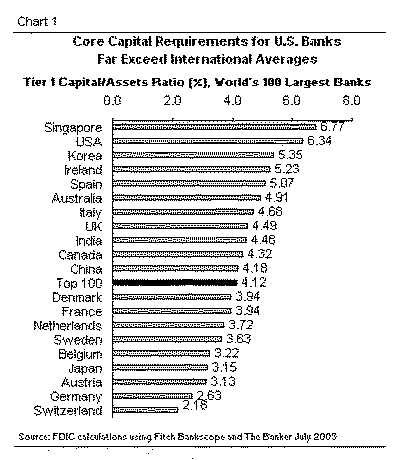
Update, 2008-6-4: From the FDIC publication, Estimating the Capital Impact of Basel II in the United States:

Cracks Appear in European Bank Sub-Debt Market

Thursday, April 10th, 2008

Fascinating.

I’ve never been a fan of Banks’ subordinated debt, on the grounds that, while you get paid for term of T, you are taking the risk of a term of T+5 … and the penalty rate of interest that normally gets paid on the last five years means that the only time you will actually have exposure to the T+5 paper is when the issuing bank is under stress, and you’d really, really, not have this exposure. Or, at least, not at your going-in, term T price. Note that Sub-Debt comes in two levels; the ultra-cool European “LT2” means the same thing as the coldly-technical North American “Tier 2B”.

An Italian bank has just allowed its sub-debt to go to T+5:

The market is at risk because one borrower has broken ranks. Credito Valtellinese Scrl ignored the April 30 call date on its 150 million euros ($236 million) of notes. As a result, the bank will pay a penalty interest rate of 160 basis points more than money-market rates — higher than the 100-basis-point premium it paid for the past five years, though still lower than it would probably pay to refinance.

There’s another twist to the tale. Because exercising the call option messes with a bank’s capital structure, the repayment has to be sanctioned by regulators. Banca Antonveneta SpA, an Italian lender bought by Banca Monte dei Paschi di Siena SpA last year, has asked the Bank of Italy to agree to its repaying 450 million euros of notes at the April 23 call date.

The authorities, though, may be reluctant to allow firms to weaken their finances in the current environment. Credito Valtellinese’s heresy may swiftly become commonplace.

TD Bank has a good on-line summary of their sub-debt [although some of it is actually Innovative Tier 1 Capital]. Most of their issues carry a penalty rate of BAs+100, although their most recent issue has the T to T+5 portion at BAs+200.

CIBC’s penalty rate is BAs+100.

Scotia’s penalty rate is BAs+100.

RBC’s penalty rate is BAs+100

BMO does not provide a convenient listing … an issue from last year has a penalty rate of BAs+100, while one from last month is CDOR+250

National’s penalty rate is BAs+100

Who knows? We might be in for some interesting times!