The big news of the day was the FOMC statement:
Information received since the Federal Open Market Committee met in April suggests that economic activity has been expanding moderately after having changed little during the first quarter. The pace of job gains picked up while the unemployment rate remained steady. On balance, a range of labor market indicators suggests that underutilization of labor resources diminished somewhat. Growth in household spending has been moderate and the housing sector has shown some improvement; however, business fixed investment and net exports stayed soft. Inflation continued to run below the Committee’s longer-run objective, partly reflecting earlier declines in energy prices and decreasing prices of non-energy imports; energy prices appear to have stabilized. Market-based measures of inflation compensation remain low; survey-based measures of longer-term inflation expectations have remained stable.
…
To support continued progress toward maximum employment and price stability, the Committee today reaffirmed its view that the current 0 to 1/4 percent target range for the federal funds rate remains appropriate. In determining how long to maintain this target range, the Committee will assess progress–both realized and expected–toward its objectives of maximum employment and 2 percent inflation. This assessment will take into account a wide range of information, including measures of labor market conditions, indicators of inflation pressures and inflation expectations, and readings on financial and international developments. The Committee anticipates that it will be appropriate to raise the target range for the federal funds rate when it has seen further improvement in the labor market and is reasonably confident that inflation will move back to its 2 percent objective over the medium term.
There were no dissents. Other information released indicates that the committee is dovish:
For Federal Reserve officials, the U.S. economy is a glass house where aggressive moves could break something.
While the median forecast of policy makers still calls for two interest-rate increases by year-end, more officials say just one would be enough in 2015. Still more advocate a go-slow approach to further tightening in 2016.
Projections from the Federal Open Market Committee published Wednesday showed that five officials foresee one increase in the federal funds rate this year, up from just a single policy maker who said so in March. And while policy makers said the economy has picked up after a first-quarter slump, Fed Chair Janet Yellen said she still wants to see more “decisive” evidence of a lasting turnaround.
…
At her press conference following the FOMC meeting, Yellen cited signs of “cyclical weakness” in the labor market, and noted wage growth remains “subdued.”“Although progress clearly has been achieved, room for further improvement remains,” Yellen said. “Economic conditions are currently anticipated to evolve in a manner that will warrant only gradual increases in the target federal funds rate.”
Treasuries climbed and the dollar weakened against the euro after the Federal Reserve revised down its outlook for interest rates amid fragile economic conditions.
…
Yields on 10-year U.S. notes fell four basis points to 2.28 percent by 11:05 a.m. in Tokyo, with rates on Japanese and Australian debt also down. The greenback weakened to $1.1362 per euro and slipped 0.2 percent versus the yen.
Back in April, Natixis Global Asset Management (parent of NexGen Financial) released the results of a poll of Canadian investors:
The majority of those surveyed (54%) say they fear future oil price drops, 61 percent admit they are not willing to take more investment risk compared to a year ago and 59 percent said they feel vulnerable when it comes to protecting their portfolios from market shocks.
…
Besides oil prices, investors’ other concerns include a worldwide economic slowdown (cited by 54%), slower global growth (39%) and higher interest rates (37%).Despite the economic challenges, 88 percent of Canadian investors believe their current approach will enable them to have a steady income when they retire. To get there, investors say their portfolio needs to gain an average of 9.3 percent annually, over and above inflation, the survey found. Eighty percent of investors think their target is realistic.
…
Retirement remains the top financial priority, and most investors (57%) say the responsibility of funding retirement is falling increasingly to individuals and away from government- and employer-sponsored schemes.They anticipate 50 percent of their retirement income will come from their own efforts – saving, investing, selling their home or business or picking up a job after retiring. Of the rest of their retirement income, 26 percent would come from an employer pension, 18 percent from government support and 6 percent from other sources (including support from children).
…
Natixis surveyed 250 individual investors across Canada with a minimum of C$256,460 (US$205,230) in investable assets. The online survey was conducted in February 2015 and is part of a larger global study of 7,000 investors in 17 countries from Europe, the Americas and the Middle East. The findings are published in a new whitepaper, “Close enough isn’t good enough.” For more information, visit durableportfolios.com.
9.3% annual returns, over and above inflation? Good luck with that!
The global summary has an amusing section on retirement expectations:
When asked at what age they would like to retire, younger investors are clearly focused on early retirement: Millennials say age 58, while Generation X say 62. When asked when they think they will actually retire, their aspirations moderate only slightly at age 60 and age 63 respectively.
Asked the same questions, Baby Boomers say age 68 on both counts. Pre-Boomers respond with 73 on both counts. In reality, for members of those generations who are already retired, the day came much earlier at age 59 and 63 respectively.
… but respondents have a Plan B:
Should they fall short on their retirement savings, investors have clear plans on how they will make up the difference. The largest number (45%) say employment will be the answer, followed by support from their spouse or significant other (36%), government programs (35%), and family (23%).
And finally, there’s a little section on the value of advice:

Click for Big
Now, this study is hardly up to academic standards – it’s in Natixis’ best interests to convince everybody (particularly those with over $200,000 in investible assets) that they need an advisor and they need alternative investments. But I suspect that meticulously unbiased research would give similar results.
And it is, perhaps, these unrealistic expectations and the expectation of government support that is driving the trend towards enhanced public pension plans, both in Ontario (as discussed May 1, 2014; also see the official ORPP website) and in the States:
The U.S. retirement system is a failure, in at least one respect: Half of private-sector workers have no access to a 401(k) or a pension plan on the job, so millions of Americans have scant retirement savings or none at all. To retire, they’ll need to rely on programs such as Social Security and Medicaid.
The federal government has done little to get more Americans saving for retirement. In December the White House launched a pilot program called myRA (My Retirement Account), an individual retirement account (or IRA) set up through an employer’s payroll system and aimed at low-income workers. But participation is voluntary, and Congress has gotten nowhere with bills proposed to encourage workplace retirement plans.
So the states are stepping up. This month, an Illinois law went into effect that would give a state-run IRA to all employees of companies with at least 25 people on staff who don’t have their own retirement plan. Workers would automatically be signed up to contribute 3 percent of their salary to the IRA and could opt out or adjust their contribution. The system is scheduled to be up and running by June 2017.
California is working on a similar plan, and on Tuesday the Oregon State Senate sent the governor a bill requiring automatic IRAs at private employers by July 2017. By early next year, Connecticut officials must finish a study, mandated by the state legislature, of how feasible a state-run retirement plan would be there. There are advocates for similar plans in at least a dozen other state legislatures.
Separately, we are told that employees are idiots:
Canadians are missing out on billions of dollars of potential retirement savings every year by not taking full advantage of matching contributions by their employers in group RRSP and defined contribution retirement plans.
Tom Reid of Sun Life Financial estimates more than $3-billion a year of potential company contributions go unmade because employees don’t make the required matching contributions to obtain them.
…
A survey by Great-West Life found significant numbers of respondents weren’t taking advantage of voluntary plans. It found a 79 per cent participation rate for voluntary DC plans and just 51 per cent for voluntary group RRSPs in 2014.
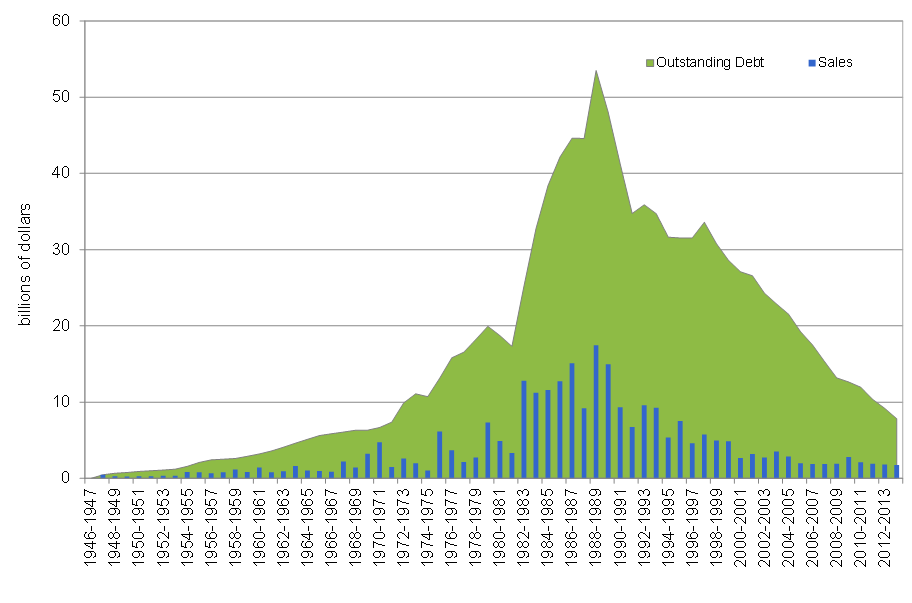
Meanwhile there is a call to eliminate Canada Savings Bonds:
The private sector already offers various savings products, backed by deposit insurance, according to a report prepared by KPMG LLP for the Canadian Finance Department. Canadian households appear to like those options better, as the stock of retail debt outstanding in the Canada Savings Bond program plummeted to just under 8 billion Canadian dollars ($6.5 billion) in 2013 from a 1987 level of C$55 billion. That’s an average decline of C$1.8 billion a year.
…
“There is currently no valid economic rationale for the retail debt program,” KPMG said. “Outstanding stock is expected to reach a level where, despite all the recent accomplishments in cost reduction, it will be difficult to justify the existence of the program either on economic grounds, on participation levels, or as a share of retail debt outstanding to market debt.”A spokeswoman for Canada’s Finance Department said the Canada Savings Bonds Program would be maintained in its current format, while officials would look at potential ways to reduce the scheme’s costs. The spokeswoman said more than a million Canadians still purchase securities from the program, “demonstrating their continuing interest” in the program.
The U.S. and Germany have essentially terminated their retail debt programs, which like the Canadian one were created to provide citizens with a guaranteed savings instrument in an era when the retail banking sector was underdeveloped, and there was no such mechanism as deposit insurance. In Germany’s case, it concluded it could no longer issue a cost-effective rate that would attract retail investor interest.
I love the official response. It must be nice to be in government and never have to show any intellectual integrity at all!
The actual report includes a fascinating graph:
Click for Big
In terms of spread:
We notice that the CPB rate is tracking closely the 3-year benchmark Government of Canada bond since 2008 with a spread ranging between minus 20 to plus 60 basis points (bps) leaving little or no margin to offset unit administration and option costs (see Chart 6). Likewise, the CSB rate, even with spreads ranging from 10 to 70 bps compared to the 1 year treasury bill rate since 2009 does not leave enough margin to cover unit administration and option costs.
In terms of cost:
Today, the operating costs of the Retail Debt Program at $58 million are equivalent to the yearly interest costs (approx. $58 million) on the outstanding stock of retail debt (see Chart 7). Of course this relation may change in the future, based on the evolution of interest rates and changes in the cost structure. It is nevertheless an interesting snapshot putting the overall costs of the Retail Debt Program in perspective.
The largest component of the operating costs for the Retail Debt Program is the HP back-office operations which stand at $36 million or 62% of the expenses.
Given all the recent fuss, one wonders whether some aspects of the programme will be changed …
Introduced in 1997 by Canada Investment and Savings Agency (CI&S), trailer fees were discontinued in the fall of 2010 and replaced by an up-front 35 bps commission. This proved a significant cost reduction measure. Beforehand, financial institutions benefitted from annual trailer fees of 23 bps until maturity. In 2009 trailer fees accounted for 93% of total commissions to financial institutions.
Based on the pre-2000 issues still outstanding and on the estimated pace of redemptions, trailer fees are expected to end in 2019-2020. We estimate that in 2012-2013 they still represent approximately 92% of the commission expense as this would be consistent with $3.5 billion of outstanding debt still being subject to the 23 bps trailer fee (see Table 4).
KPMG makes one recommendation I really like … but it comes with a warning label!
Consider making the Retail Debt Program totally internet-based, with no intermediaries: This is the current US model, and the phase-in would likely be very expensive. With respect to the US example, it should be noted that the infrastructure they built behind their Treasury Direct website is mostly used for individuals purchasing retail sizes of wholesale US Treasury securities.
It’s surprisingly difficult to find information on the size of the Treasury Direct retail programme; if anybody knows where I can get this information, let me know!
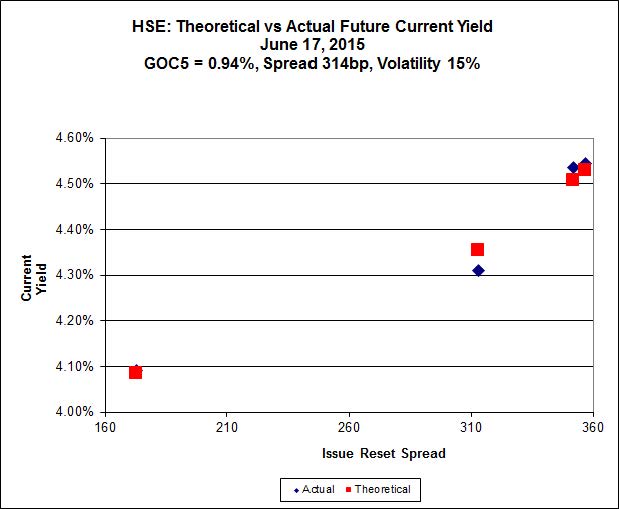
It was a mixed day for the Canadian preferred share market, with PerpetualDiscounts down 21bp, FixedResets off 8bp and DeemedRetractibles gaining 6bp. FixedResets continue to dominate the Performance Highlights table at both ends. Volume was average.
For as long as the FixedReset market is so violently unsettled, I’ll keep publishing updates of the more interesting and meaningful series of FixedResets’ Implied Volatilities. This doesn’t include Enbridge because although Enbridge has a large number of issues outstanding, all of which are quite liquid, the range of Issue Reset Spreads is too small for decent conclusions. The low is 212bp (ENB.PR.H; second-lowest is ENB.PR.D at 237bp) and the high is a mere 268 for ENB.PF.G.
Remember that all rich /cheap assessments are:
» based on Implied Volatility Theory only
» are relative only to other FixedResets from the same issuer
» assume constant GOC-5 yield
» assume constant Implied Volatility
» assume constant spread
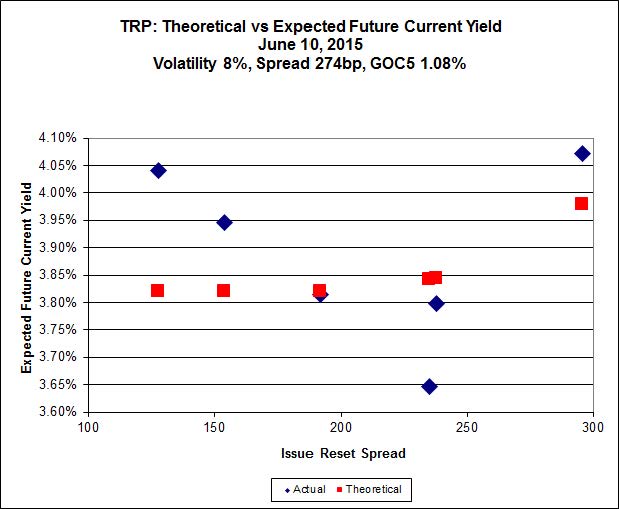
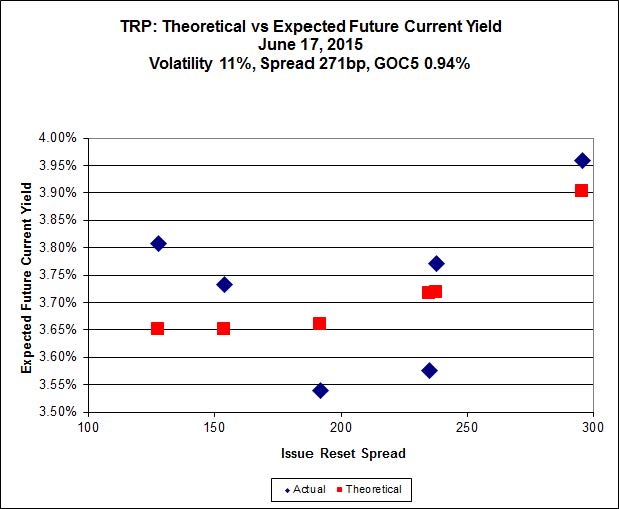
Here’s TRP:
Click for Big
TRP.PR.E, which resets 2019-10-30 at +235, is bid at 23.00 to be $0.87 rich, while TRP.PR.B, which will reset June 30 at 2.152% (+128), is $0.63 cheap at its bid price of 14.58
Click for Big
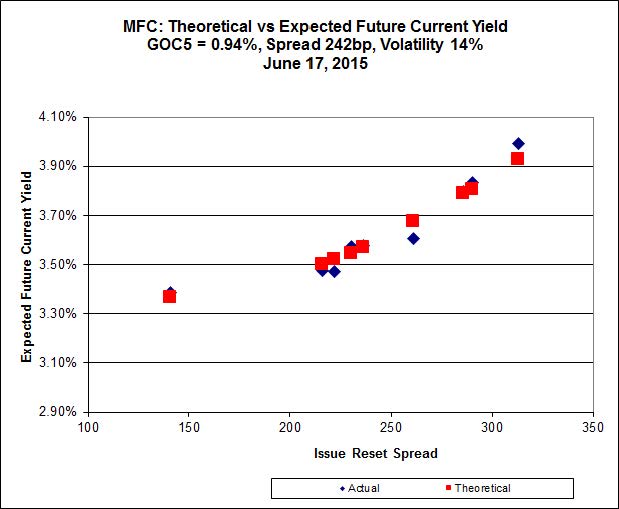
Another excellent fit, but the numbers are perplexing. Implied Volatility for MFC continues to be a conundrum. It is still too high if we consider that NVCC rules will never apply to these issues; it is still too low if we consider them to be NVCC non-compliant issues (and therefore with Deemed Maturities in the call schedule).
Most expensive is MFC.PR.J, resetting at +261bp on 2018-3-19, bid at 24.60 to be $0.44 rich, while MFC.PR.H, resetting at +313bp on 2017-3-19, is bid at 25.50 to be $0.41 cheap.
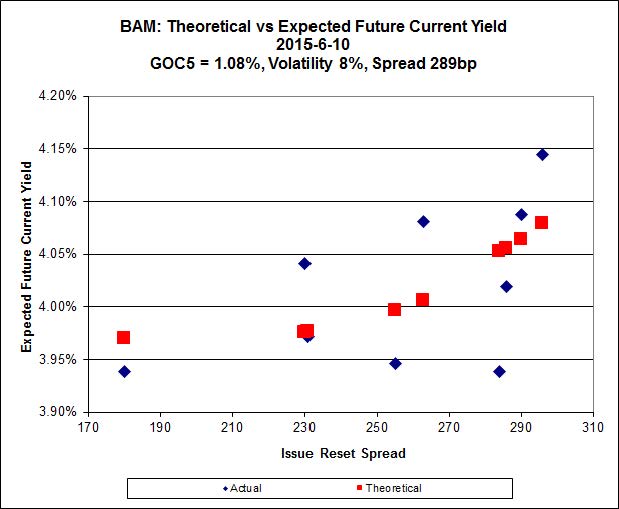
Click for Big
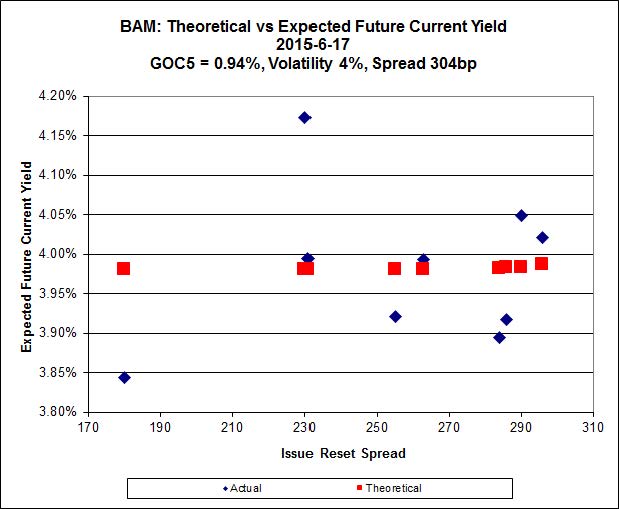
The cheapest issue relative to its peers is BAM.PR.R, resetting at +230bp on 2016-6-30, bid at 19.41 to be $0.94 cheap. BAM.PR.X, resetting at +180bp 2017-6-30 is bid at 17.82 and appears to be $0.61 rich.
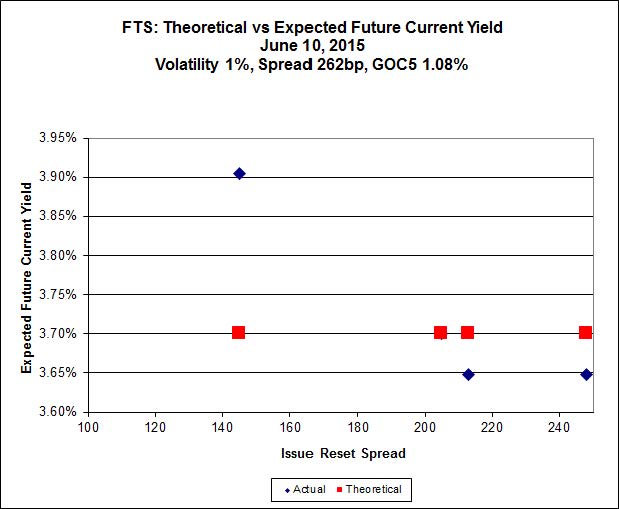
Click for Big
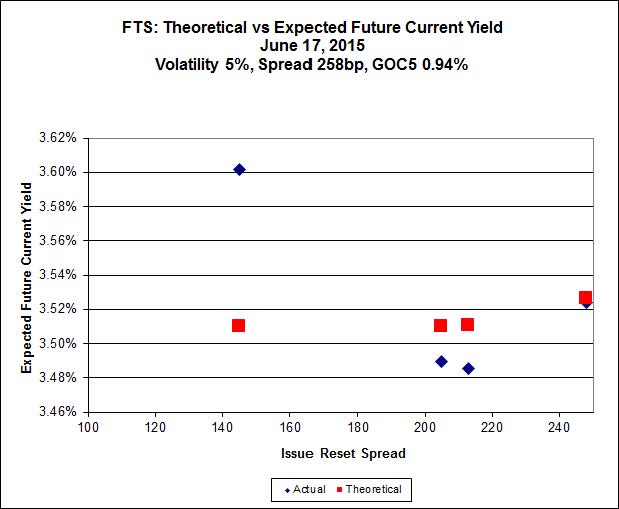
FTS.PR.H, with a spread of +145bp, and bid at 16.52, looks $0.43 cheap and resets 2020-6-1. FTS.PR.G, with a spread of +213bp and resetting 2018-9-1, is bid at 21.95 and is $0.16 rich.

Click for Big
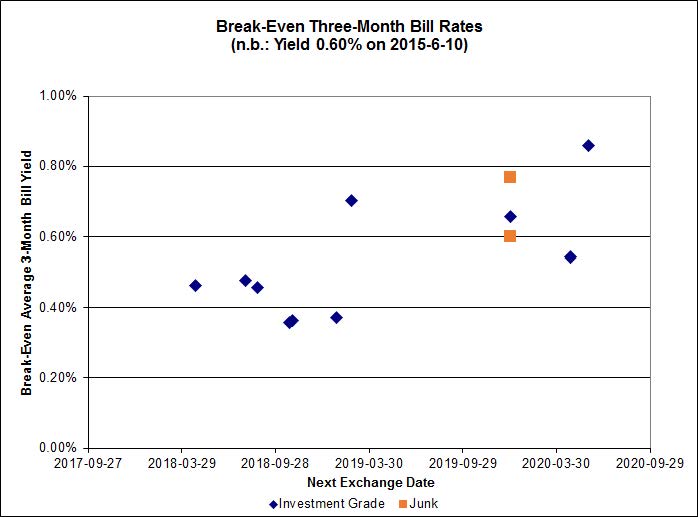
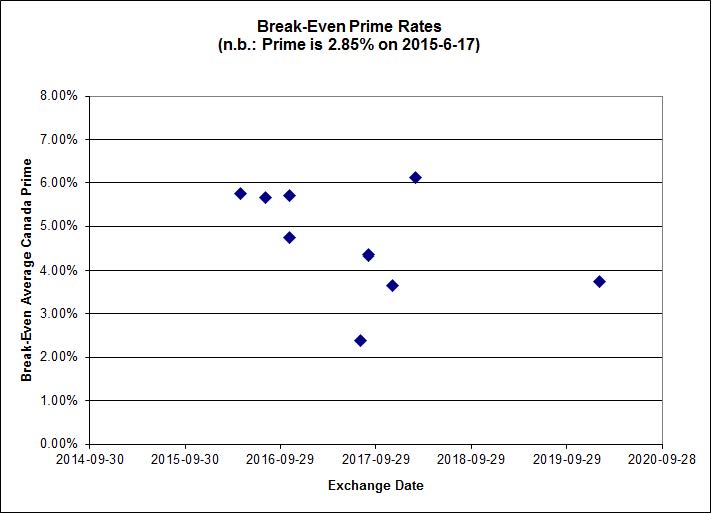
Investment-grade pairs predict an average three-month bill yield over the next five-odd years of about 0.40%, including the outlier TRP.PR.A / TRP.PR.F at -0.37%. On the junk side, three of the six currently extant pairs are outside the range of the graph: DC.PR.B / DC.PR.D at -0.22%; AZP.PR.B / AZP.PR.C at +1.01%; and FFH.PR.E / FFH.PR.F at -0.86%.
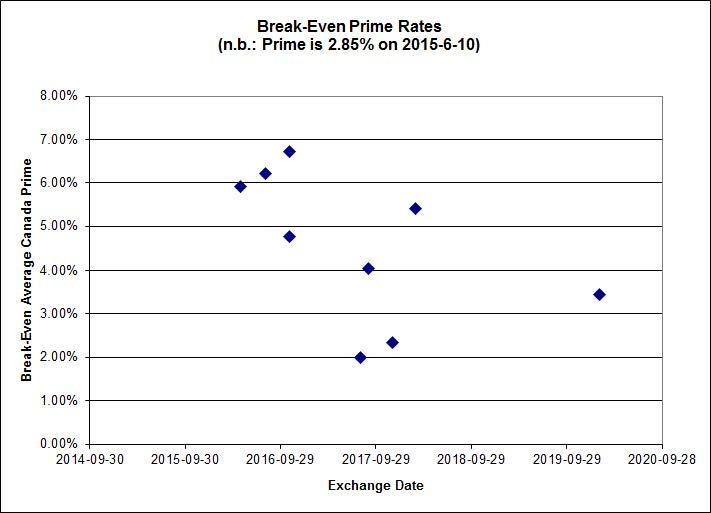
Click for Big
Shall we just say that this exhibits a high level of confidence in the continued rapacity of Canadian banks?
| HIMIPref™ Preferred Indices These values reflect the December 2008 revision of the HIMIPref™ Indices Values are provisional and are finalized monthly |
|||||||
| Index | Mean Current Yield (at bid) |
Median YTW |
Median Average Trading Value |
Median Mod Dur (YTW) |
Issues | Day’s Perf. | Index Value |
| Ratchet | 0.00 % | 0.00 % | 0 | 0.00 | 0 | -1.4111 % | 2,169.8 |
| FixedFloater | 0.00 % | 0.00 % | 0 | 0.00 | 0 | -1.4111 % | 3,793.8 |
| Floater | 3.57 % | 3.58 % | 63,853 | 18.35 | 3 | -1.4111 % | 2,306.6 |
| OpRet | 4.44 % | -11.38 % | 23,529 | 0.08 | 2 | 0.1979 % | 2,782.9 |
| SplitShare | 4.60 % | 4.91 % | 69,262 | 3.28 | 3 | 0.0538 % | 3,239.7 |
| Interest-Bearing | 0.00 % | 0.00 % | 0 | 0.00 | 0 | 0.1979 % | 2,544.7 |
| Perpetual-Premium | 5.46 % | 4.92 % | 58,688 | 4.92 | 19 | 0.0477 % | 2,515.3 |
| Perpetual-Discount | 5.14 % | 5.11 % | 118,950 | 15.24 | 15 | -0.2108 % | 2,732.6 |
| FixedReset | 4.52 % | 3.85 % | 243,492 | 16.30 | 88 | -0.0803 % | 2,345.7 |
| Deemed-Retractible | 5.00 % | 3.26 % | 111,233 | 0.68 | 34 | 0.0572 % | 2,627.5 |
| FloatingReset | 2.52 % | 2.91 % | 56,090 | 6.11 | 9 | -0.0590 % | 2,336.1 |
| Performance Highlights | |||
| Issue | Index | Change | Notes |
| BAM.PR.C | Floater | -1.78 % | YTW SCENARIO Maturity Type : Limit Maturity Maturity Date : 2045-06-17 Maturity Price : 13.80 Evaluated at bid price : 13.80 Bid-YTW : 3.61 % |
| BAM.PR.K | Floater | -1.70 % | YTW SCENARIO Maturity Type : Limit Maturity Maturity Date : 2045-06-17 Maturity Price : 13.90 Evaluated at bid price : 13.90 Bid-YTW : 3.58 % |
| MFC.PR.F | FixedReset | -1.48 % | YTW SCENARIO Maturity Type : Hard Maturity Maturity Date : 2025-01-31 Maturity Price : 25.00 Evaluated at bid price : 17.35 Bid-YTW : 7.07 % |
| MFC.PR.N | FixedReset | -1.35 % | YTW SCENARIO Maturity Type : Hard Maturity Maturity Date : 2025-01-31 Maturity Price : 25.00 Evaluated at bid price : 22.67 Bid-YTW : 4.81 % |
| PWF.PR.T | FixedReset | -1.33 % | YTW SCENARIO Maturity Type : Limit Maturity Maturity Date : 2045-06-17 Maturity Price : 23.35 Evaluated at bid price : 25.16 Bid-YTW : 3.40 % |
| TD.PF.A | FixedReset | -1.19 % | YTW SCENARIO Maturity Type : Limit Maturity Maturity Date : 2045-06-17 Maturity Price : 22.43 Evaluated at bid price : 23.20 Bid-YTW : 3.63 % |
| BMO.PR.S | FixedReset | -1.13 % | YTW SCENARIO Maturity Type : Limit Maturity Maturity Date : 2045-06-17 Maturity Price : 22.63 Evaluated at bid price : 23.52 Bid-YTW : 3.63 % |
| BAM.PR.R | FixedReset | -1.12 % | YTW SCENARIO Maturity Type : Limit Maturity Maturity Date : 2045-06-17 Maturity Price : 19.41 Evaluated at bid price : 19.41 Bid-YTW : 4.39 % |
| SLF.PR.G | FixedReset | 1.05 % | YTW SCENARIO Maturity Type : Hard Maturity Maturity Date : 2025-01-31 Maturity Price : 25.00 Evaluated at bid price : 16.31 Bid-YTW : 7.58 % |
| TRP.PR.E | FixedReset | 1.10 % | YTW SCENARIO Maturity Type : Limit Maturity Maturity Date : 2045-06-17 Maturity Price : 22.31 Evaluated at bid price : 23.00 Bid-YTW : 3.85 % |
| HSE.PR.E | FixedReset | 1.22 % | YTW SCENARIO Maturity Type : Limit Maturity Maturity Date : 2045-06-17 Maturity Price : 23.11 Evaluated at bid price : 24.81 Bid-YTW : 4.49 % |
| FTS.PR.K | FixedReset | 1.28 % | YTW SCENARIO Maturity Type : Limit Maturity Maturity Date : 2045-06-17 Maturity Price : 21.35 Evaluated at bid price : 21.35 Bid-YTW : 3.80 % |
| FTS.PR.G | FixedReset | 1.34 % | YTW SCENARIO Maturity Type : Limit Maturity Maturity Date : 2045-06-17 Maturity Price : 21.70 Evaluated at bid price : 21.95 Bid-YTW : 3.70 % |
| HSE.PR.A | FixedReset | 1.37 % | YTW SCENARIO Maturity Type : Limit Maturity Maturity Date : 2045-06-17 Maturity Price : 16.32 Evaluated at bid price : 16.32 Bid-YTW : 4.32 % |
| MFC.PR.K | FixedReset | 1.65 % | YTW SCENARIO Maturity Type : Hard Maturity Maturity Date : 2025-01-31 Maturity Price : 25.00 Evaluated at bid price : 22.75 Bid-YTW : 4.62 % |
| Volume Highlights | |||
| Issue | Index | Shares Traded |
Notes |
| HSE.PR.G | FixedReset | 966,420 | New issue settled today. YTW SCENARIO Maturity Type : Limit Maturity Maturity Date : 2045-06-17 Maturity Price : 23.01 Evaluated at bid price : 24.59 Bid-YTW : 4.54 % |
| ENB.PR.P | FixedReset | 129,554 | RBC crossed 111,800 at 18.10. YTW SCENARIO Maturity Type : Limit Maturity Maturity Date : 2045-06-17 Maturity Price : 18.51 Evaluated at bid price : 18.51 Bid-YTW : 4.91 % |
| MFC.PR.L | FixedReset | 93,106 | TD crossed 50,000 at 22.70. RBC crossed 40,000 at the same price. YTW SCENARIO Maturity Type : Hard Maturity Maturity Date : 2025-01-31 Maturity Price : 25.00 Evaluated at bid price : 22.30 Bid-YTW : 4.94 % |
| BMO.PR.R | FloatingReset | 92,925 | TD crossed blocks of 27,500 and 60,000, both at 24.15. YTW SCENARIO Maturity Type : Hard Maturity Maturity Date : 2022-01-31 Maturity Price : 25.00 Evaluated at bid price : 24.15 Bid-YTW : 2.80 % |
| NA.PR.Q | FixedReset | 59,010 | TD crossed 58,500 at 25.25. YTW SCENARIO Maturity Type : Hard Maturity Maturity Date : 2022-01-31 Maturity Price : 25.00 Evaluated at bid price : 25.20 Bid-YTW : 3.51 % |
| MFC.PR.J | FixedReset | 52,700 | RBC crossed 50,000 at 24.75. YTW SCENARIO Maturity Type : Hard Maturity Maturity Date : 2025-01-31 Maturity Price : 25.00 Evaluated at bid price : 24.60 Bid-YTW : 3.95 % |
| There were 33 other index-included issues trading in excess of 10,000 shares. | |||
| Wide Spread Highlights | ||
| Issue | Index | Quote Data and Yield Notes |
| MFC.PR.M | FixedReset | Quote: 23.07 – 24.00 Spot Rate : 0.9300 Average : 0.5832 YTW SCENARIO |
| TRP.PR.F | FloatingReset | Quote: 18.55 – 19.28 Spot Rate : 0.7300 Average : 0.4375 YTW SCENARIO |
| RY.PR.K | FloatingReset | Quote: 24.51 – 24.98 Spot Rate : 0.4700 Average : 0.3561 YTW SCENARIO |
| BAM.PF.G | FixedReset | Quote: 24.27 – 24.57 Spot Rate : 0.3000 Average : 0.2017 YTW SCENARIO |
| MFC.PR.N | FixedReset | Quote: 22.67 – 23.00 Spot Rate : 0.3300 Average : 0.2374 YTW SCENARIO |
| BAM.PR.R | FixedReset | Quote: 19.41 – 19.73 Spot Rate : 0.3200 Average : 0.2276 YTW SCENARIO |