The Bank of Canada didn’t move today:
The Bank of Canada today announced that it is maintaining its target for the overnight rate at 3/4 per cent. The Bank Rate is correspondingly 1 per cent and the deposit rate is 1/2 per cent.
Inflation in Canada continues to track the path outlined in the Bank’s April Monetary Policy Report (MPR). Total CPI inflation is near the bottom of the Bank’s 1 to 3 per cent inflation control range, largely due to the transitory effects of sharply lower energy prices. Core inflation remains above 2 per cent, boosted by the pass-through effects of past depreciation of the Canadian dollar, as well as certain sector-specific factors. Seeing through the various temporary factors, the Bank estimates that the underlying trend of inflation is 1.6 to 1.8 per cent, consistent with persistent slack in the economy.
The outlook for the Canadian economy also remains largely in line with the April MPR. While a weak first quarter in the United States has raised questions about that economy’s underlying strength, the Bank expects a return to solid growth in the second quarter. This will help advance the rotation of demand in Canada toward more exports and business investment. Recent indicators suggest consumption in Canada is holding up relatively well, given the impact of lower oil prices on gross domestic income.
Despite the recent back-up in global bond yields, financial conditions for Canadian households and firms remain highly stimulative. The Canadian dollar has strengthened in recent weeks in the context of higher oil prices and a softer U.S. dollar. If these developments are sustained, their net effect will need to be assessed as more data become available in the months ahead.
Although a number of complex adjustments are under way, the Bank’s assessment of risks to the inflation profile has not materially changed. Risks to financial stability remain elevated, but appear to be evolving as expected. Weighing all of these risks, the Bank judges that the current degree of monetary policy stimulus remains appropriate and therefore the target for the overnight rate remains at 3/4 per cent.
John Heinzl had an interview with Nicolas Normandeau, the manager of the $430-million Horizons Active Preferred Share ETF (HPR):
He was on the other end of the trades scooping up shares at fire-sale prices.
“During the selloff I was buying everything,” said the manager of the $430-million Horizons Active Preferred Share ETF (HPR). “I was buying about $4-million to $5-million a day. That’s a big number.”
…
Faced with falling shares prices and reduced dividend income, many preferred shareholders panicked – particularly retail investors, Mr. Normandeau said. “They were just selling every issue they have,” he said. That’s when he started aggressively investing the cash he had been accumulating.
His timing worked out well. Preferred share prices have rebounded in recent weeks and, although he’s not buying as aggressively as he was in late 2014 and early 2015, he still thinks many rate-reset preferreds offer attractive potential returns – and acceptable interest rate risks – at current levels.
Market timing, feh. Live by the sword, die by the sword. He’s doing pretty well on a three-year basis … but with market timing you’ve got to be right all the time.
Yesterday I expressed my approbation of the plan to allow voluntary contributions to the Canada Pension Plan. It would seem I’m not the only one:
“We think it’s a good proposal,” said Graham Smith, senior policy adviser at the Investment Funds Institute of Canada, which advocates on behalf of the investment industry.
Ian Russell, president and chief executive of the Investment Industry Association of Canada, also sounded upbeat.
“It provides Canadians with another option,” he said.
…
Don Drummond, a professor at Queen’s University and former chief economist at Toronto-Dominion Bank, pointed out that mutual fund fees are particularly hard for investors to stomach in a low-return environment.
The industry would likely have to respond to competition for savers’ assets by cutting fees, or creating new genres of investment vehicles that stand apart from what the CPP Fund offers.
Mr. Drummond said people will love the option of contributing extra funds to the CPP, which could override any concerns voiced from the investment industry during the upcoming consultations on the issue.
In any case, he noted, the investment industry tends to chase people who have savings of more than $600,000 – a relatively small slice of the population that might not be significantly swayed by the potential for a bigger CPP contribution.
Mr. Drummond is an optimist. It would be far more logical to raise mutual fund fees so salesmen can be paid a bigger trailer.
As far as industry reaction is concerned, I’m looking forward to competition from deferred annuities, with a little head-to-head competition between the CPPIB and the insurance companies.
However, opinion is not unanimous, or at least it wasn’t five years ago:
The Conservative government rejected a voluntary expansion of the Canada Pension Plan five years ago as overly expensive and misguided, a history that is raising questions as to why it is now proposing that very idea.
…
The call for consultations is in spite of the fact that Finance Canada held detailed talks and contracted policy experts throughout 2009 and 2010 to weigh in on the state of retirement saving in Canada.
After the study, then-finance minister Jim Flaherty said it was clear that “some sort of voluntary new CPP method” wouldn’t work.
“This was rejected unanimously by our partners in the federation when we met and discussed the issue because it would not work and because the CPP would be unable to administer it,” he told the House of Commons in September 2010.
Ted Menzies, who was then the Conservative minister responsible for the pensions file, went further.
“The verdict was unanimous. This was not a good idea,” Mr. Menzies told the House in November 2010. “The consensus of governments and public-interest groups from across the political spectrum has been that this would be costly, ineffective and, ultimately, a misguided solution.”
It’s good to see some bio-octane being produced:
Global Bioenergies (Alternext Paris: ALGBE) and Audi announce that the first batch of renewable gasoline has been produced. It will be presented to Audi by Global Bioenergies during a press conference to be held in Pomacle on the 21st of May.
The first isobutene batch produced from renewable resources (here: corn-derived glucose) at Global Bioenergies’ industrial pilot in Pomacle-Bazancourt, near Reims in France, had been delivered to the chemical company Arkema early May 2015. Subsequent isobutene batches have been converted into isooctane by the Fraunhofer Institute at the Leuna refinery near Leipzig where Global Bioenergies is now building its demo plant.
…
Reiner Mangold, Head of sustainable product development at Audi declares: “The confirmation that Global Bioenergies’ renewable isobutene is compatible with a commonly used fossil isobutene to isooctane conversion technology represents a key step on our way to Audi ‘ebenzin’. We are now looking forward to working together with Global Bioenergies on a technology allowing the production of renewable isooctane not derived from biomass sources, following Audi’s ‘e-fuels’ strategy.”
It’s a pity that they didn’t put more meat in the press release. What’s the efficiency of this process vs. gasohol production? And where do they stand in the project not to use biomass?
Canadian General Investments, Limited, proud issuer of CGI.PR.C and CGI.PR.D, was confirmed at Pfd-1(low) by DBRS:
DBRS Limited (DBRS) has today confirmed the ratings of the 3.90% Cumulative Redeemable Class A Preference Shares, Series 3 (the Series 3 Preference Shares) and the 3.75% Cumulative Redeemable Class A Preference Shares, Series 4 (the Series 4 Preference Shares; collectively, with the Series 3 Preference Shares, the Preference Shares) issued by Canadian General Investments, Limited (the Company) at Pfd-1 (low). The Series 3 Preference Shares and Series 4 Preference Shares rank pari passu and will be retractable at the option of their holders on or after June 15, 2016, and June 15, 2023, respectively.
The Company holds a well-diversified portfolio consisting primarily of common shares of Canadian companies (the Portfolio). Since the last rating confirmation in May 2014, the performance of the portfolio has been stable. The current downside protection available to the portfolio is approximately 79.8%. Holders of the Series 3 Preference Shares are entitled to receive fixed cumulative preferential cash dividends of $0.975 per annum, yielding 3.90% on the initial issue price, while holders of the Series 4 Preference Shares are entitled to cash dividends of $0.9375 per annum, yielding 3.75% per annum on the initial issue price. Income received on the Portfolio will be able to cover approximately 65% of distributions to all series of Preference Shares, based on the Portfolio holdings as of May 15, 2015. Despite the grind caused by the drop in the distribution coverage ratio and the regular distributions to holders of the common shares of the Company, downside protection remains commensurate with the current ratings of the Preference Shares.
It was a positive day for the Canadian preferred share market, with PerpetualDiscounts up 10bp, FixedResets gaining 6bp and DeemedRetractibles winning 28bp. The Performance Highlights table is very lengthy, with ENB issues prominent winners. Volume was below average.
PerpetualDiscounts now yield 5.07%, equivalent to 6.59% interest at the standard equivalency factor of 1.3x. Long corporates now yield about 3.95%, so the pre-tax interest-equivalent spread (in this context, the “Seniority Spread”) is now about 265bp, unchanged from the May 20 report.
For as long as the FixedReset market is so violently unsettled, I’ll keep publishing updates of the more interesting and meaningful series of FixedResets’ Implied Volatilities. This doesn’t include Enbridge because although Enbridge has a large number of issues outstanding, all of which are quite liquid, the range of Issue Reset Spreads is too small for decent conclusions. The low is 212bp (ENB.PR.H; second-lowest is ENB.PR.D at 237bp) and the high is a mere 268 for ENB.PF.G.
Remember that all rich /cheap assessments are:
» based on Implied Volatility Theory only
» are relative only to other FixedResets from the same issuer
» assume constant GOC-5 yield
» assume constant Implied Volatility
» assume constant spread
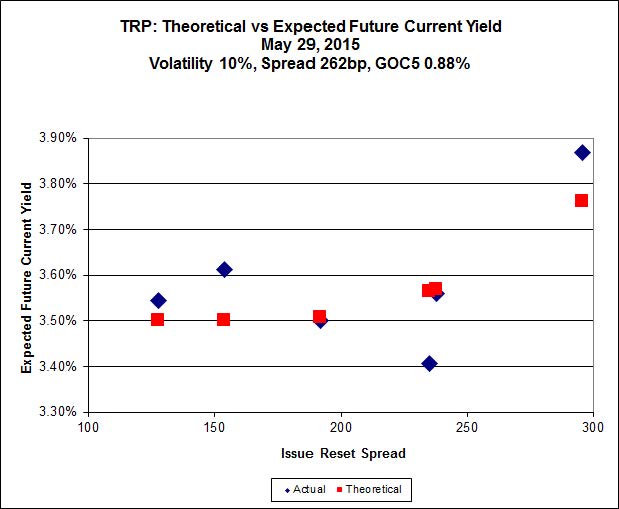
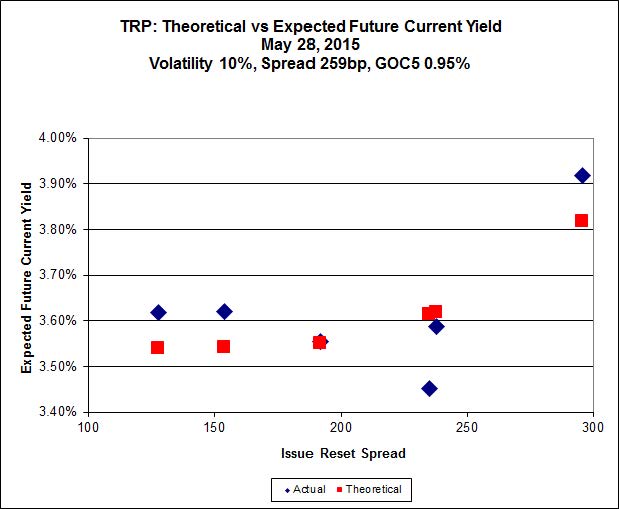
Here’s TRP:
 Click for Big
TRP.PR.E, which resets 2019-10-30 at +235, is bid at 24.10 to be $1.07 rich, while TRP.PR.G, resetting 2020-11-30 at +296, is $0.75 cheap at its bid price of 25.00.
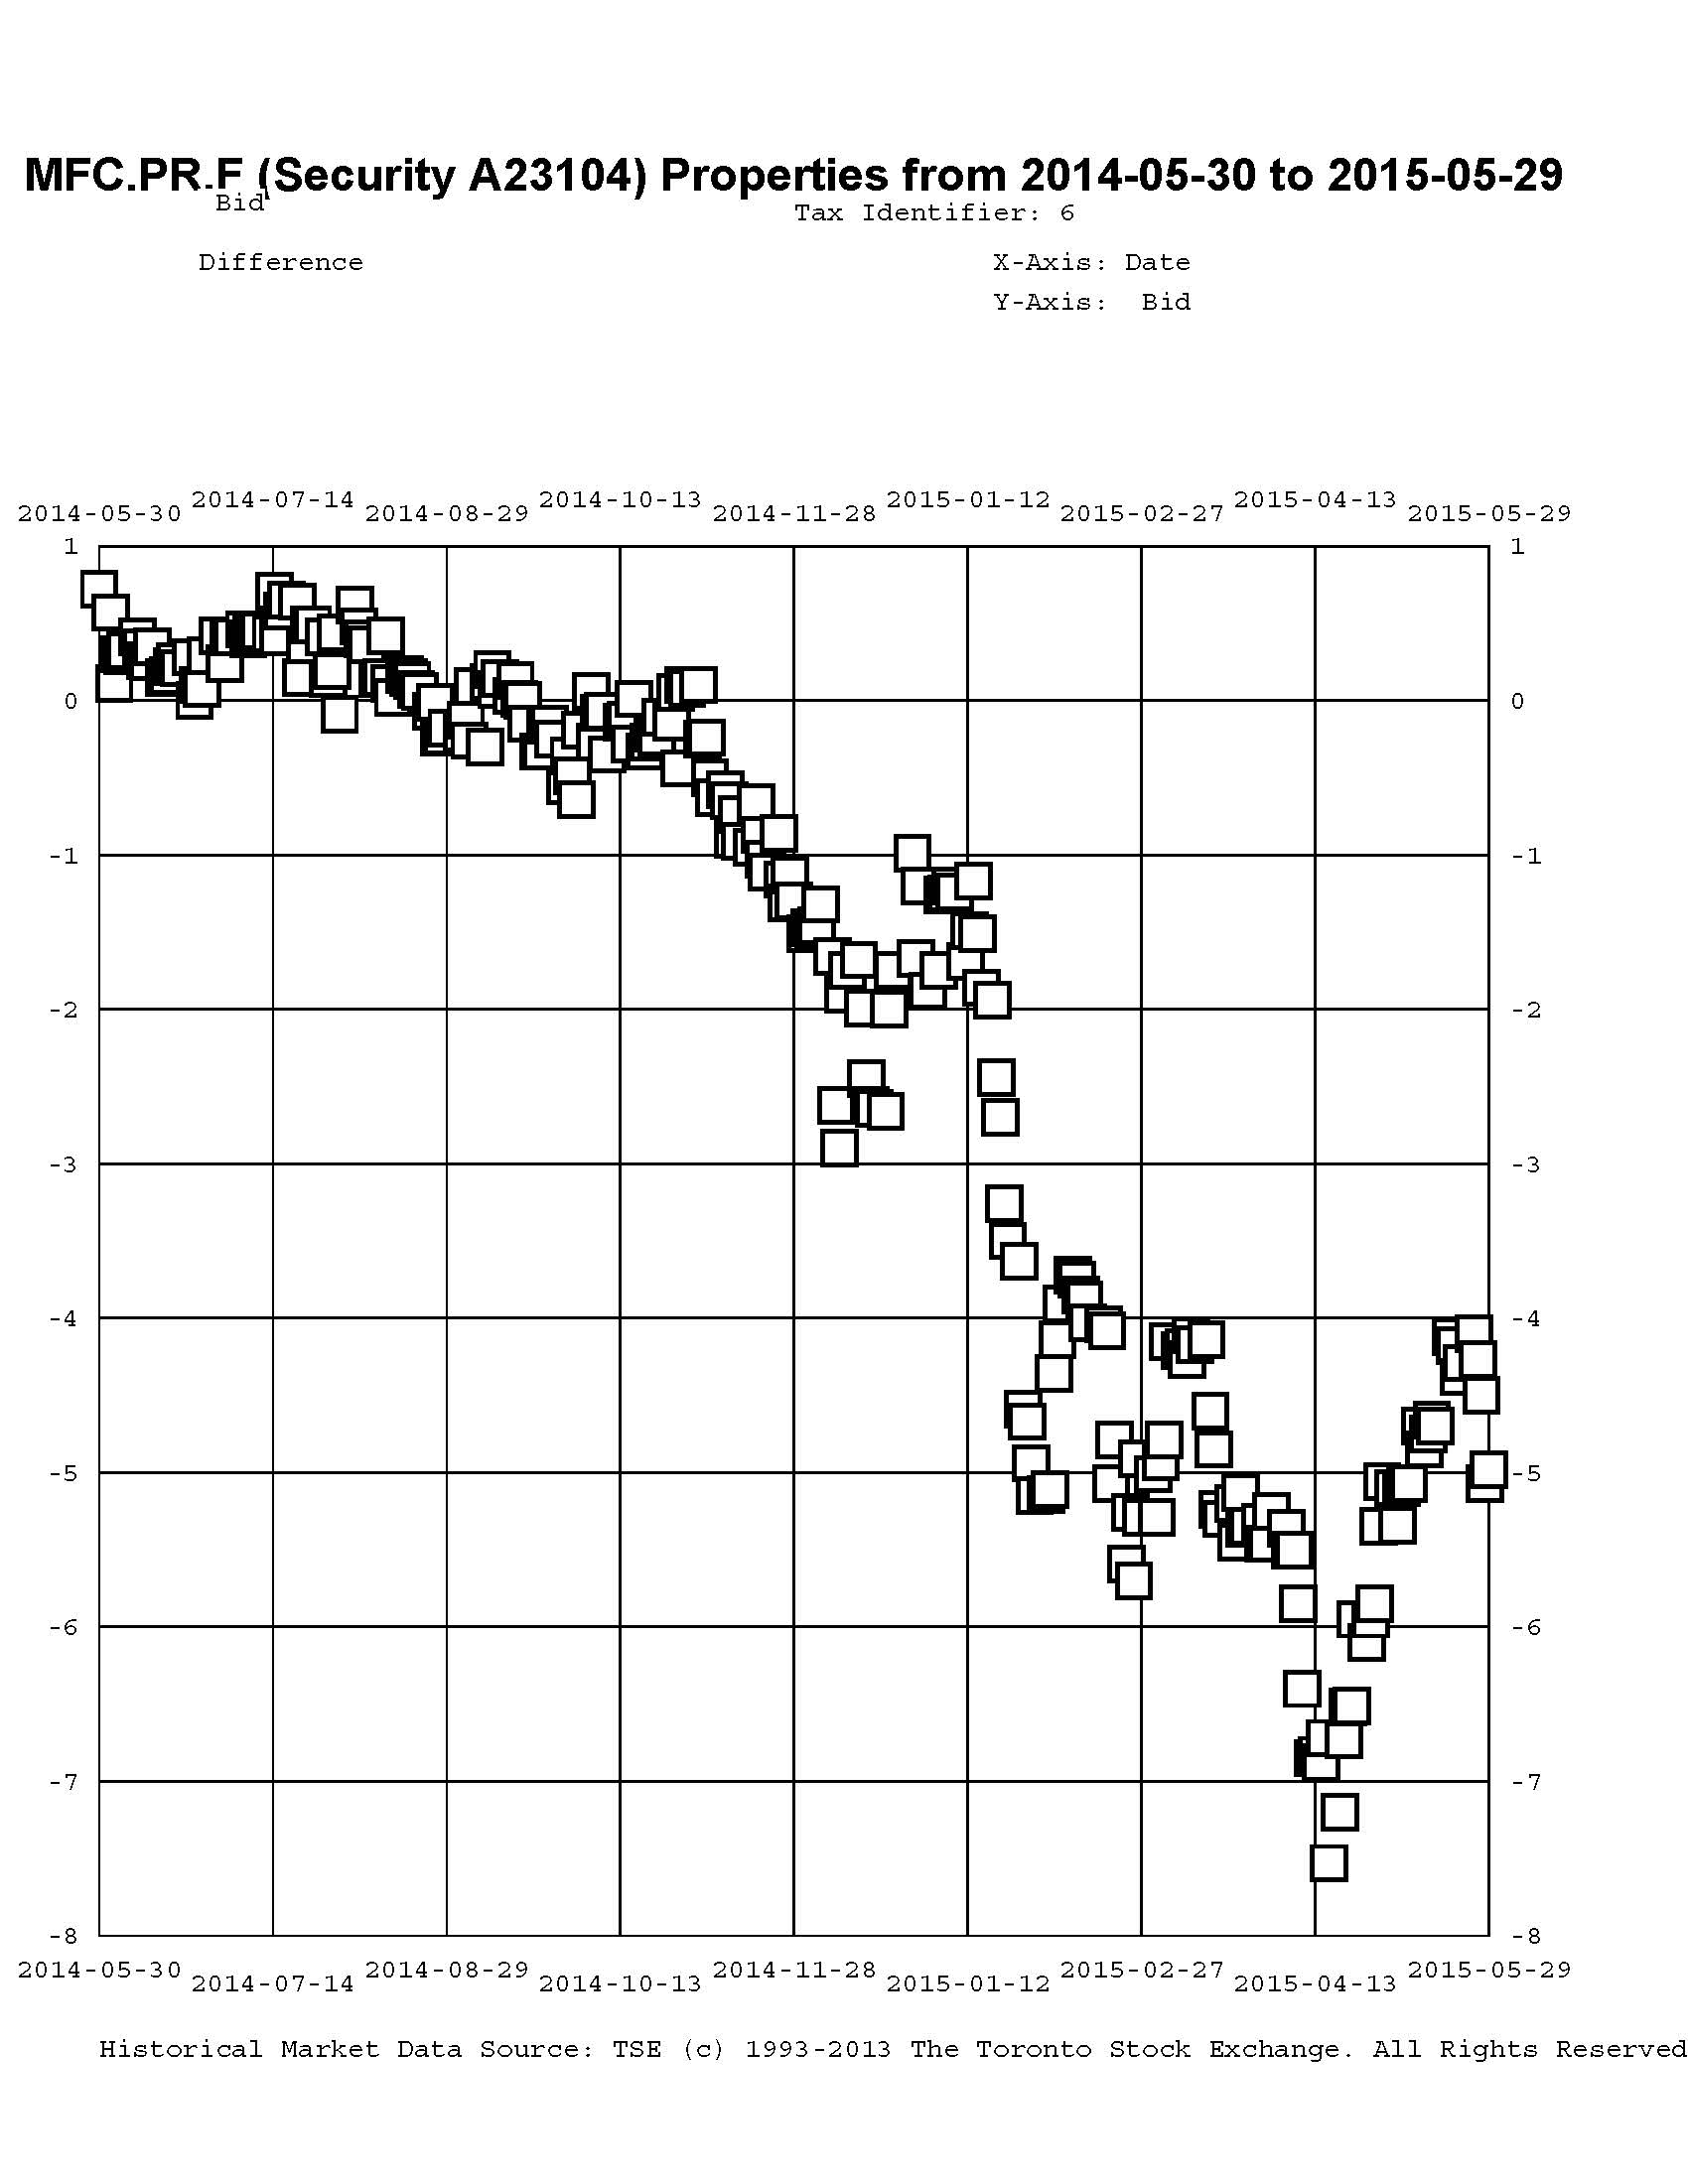
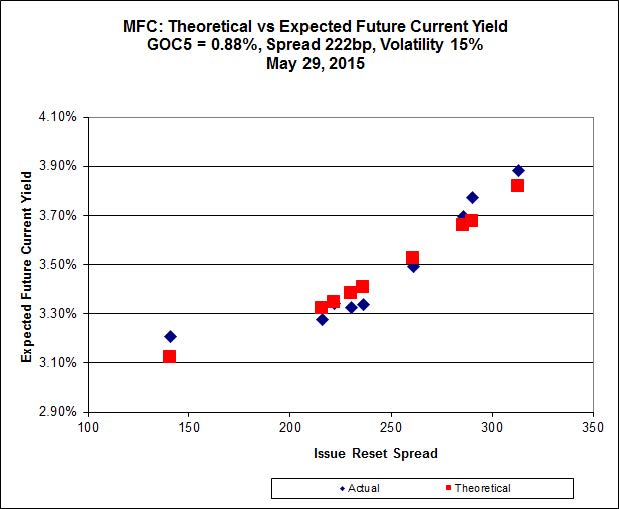
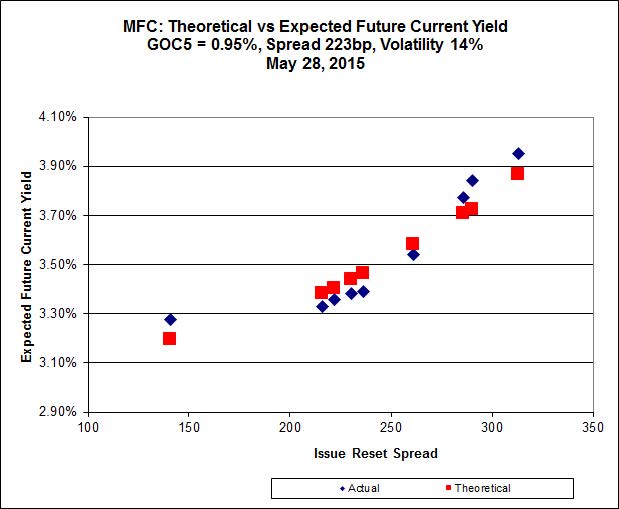
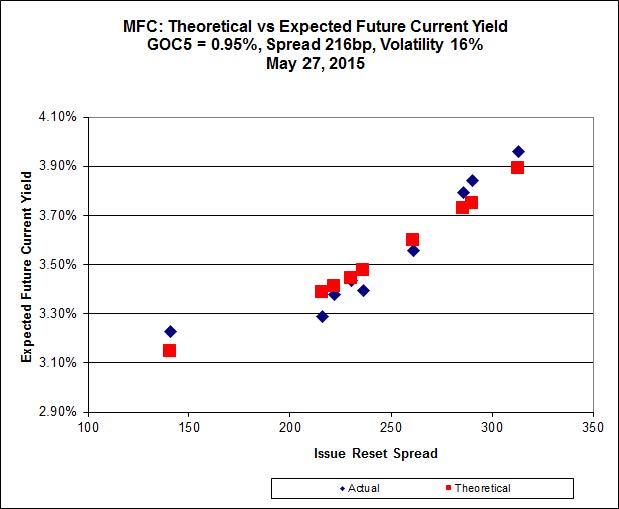
 Click for Big
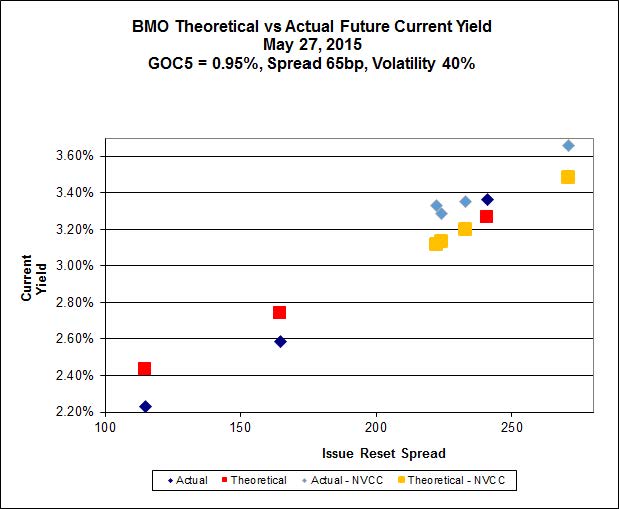
Another excellent fit, but the numbers are perplexing. Implied Volatility for MFC continues to be a conundrum. It is still too high if we consider that NVCC rules will never apply to these issues; it is still too low if we consider them to be NVCC non-compliant issues (and therefore with Deemed Maturities in the call schedule).
Most expensive is MFC.PR.L, resetting at +216 on 2019-6-19, bid at 23.65 to be $0.69 rich, while MFC.PR.G, resetting at +290bp on 2016-12-19, is bid at 25.05 to be $0.63 cheap.
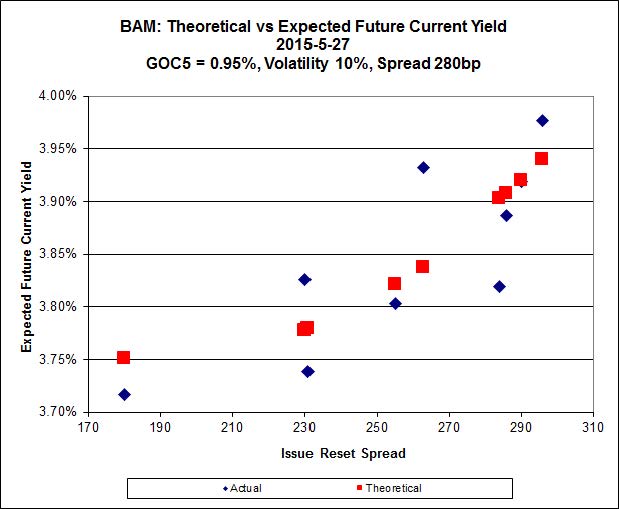
 Click for Big
The cheapest issue relative to its peers is BAM.PF.B, resetting at +263bp on 2019-3-31, bid at 22.76 to be $0.57 cheap. BAM.PF.G, resetting at +284bp 2020-6-30 is bid at 24.81 and appears to be $0.53 rich.
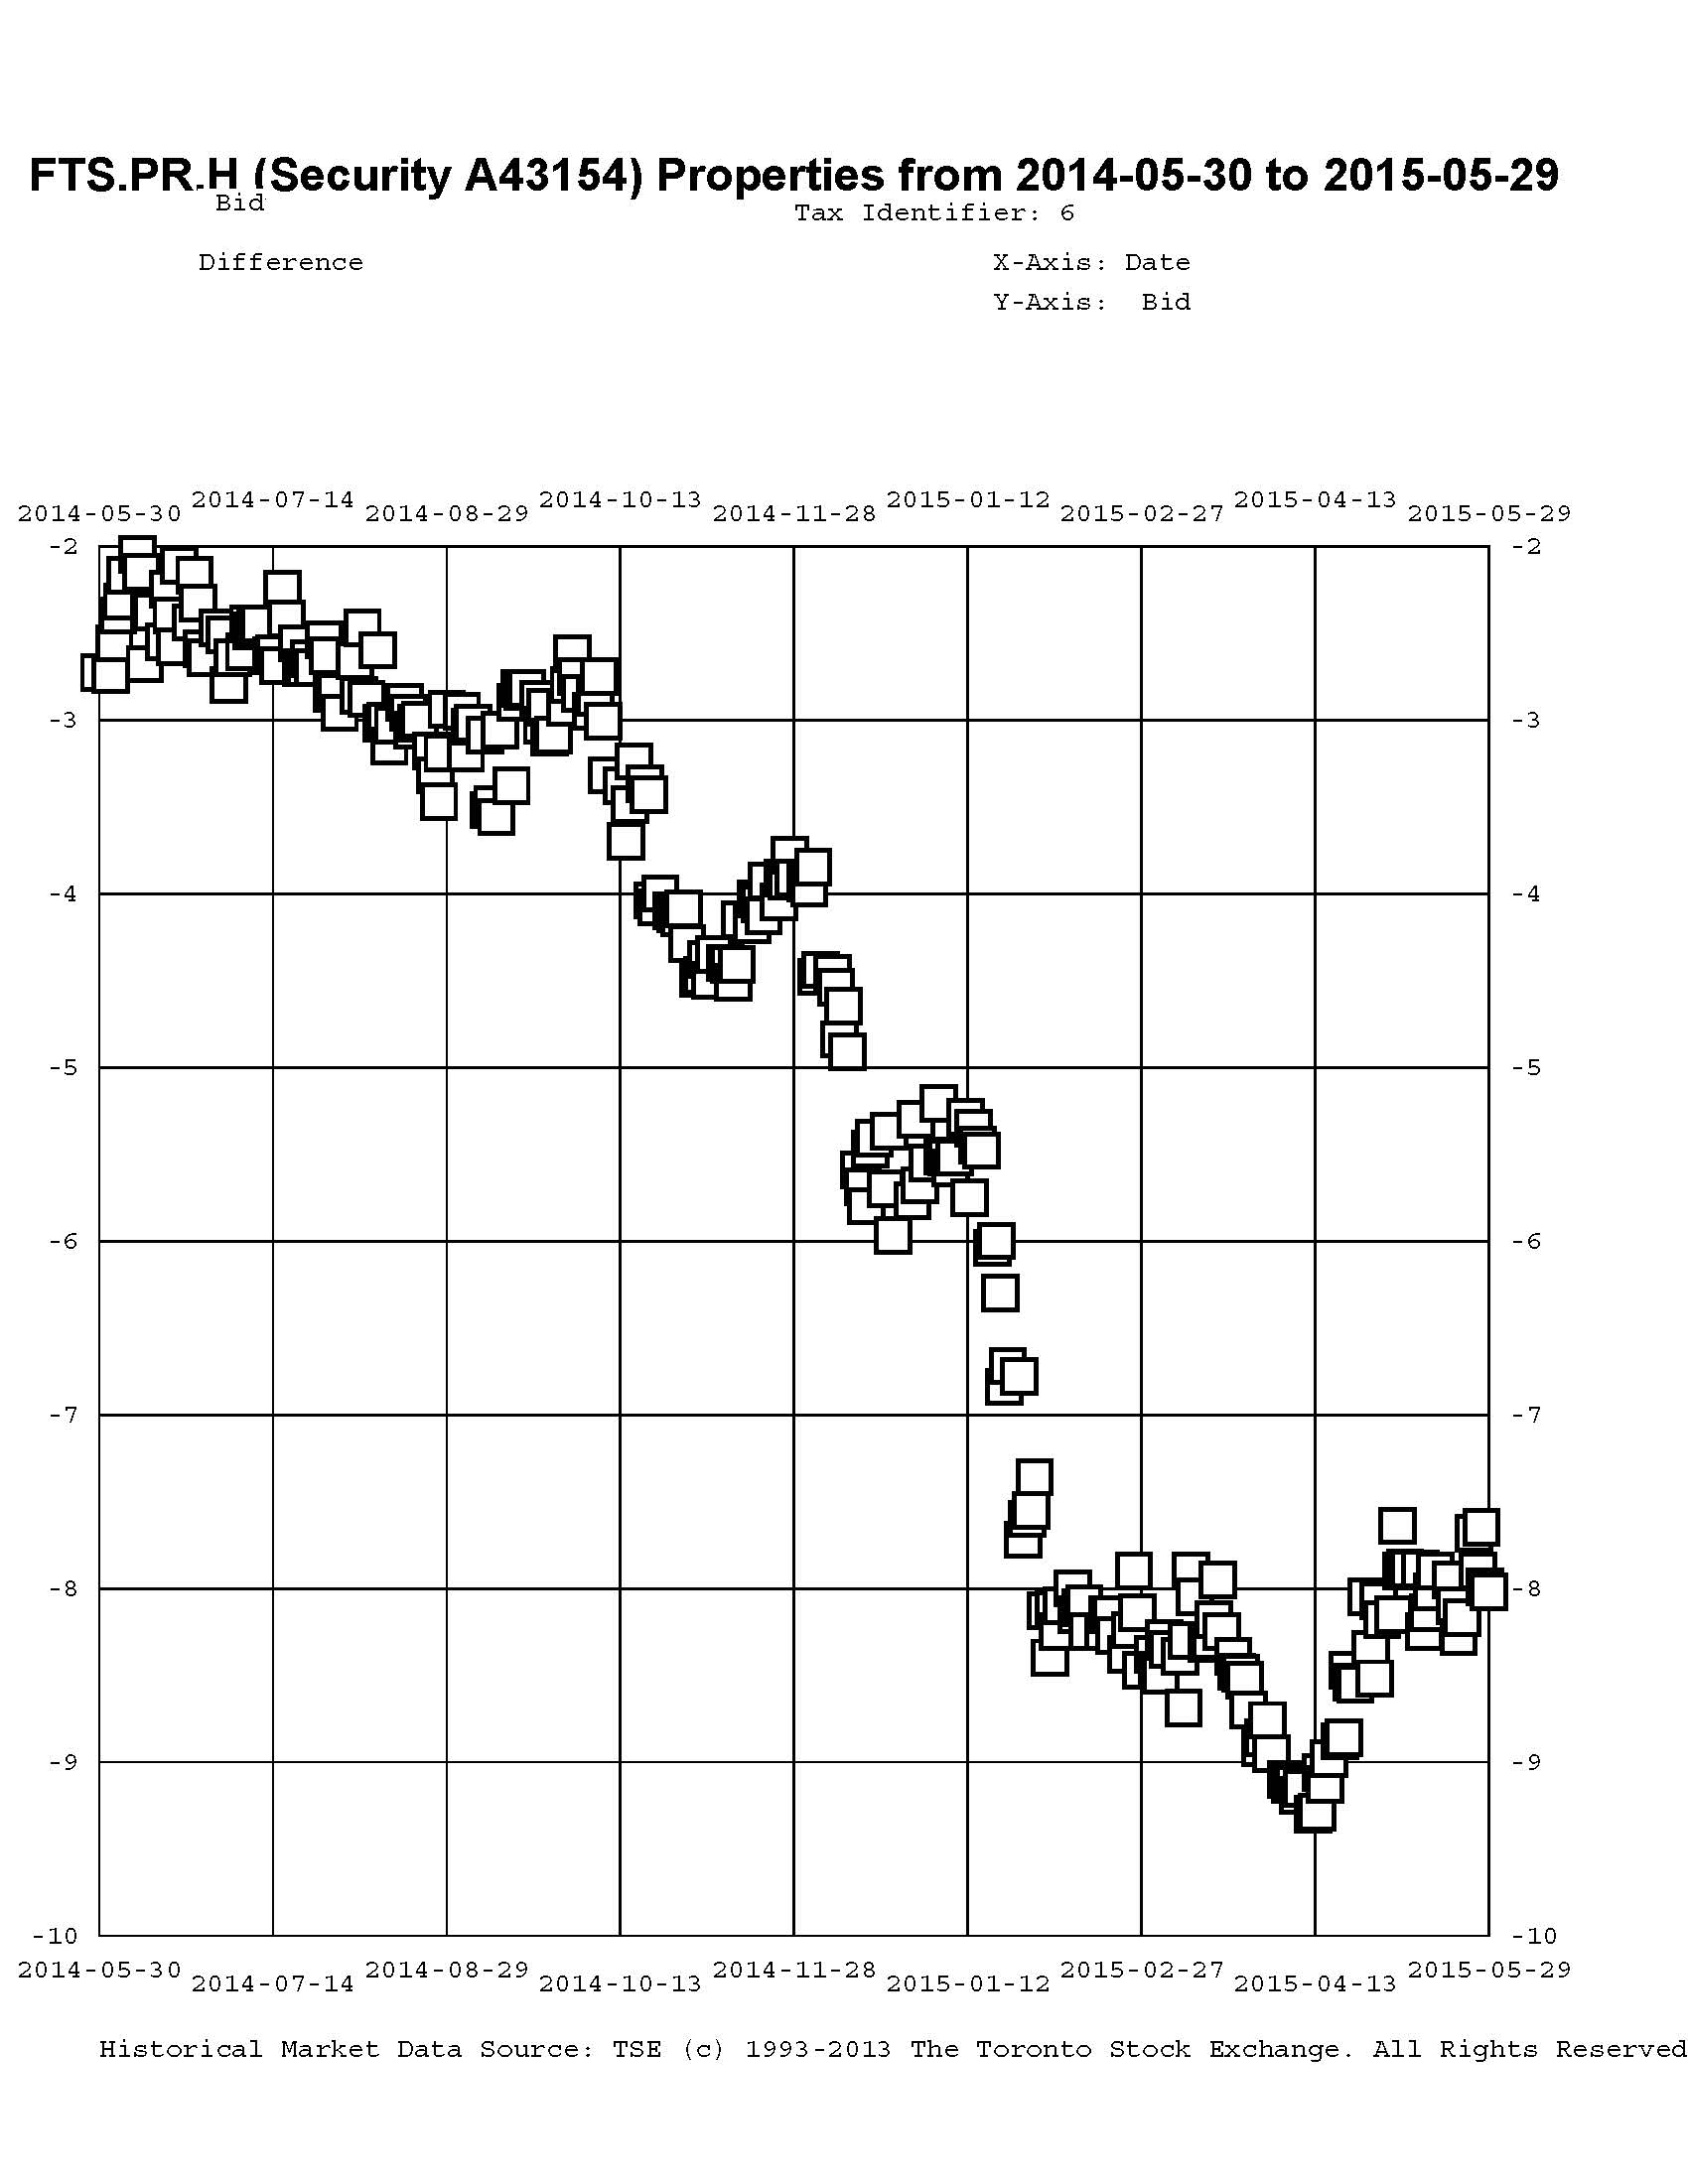
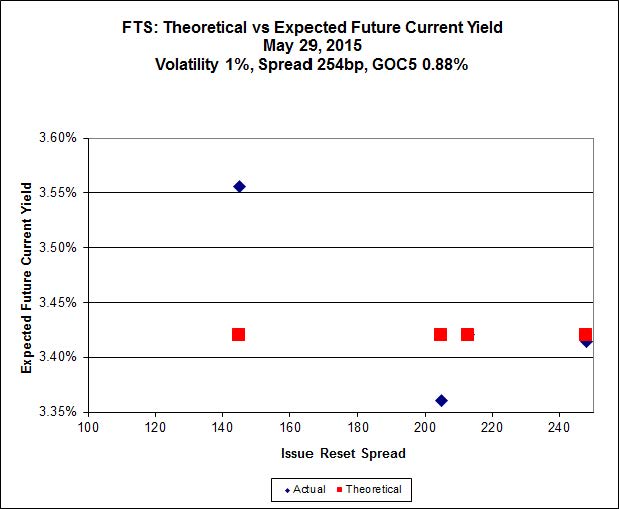
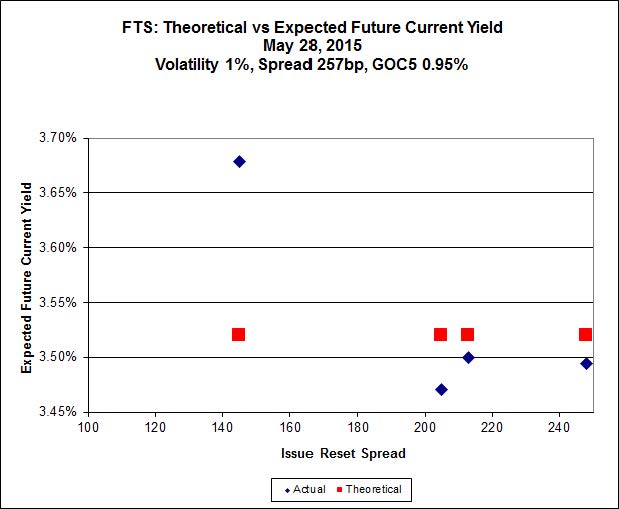
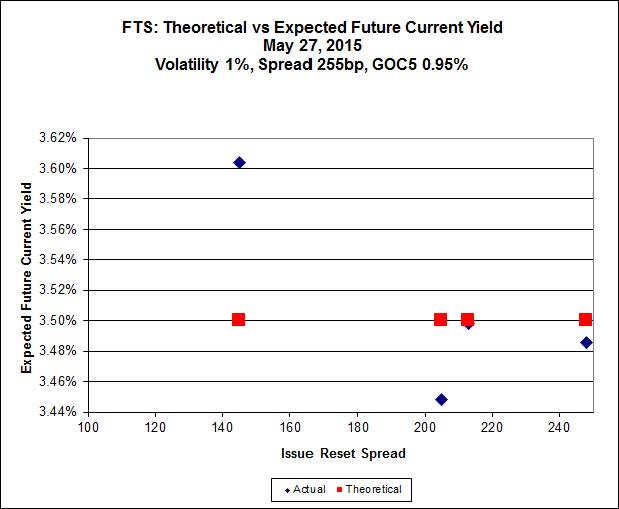
 Click for Big
FTS.PR.H, with a spread of +145bp, and bid at 16.65, looks $0.49 cheap and resets 2015-6-1. FTS.PR.K, with a spread of +205bp and resetting 2019-3-1, is bid at 21.75 and is $0.32 rich.
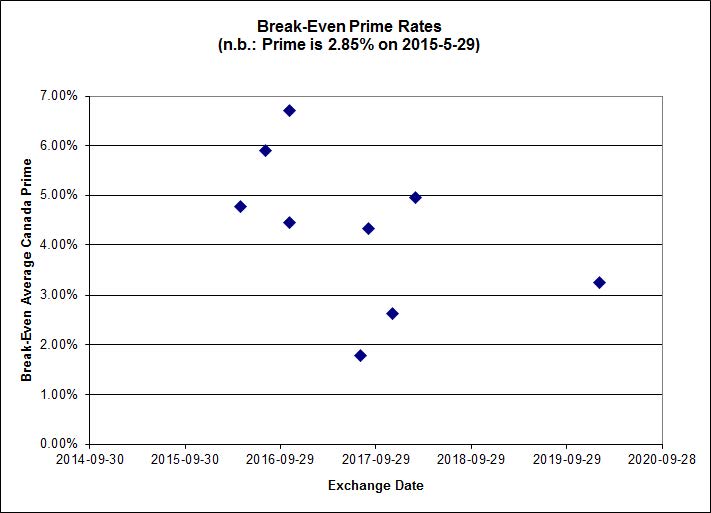
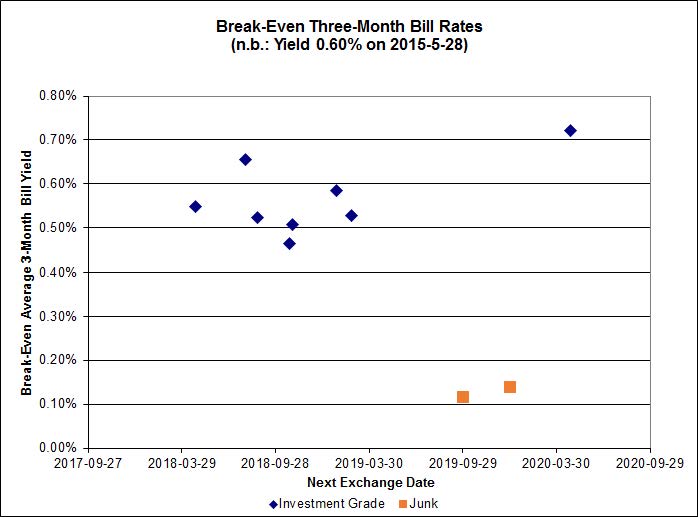
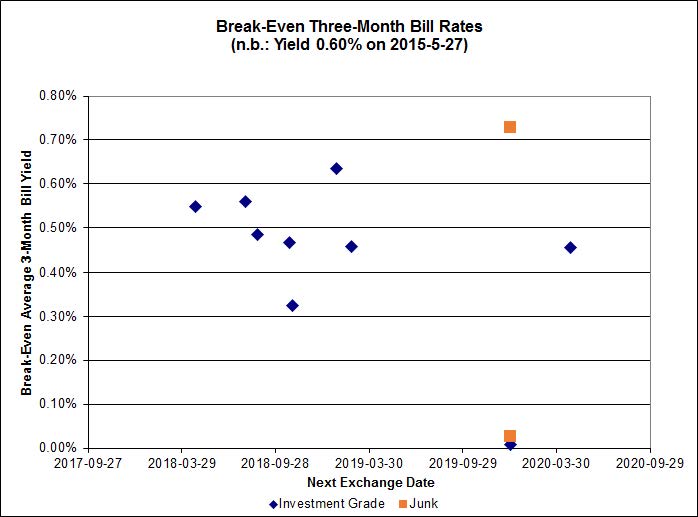
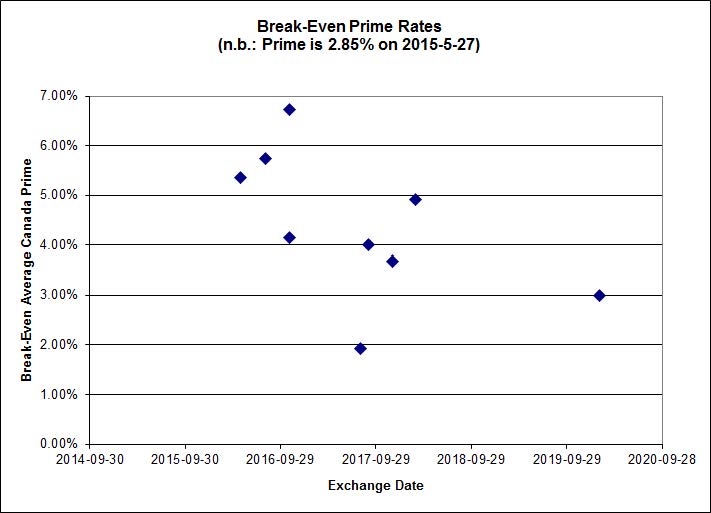
 Click for Big
Investment-grade pairs predict an average over the next five-odd years of about 0.45%, including the TRP.PR.A / TRP.PR.F at 0.01%. On the junk side, four pairs are showing negative breakeven rates and are not shown: FFH.PR.E / FFH.PR.F at -1.15%; DC.PR.B / DC.PR.D at -1.39%; AIM.PR.A / AIM.PR.B at -1.01% and BRF.PR.A / BRF.PR.B at -0.63%.
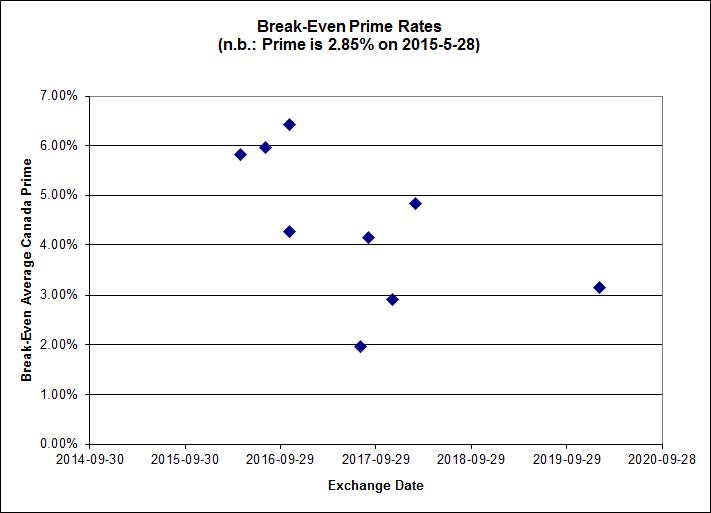
 Click for Big
Shall we just say that this exhibits a high level of confidence in the continued rapacity of Canadian banks?
HIMIPref™ Preferred Indices
These values reflect the December 2008 revision of the HIMIPref™ Indices
Values are provisional and are finalized monthly |
| Index |
Mean
Current
Yield
(at bid) |
Median
YTW |
Median
Average
Trading
Value |
Median
Mod Dur
(YTW) |
Issues |
Day’s Perf. |
Index Value |
| Ratchet |
0.00 % |
0.00 % |
0 |
0.00 |
0 |
1.2941 % |
2,278.9 |
| FixedFloater |
0.00 % |
0.00 % |
0 |
0.00 |
0 |
1.2941 % |
3,984.5 |
| Floater |
3.19 % |
3.34 % |
51,933 |
18.84 |
4 |
1.2941 % |
2,422.6 |
| OpRet |
4.45 % |
-11.12 % |
29,708 |
0.10 |
2 |
0.0198 % |
2,780.8 |
| SplitShare |
4.58 % |
4.47 % |
65,105 |
3.34 |
3 |
0.4164 % |
3,254.5 |
| Interest-Bearing |
0.00 % |
0.00 % |
0 |
0.00 |
0 |
0.0198 % |
2,542.7 |
| Perpetual-Premium |
5.46 % |
3.09 % |
61,776 |
0.42 |
18 |
0.1202 % |
2,519.3 |
| Perpetual-Discount |
5.09 % |
5.07 % |
119,276 |
15.36 |
15 |
0.0956 % |
2,766.7 |
| FixedReset |
4.44 % |
3.78 % |
269,552 |
16.08 |
86 |
0.0619 % |
2,399.6 |
| Deemed-Retractible |
4.97 % |
3.45 % |
103,825 |
0.73 |
34 |
0.2787 % |
2,630.7 |
| FloatingReset |
2.55 % |
2.91 % |
57,617 |
6.15 |
7 |
0.0364 % |
2,340.8 |
| Performance Highlights |
| Issue |
Index |
Change |
Notes |
| GWO.PR.N |
FixedReset |
-4.42 % |
YTW SCENARIO
Maturity Type : Hard Maturity
Maturity Date : 2025-01-31
Maturity Price : 25.00
Evaluated at bid price : 17.28
Bid-YTW : 7.02 % |
| PWF.PR.A |
Floater |
-1.72 % |
YTW SCENARIO
Maturity Type : Limit Maturity
Maturity Date : 2045-05-27
Maturity Price : 17.70
Evaluated at bid price : 17.70
Bid-YTW : 2.83 % |
| SLF.PR.G |
FixedReset |
-1.71 % |
YTW SCENARIO
Maturity Type : Hard Maturity
Maturity Date : 2025-01-31
Maturity Price : 25.00
Evaluated at bid price : 17.25
Bid-YTW : 6.90 % |
| PWF.PR.P |
FixedReset |
-1.67 % |
YTW SCENARIO
Maturity Type : Limit Maturity
Maturity Date : 2045-05-27
Maturity Price : 18.21
Evaluated at bid price : 18.21
Bid-YTW : 3.77 % |
| TD.PF.C |
FixedReset |
-1.51 % |
YTW SCENARIO
Maturity Type : Limit Maturity
Maturity Date : 2045-05-27
Maturity Price : 22.56
Evaluated at bid price : 23.50
Bid-YTW : 3.58 % |
| TRP.PR.A |
FixedReset |
-1.16 % |
YTW SCENARIO
Maturity Type : Limit Maturity
Maturity Date : 2045-05-27
Maturity Price : 20.51
Evaluated at bid price : 20.51
Bid-YTW : 3.76 % |
| MFC.PR.F |
FixedReset |
-1.08 % |
YTW SCENARIO
Maturity Type : Hard Maturity
Maturity Date : 2025-01-31
Maturity Price : 25.00
Evaluated at bid price : 18.28
Bid-YTW : 6.42 % |
| TRP.PR.B |
FixedReset |
-1.08 % |
YTW SCENARIO
Maturity Type : Limit Maturity
Maturity Date : 2045-05-27
Maturity Price : 15.55
Evaluated at bid price : 15.55
Bid-YTW : 3.80 % |
| RY.PR.M |
FixedReset |
1.03 % |
YTW SCENARIO
Maturity Type : Limit Maturity
Maturity Date : 2045-05-27
Maturity Price : 22.95
Evaluated at bid price : 24.50
Bid-YTW : 3.67 % |
| ENB.PR.T |
FixedReset |
1.09 % |
YTW SCENARIO
Maturity Type : Limit Maturity
Maturity Date : 2045-05-27
Maturity Price : 19.47
Evaluated at bid price : 19.47
Bid-YTW : 4.71 % |
| SLF.PR.B |
Deemed-Retractible |
1.15 % |
YTW SCENARIO
Maturity Type : Hard Maturity
Maturity Date : 2025-01-31
Maturity Price : 25.00
Evaluated at bid price : 23.85
Bid-YTW : 5.39 % |
| ENB.PR.H |
FixedReset |
1.16 % |
YTW SCENARIO
Maturity Type : Limit Maturity
Maturity Date : 2045-05-27
Maturity Price : 18.31
Evaluated at bid price : 18.31
Bid-YTW : 4.55 % |
| ENB.PR.F |
FixedReset |
1.25 % |
YTW SCENARIO
Maturity Type : Limit Maturity
Maturity Date : 2045-05-27
Maturity Price : 19.50
Evaluated at bid price : 19.50
Bid-YTW : 4.68 % |
| ENB.PR.N |
FixedReset |
1.25 % |
YTW SCENARIO
Maturity Type : Limit Maturity
Maturity Date : 2045-05-27
Maturity Price : 20.21
Evaluated at bid price : 20.21
Bid-YTW : 4.67 % |
| BAM.PR.R |
FixedReset |
1.38 % |
YTW SCENARIO
Maturity Type : Limit Maturity
Maturity Date : 2045-05-27
Maturity Price : 21.24
Evaluated at bid price : 21.24
Bid-YTW : 4.14 % |
| SLF.PR.A |
Deemed-Retractible |
1.46 % |
YTW SCENARIO
Maturity Type : Hard Maturity
Maturity Date : 2025-01-31
Maturity Price : 25.00
Evaluated at bid price : 23.70
Bid-YTW : 5.42 % |
| FTS.PR.H |
FixedReset |
1.52 % |
YTW SCENARIO
Maturity Type : Limit Maturity
Maturity Date : 2045-05-27
Maturity Price : 16.65
Evaluated at bid price : 16.65
Bid-YTW : 3.78 % |
| ENB.PR.P |
FixedReset |
1.56 % |
YTW SCENARIO
Maturity Type : Limit Maturity
Maturity Date : 2045-05-27
Maturity Price : 19.51
Evaluated at bid price : 19.51
Bid-YTW : 4.69 % |
| BAM.PR.X |
FixedReset |
1.59 % |
YTW SCENARIO
Maturity Type : Limit Maturity
Maturity Date : 2045-05-27
Maturity Price : 18.50
Evaluated at bid price : 18.50
Bid-YTW : 4.18 % |
| HSE.PR.A |
FixedReset |
1.66 % |
YTW SCENARIO
Maturity Type : Limit Maturity
Maturity Date : 2045-05-27
Maturity Price : 17.15
Evaluated at bid price : 17.15
Bid-YTW : 4.22 % |
| BAM.PR.C |
Floater |
1.77 % |
YTW SCENARIO
Maturity Type : Limit Maturity
Maturity Date : 2045-05-27
Maturity Price : 14.91
Evaluated at bid price : 14.91
Bid-YTW : 3.38 % |
| ENB.PR.D |
FixedReset |
1.88 % |
YTW SCENARIO
Maturity Type : Limit Maturity
Maturity Date : 2045-05-27
Maturity Price : 19.00
Evaluated at bid price : 19.00
Bid-YTW : 4.64 % |
| ENB.PR.B |
FixedReset |
1.97 % |
YTW SCENARIO
Maturity Type : Limit Maturity
Maturity Date : 2045-05-27
Maturity Price : 19.14
Evaluated at bid price : 19.14
Bid-YTW : 4.60 % |
| MFC.PR.B |
Deemed-Retractible |
2.32 % |
YTW SCENARIO
Maturity Type : Hard Maturity
Maturity Date : 2025-01-31
Maturity Price : 25.00
Evaluated at bid price : 23.39
Bid-YTW : 5.51 % |
| MFC.PR.L |
FixedReset |
2.38 % |
YTW SCENARIO
Maturity Type : Hard Maturity
Maturity Date : 2025-01-31
Maturity Price : 25.00
Evaluated at bid price : 23.65
Bid-YTW : 4.19 % |
| BAM.PR.B |
Floater |
2.52 % |
YTW SCENARIO
Maturity Type : Limit Maturity
Maturity Date : 2045-05-27
Maturity Price : 15.08
Evaluated at bid price : 15.08
Bid-YTW : 3.34 % |
| BAM.PR.K |
Floater |
3.32 % |
YTW SCENARIO
Maturity Type : Limit Maturity
Maturity Date : 2045-05-27
Maturity Price : 14.93
Evaluated at bid price : 14.93
Bid-YTW : 3.37 % |
| Volume Highlights |
| Issue |
Index |
Shares
Traded |
Notes |
| BMO.PR.S |
FixedReset |
226,190 |
Scotia crossed 200,000 at 24.50. Nice ticket!
YTW SCENARIO
Maturity Type : Limit Maturity
Maturity Date : 2045-05-27
Maturity Price : 23.06
Evaluated at bid price : 24.48
Bid-YTW : 3.48 % |
| RY.PR.G |
Deemed-Retractible |
75,750 |
TD crossed 75,000 at 25.35.
YTW SCENARIO
Maturity Type : Call
Maturity Date : 2015-06-26
Maturity Price : 25.25
Evaluated at bid price : 25.32
Bid-YTW : 1.53 % |
| BMO.PR.Q |
FixedReset |
47,150 |
Nesbitt crossed 32,700 at 23.58.
YTW SCENARIO
Maturity Type : Hard Maturity
Maturity Date : 2022-01-31
Maturity Price : 25.00
Evaluated at bid price : 23.55
Bid-YTW : 3.51 % |
| BNS.PR.Z |
FixedReset |
37,700 |
TD crossed two blocks of 16,000 each, both at 23.75.
YTW SCENARIO
Maturity Type : Hard Maturity
Maturity Date : 2022-01-31
Maturity Price : 25.00
Evaluated at bid price : 23.71
Bid-YTW : 3.46 % |
| TRP.PR.A |
FixedReset |
35,430 |
TD crossed 30,000 at 20.80.
YTW SCENARIO
Maturity Type : Limit Maturity
Maturity Date : 2045-05-27
Maturity Price : 20.51
Evaluated at bid price : 20.51
Bid-YTW : 3.76 % |
| TRP.PR.F |
FloatingReset |
32,700 |
TD crossed 30,000 at 19.35. Perhaps related to the above?
YTW SCENARIO
Maturity Type : Limit Maturity
Maturity Date : 2045-05-27
Maturity Price : 19.21
Evaluated at bid price : 19.21
Bid-YTW : 3.32 % |
| There were 25 other index-included issues trading in excess of 10,000 shares. |
| Wide Spread Highlights |
| Issue |
Index |
Quote Data and Yield Notes |
| GWO.PR.N |
FixedReset |
Quote: 17.28 – 17.90
Spot Rate : 0.6200
Average : 0.4160
YTW SCENARIO
Maturity Type : Hard Maturity
Maturity Date : 2025-01-31
Maturity Price : 25.00
Evaluated at bid price : 17.28
Bid-YTW : 7.02 % |
| GWO.PR.S |
Deemed-Retractible |
Quote: 26.26 – 26.75
Spot Rate : 0.4900
Average : 0.3126
YTW SCENARIO
Maturity Type : Hard Maturity
Maturity Date : 2025-01-31
Maturity Price : 25.00
Evaluated at bid price : 26.26
Bid-YTW : 4.73 % |
| PWF.PR.A |
Floater |
Quote: 17.70 – 18.35
Spot Rate : 0.6500
Average : 0.4894
YTW SCENARIO
Maturity Type : Limit Maturity
Maturity Date : 2045-05-27
Maturity Price : 17.70
Evaluated at bid price : 17.70
Bid-YTW : 2.83 % |
| HSB.PR.C |
Deemed-Retractible |
Quote: 25.40 – 25.80
Spot Rate : 0.4000
Average : 0.2515
YTW SCENARIO
Maturity Type : Call
Maturity Date : 2015-06-26
Maturity Price : 25.00
Evaluated at bid price : 25.40
Bid-YTW : -4.74 % |
| CIU.PR.C |
FixedReset |
Quote: 16.35 – 17.00
Spot Rate : 0.6500
Average : 0.5149
YTW SCENARIO
Maturity Type : Limit Maturity
Maturity Date : 2045-05-27
Maturity Price : 16.35
Evaluated at bid price : 16.35
Bid-YTW : 3.80 % |
| GWO.PR.R |
Deemed-Retractible |
Quote: 24.81 – 25.19
Spot Rate : 0.3800
Average : 0.2491
YTW SCENARIO
Maturity Type : Hard Maturity
Maturity Date : 2025-01-31
Maturity Price : 25.00
Evaluated at bid price : 24.81
Bid-YTW : 5.03 % |